

Brian Blase, Ph.D., is the President of Paragon Health Institute. Brian was Special Assistant to the President for Economic Policy at the White House’s National Economic Council (NEC) from 2017-2019, where he coordinated the development and execution of numerous health policies and advised the President, NEC director, and senior officials. After leaving the White House, Brian founded Blase Policy Strategies and served as its CEO.
Rising Hospital Prices, Plummeting Drug Prices, and Another Win for the One Big Beautiful Bill
Today’s newsletter consists of a new PIC and a new Prognosis. The PIC, by John Graham, discusses the major decline in prescription drug prices over the past year and compares that decline with the continued upward march of hospital prices. The Prognosis, which I authored, reviews the new report from economists at the Department of Health and Human Services that explains and quantifies the large benefits to American families from the Medicaid financing reforms contained in the One Big Beautiful Bill.
Before those, I’d like to invite you to a discussion on September 3 that Paragon will host with Abe Sutton, the Director of the Center for Innovation at the Centers for Medicare and Medicaid Services. This event will be particularly fun for me because I had the pleasure of assigning Abe work when we were both at the National Economic Council from 2017 to 2018. Sign up for the event here.
Prescription Drug Prices Drop Even Faster Than in First Trump Administration—Hospital Price Inflation Still Hot
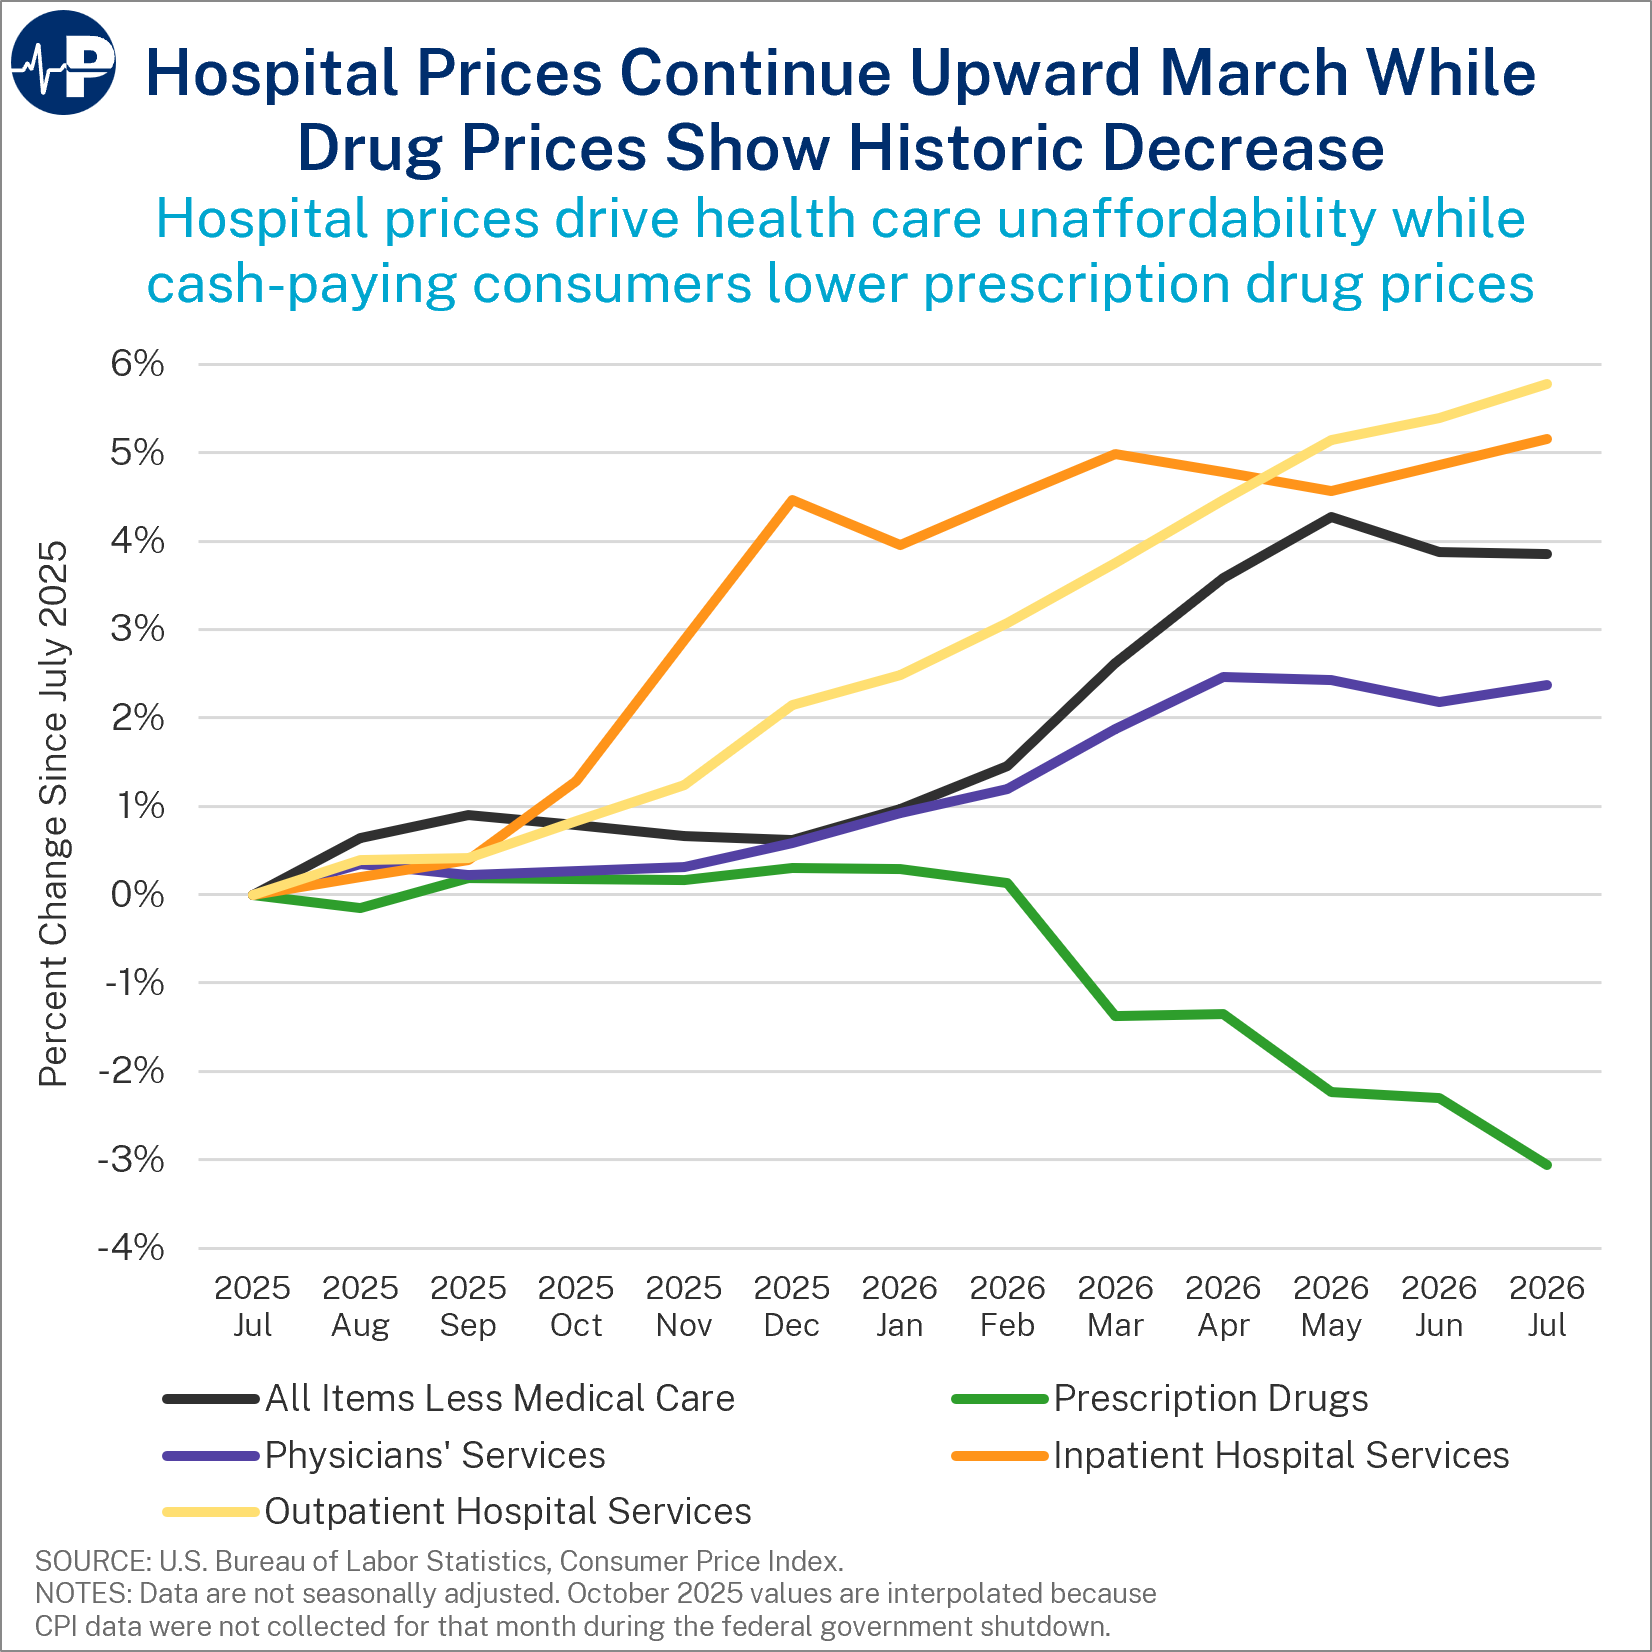
The media described the Consumer Price Index (CPI) report for July as showing inflation cooling for the second month in a row. One major exception is hospital prices, which continue to rise rapidly. Hospitals account for 31 percent of health spending, and prices for inpatient and outpatient services rose 5.2 percent and 5.9 percent respectively over the past year, nearly on par with what we found in last year’s Paragon PIC discussing inflation for the twelve months through July 2025. Prices for physician services grew about one and a half percentage points slower than prices for all items less medical care.
Most remarkable is the significant decline in prescription drug prices, a drop of 3.1 percent over the last twelve months—the largest decline in over six decades.1 Although retail prescription drugs only account for 9 percent of health spending, this is a welcome trend. It’s also reminiscent of the first Trump term. In the March 2019 Economic Report of the President, the Council of Economic Advisers (CEA) explained that “For the first time in 46 years, the Consumer Price Index for prescription drugs fell in both nominal and real terms during a calendar year” (p. 198). The CEA showed that prescription drug prices had been increasing about five percentage points faster than Personal Consumption Expenditures (PCE) from 2013 to the end of 2016. Beginning in 2017, they grew by only one percentage point faster than PCE (p. 236, fig. 4.7).2
The figure shows that the fall in drug prices started in February 2026. One notable development that month was the launch of TrumpRx, the Administration’s direct-to-consumer (DTC) website where patients can buy discounted medicines. TrumpRx launched with 43 branded medicines available and has since added many more drugs, so that it now offers over 800 medicines.
TrumpRx is a storefront that operates through vendors like GoodRx, Mark Cuban’s Cost Plus Pharmacy, and manufacturers’ own discount programs. These cash-pay channels bypass many of the “middlemen” that drive up drug prices and have gradually increased their own market share, up to about 9 percent of transactions in 2022. Even patients who have insurance coverage for outpatient drugs often find it less expensive to pay cash.
According to one market expert, “As cash-pay prices appear on a federally promoted platform, a new layer of public transparency sets in. Patient expectations around what a drug should cost could begin to anchor around those figures, creating internal pressure on manufacturers to rationalize the relationships between list price, net price, and DTC price.” Another industry insider credits a clarification from the U.S. Department of Health and Human Services Inspector General that manufacturers can sell directly to Medicare and Medicaid enrollees without triggering the Anti-Kickback Statute.
The benefit of DTC is most apparent with GLP-1s, the anti-obesity medications that have become very widely used. GLP-1s were among the first drugs available on TrumpRx in February, and the Administration also launched a demonstration called BRIDGE that allows Medicare beneficiaries to access them for a $50 copay. However, Medicare Part D insurers cover GLP-1s for diabetes or some other conditions but not obesity alone. Only 36 percent of employer-sponsored plans cover GLP-1 drugs for obesity—usually only with prior authorization—and that share is falling. The result is that the market for GLP-1 drugs is a consumer-driven market.
It is too early to estimate how much of the recent drug price reduction can be attributed to DTC platforms like TrumpRx. Since generics account for more than 90 percent of prescriptions, the steady approval of generic applications (particularly first generics) is an important driver of lower prices. Others are attributing a portion of the decline to the Inflation Reduction Act (IRA). Medicare implemented negotiated prices for the first ten drugs subject to the IRA in January 2026. However, the timing and persistence of the decline make it difficult to attribute much of the trend to the IRA. The first negotiated prices took effect at a single point in January and applied to only ten drugs, but there was no significant price reduction that month, and the negotiated prices would not have kept trending down.
The precise causes of the historic decline in prescription drug prices will take time to disentangle, but consumers are clearly benefiting from greater competition and new ways to purchase medicines. The contrast with hospital care is striking: while drug prices are falling at their fastest rate in decades, hospital prices continue their relentless rise.
The Massive Win of OBBB’s Medicaid Financing Reforms: HHS Economists Find Lower Health Care Prices on Top of Sizeable Taxpayer Savings
The One Big Beautiful Bill (OBBB) contained significant Medicaid financing reforms to address state schemes that have shifted hundreds of billions of dollars in Medicaid costs to federal taxpayers. A new report from the Assistant Secretary for Planning and Evaluation (ASPE) at HHS shows that the benefits extend well beyond the substantial taxpayer savings. By reducing provider taxes and excessive state-directed payments (SDPs), the reforms are projected to lower prices and increase access to care for Americans outside Medicaid. ASPE estimates those benefits at between $502 billion and $875 billion from 2025 through 2034.
States Shifting Medicaid Costs to Washington
The federal government provides an open-ended reimbursement of state Medicaid expenditures. States have large incentives to structure their programs to maximize federal payments while minimizing their own contributions. Provider taxes and SDPs became increasingly important tools for doing this. States tax hospitals and other providers and use the revenue to finance the state’s share of Medicaid. The federal government then matches that spending. SDPs then direct Medicaid managed care plans to make additional payments to providers. According to ASPE, in 2022 about two-thirds of the nonfederal share of SDP funding was financed through provider taxes or intergovernmental transfers, through which government providers transfer funds to state Medicaid agencies to draw down federal matching funds. These arrangements shift costs from states to Washington and, as HHS puts it, “reduce states’ incentives to be prudent purchasers of services.”
SDP Spending Exploded Despite Unproven Benefits for Patients
The number of services receiving approved SDPs increased from only 34 in 2017 to 1,667 in 2025, while annual SDP spending more than tripled in four years, from $43 billion in 2021 to $144 billion in 2025. This growth far exceeded earlier expectations, and CMS actuaries projected SDP spending would reach $316 billion annually without reform. Yet ASPE finds “no evidence that the dramatic increase in SDP spending has been associated with any commensurate improvement in quality of care.”
Medicaid Managed Care Became an End Run Around Payment Limits
Federal rules have long limited aggregate Medicaid fee-for-service payments to what Medicare would have paid for equivalent services. But states increasingly used managed care SDPs to get around those limits. The Biden administration’s 2024 managed care rule clarified that certain SDPs could reach average commercial rates (ACR). ASPE finds that among states with approved SDPs using the ACR benchmark, base Medicaid payments averaged 96 percent of Medicare rates. After SDPs were included, payments averaged 186 percent of Medicare rates. CMS approved some SDPs reaching 350 percent of Medicare rates.
Higher Commercial Prices Could Generate Still More Medicaid Money
Tying SDPs to commercial prices created an especially damaging incentive. ASPE explains that “by linking SDPs to the ACR, hospitals have an added incentive to negotiate higher commercial rates, increasing costs to commercial insurance beneficiaries as well.” Higher commercial prices permit higher Medicaid payments and therefore more federal matching dollars. Importantly, ASPE does not include this incentive in its model, suggesting its estimates likely understate the benefits of reform.
OBBB Attacks Both Sides of the Financing Scheme
For major categories of SDPs, Medicaid expansion states will generally be limited to 100 percent of Medicare rates, while non-expansion states will be limited to 110 percent. The law also restricts states’ ability to create or expand provider taxes and gradually lowers the provider-tax safe-harbor threshold in expansion states from 6 percent to 3.5 percent. The reforms reduce states’ ability to manufacture their share of Medicaid spending through provider taxes while also limiting the excessive payments used to draw down additional federal dollars. The OBBB appropriately distinguished between expansion and non-expansion states since states can generate $9 in federal funds with $1 of state financing gimmicks for expansion enrollees—seven times more than the amount they can generate on average for traditional enrollees.
Lower Provider Taxes Mean Lower Prices for American Families
Provider taxes increase the cost of supplying health care, and providers pass some of that cost on to commercial payers. ASPE estimates that OBBB will reduce non-Medicaid prices by as much as 3.5 percent in markets with provider taxes. This finding is consistent with a Paragon study by Liam Sigaud and Eric Sun that found that a California hospital tax was associated with a 4 percent increase in prices. ASPE estimates that each one-percentage-point reduction in provider tax rates reduces prices paid by non-Medicaid payers by 0.72 percent through this effect.
Reducing Excessive Medicaid Payments Frees Resources for Other Patients
Excessive Medicaid payments make treating Medicaid patients more financially attractive relative to other patients. Reducing provider taxes and excessive SDPs frees health care resources for patients with Medicare and commercial coverage. ASPE estimates that this effect reduces non-Medicaid prices by another 0.69 percent for each one-percentage-point reduction in provider taxes. Combined with the direct effect of lower provider taxes, non-Medicaid prices fall by about 1.4 percent for each percentage-point reduction in provider tax rates.
Up to $875 Billion in Benefits for Non-Medicaid Consumers
ASPE estimates that OBBB’s provider-tax and related Medicaid financing reforms will generate $502 billion to $875 billion in benefits for non-Medicaid consumers over the 2025–2034 period. When fully phased in, the reforms will reduce total federal health spending by an average of 2.9 to 5.1 percent, according to ASPE’s calculations. Roughly 60 percent of the benefit comes from lower health care prices, with the other 40 percent reflecting the value of additional care that consumers purchase as prices fall.
Taxpayers Benefit Several Times Over
These gains are on top of OBBB’s direct savings to taxpayers from lowering Medicaid spending. Lower commercial health care prices produce additional federal savings by reducing Medicare costs and the tax expenditure for employer-sponsored health insurance. ASPE also finds that the reforms should reduce inflationary pressures. The direct federal savings also produce broader economic benefits by reducing the need for taxation or borrowing and the associated economic losses. CBO’s score of OBBB did not fully account for these dynamics, while ASPE’s more expansive analysis estimates larger federal savings.
There Is No Free Medicaid Money
Provider taxes, IGTs, and excessive SDPs do not create free resources for health care. They shift costs to federal taxpayers, weaken states’ incentives to obtain value, distort providers’ behavior, and raise costs for Americans outside Medicaid. OBBB’s reforms are much-needed improvements to the status quo. Federal taxpayers save from lower Medicaid spending, while workers and families benefit from lower health care prices and greater access to care. ASPE’s analysis shows that the economic benefits of Medicaid financing reform are substantially larger than the federal budget savings alone.
Assistant Secretary for Planning and Evaluation (ASPE), Center for Medicare and Medicaid Innovation (CMMI), Congressional Budget Office (CBO), Consumer Price Index (CPI), direct-to-consumer (DTC), Drugs, GLP-1, Hospitals, Inflation Reduction Act of 2022, Intergovernmental transfer (IGT), One Big Beautiful Bill (OBBB), Prices, State Directed Payments (SDP), TrumpRx
Recent Newsletters


Subscribe
Sign up now for your health policy updates.