



Key Takeaways
- Provider taxes, utilized by 49 states, create a double windfall for hospitals: They increase commercial prices while generating higher Medicaid payments.
- Estimates suggest that 45–80 percent of a provider tax would be passed on to commercial patients, so a 6 percent tax on hospital revenues would increase commercial prices for hospital services by about 3–5 percent.
- A California hospital tax in 2010 was associated with an increase in commercial hospital prices of roughly 3–4 percent relative to prices in neighboring states.
- More states have tied Medicaid payments to commercial insurance rates in recent years, likely resulting in higher commercial prices and representing a cost borne by workers through higher health insurance premiums.
Introduction
Provider taxes are state-imposed assessments on health care providers that are used to boost federal Medicaid funding and increase provider payment rates. They are levied on providers such as hospitals and nursing homes. All but one state imposes provider taxes, and their use has expanded rapidly over the past two decades.1 As documented by Paragon Health Institute2 and others,3 these taxes serve as a means for states to substantially increase federal Medicaid payments, undermining the program’s design as a federal-state partnership. In this policy brief, we discuss another negative aspect of these taxes: their impact on prices for patients with commercial health insurance.
We begin with a brief discussion of the economic theory of provider taxes, which leads to a unique finding: Provider taxes are unlike most taxes because the firms being taxed also receive revenues generated from the tax.4 As a result, these taxes provide a double windfall for health care providers: higher prices from privately insured patients (as we show in this brief) and the receipt of provider tax revenues after the state collects federal reimbursement, which may explain why these taxes constitute a rare example of a tax that is enthusiastically supported by the affected industry. In many cases, industry consultants are even involved in developing these tax schemes.
Turning to the data, we confirm this prediction in California, which adopted fairly large hospital taxes about 15 years ago and subsequently experienced hospital price increases in the commercial market of roughly 3–4 percent relative to its neighboring states. We conclude that policymakers should consider the negative spillover effects of provider taxes on prices in the commercial market. Recent efforts in some states to tie Medicaid payments to commercial rates—along with the dramatic growth of so-called state-directed payments—compound these concerns.
The Economic Theory of Provider Taxes
In many states, provider taxes, such as taxes levied on hospitals, apply to all patients, including commercial patients. For Medicaid patients, the provider tax in some sense does not function as a true tax, because states both levy the tax and set Medicaid payment rates, which are partly a function of the additional federal money brought in by the tax. By contrast, in the commercial market, states only levy the provider tax; the payment rates for medical services are set through negotiations between insurers and health care providers. As such, the impact of provider taxes in the commercial market can be analyzed using standard models of taxation. In particular, standard economic theory predicts the following in response to the imposition of a new per-unit tax:
- The tax makes both consumers (patients) and firms (health care providers) worse off: Consumers will pay more than they did before the tax, while firms will receive less (net of taxes) than they did before the tax.
- The extent to which the burden of the tax falls on consumers (in the form of higher prices) versus firms (in the form of lower revenues) depends on the relative price sensitivities of both groups, with the burden of the tax tending to fall on the less price-sensitive party.
Economic theory thus predicts that provider taxes will lead to an increase in hospital prices in the commercial market. But what factors drive the size of this price increase? As noted above, the relative sensitivities of demand and supply in response to price play a critical role. For example, consider one extreme, where patients are completely insensitive to price—i.e., they will utilize the same amount of hospital services no matter the price. In that case, the tax does not change the level of health care utilization, but consumers absorb the full impact of the tax—the price they pay rises by the exact amount of the tax, while hospitals receive, net of tax, the same amount as they did before the tax was imposed. In other words, in this situation, hospitals are able to fully pass along the cost of the tax to patients. On the other hand, in the opposite situation, where hospitals are insensitive to price (i.e., they will supply the same quantity of services no matter the price), hospitals now bear the full brunt of the tax—patients pay the same amount as they did before the tax, but the amount hospitals receive now falls by the exact amount of the tax. These are extreme cases, of course. In practice, neither patients nor hospitals are completely insensitive to price, and the burden of the tax is shared between them.
There is another unique aspect of provider taxes: Tax revenues are returned to the hospitals themselves, in contrast to the usual situation in which tax revenues are used for more general purposes (i.e., sales taxes typically fund general state activities). As noted above, the imposition of a tax generally makes firms worse off as sales and prices (net of the tax) fall. However, in the unique situation of provider taxes, proceeds from the tax are used to pay hospitals at higher Medicaid rates. The added revenue from tax proceeds means that hospitals may increase their profits from the introduction of a provider tax. In general, total hospital revenue (revenue from the provision of services as well as the Medicaid payments received from the state) increases, and because utilization is lower with the taxes, costs are lower, and therefore profits are higher.5 In essence, provider taxes provide hospitals with a double windfall6: They can pass along the tax to commercially insured patients in the form of higher prices and the taxes are remitted back to the hospitals in the form of higher payments for Medicaid patients.7 This double benefit helps explain why provider taxes may be the only case in which an industry supports taxes levied on itself.8
To What Extent Can Hospitals Charge Higher Prices in Response to Provider Taxes?
As noted above, the extent to which provider taxes are passed on to patients in the form of higher prices depends on the relative degree to which patients and hospitals are sensitive to price changes. Indeed, it can be shown that the percentage of the tax that is passed on to consumers in the form of higher prices is given by the formula:
εs/(⌈εd⌉+εs)
where εd is the elasticity of demand, a measure of how sensitive patients are to price, and εs is the elasticity of supply, a measure of how sensitive hospitals are to price. For example, suppose εd and εs are both equal to 1. In this case, the formula states that 50 percent of the tax would be passed on to patients in the form of higher prices. Thus, in the case of a 6 percent tax on hospital revenue, prices would increase by 3 percent.
Intuitively, because health care—and hospital services in particular—are fairly important to patients, one might imagine that they would be fairly insensitive to price, and therefore a significant portion of provider taxes would be passed on to patients in the form of higher prices. Studies to date bear out the fact that consumers are fairly insensitive to health care price changes, with the large role of insurance and third-party payment in health care a likely reason why. Table 1 reports estimated demand elasticities for health care services from several studies. In general, economists consider an elasticity of demand of less than 1 to indicate insensitivity to price, with values closer to zero indicating greater insensitivity to price.9 Most of the reported elasticities in Table 1 are less than 1, indicating relatively inelastic demand). This is particularly true of the estimated demand elasticities for hospital services, as opposed to health care services in general.
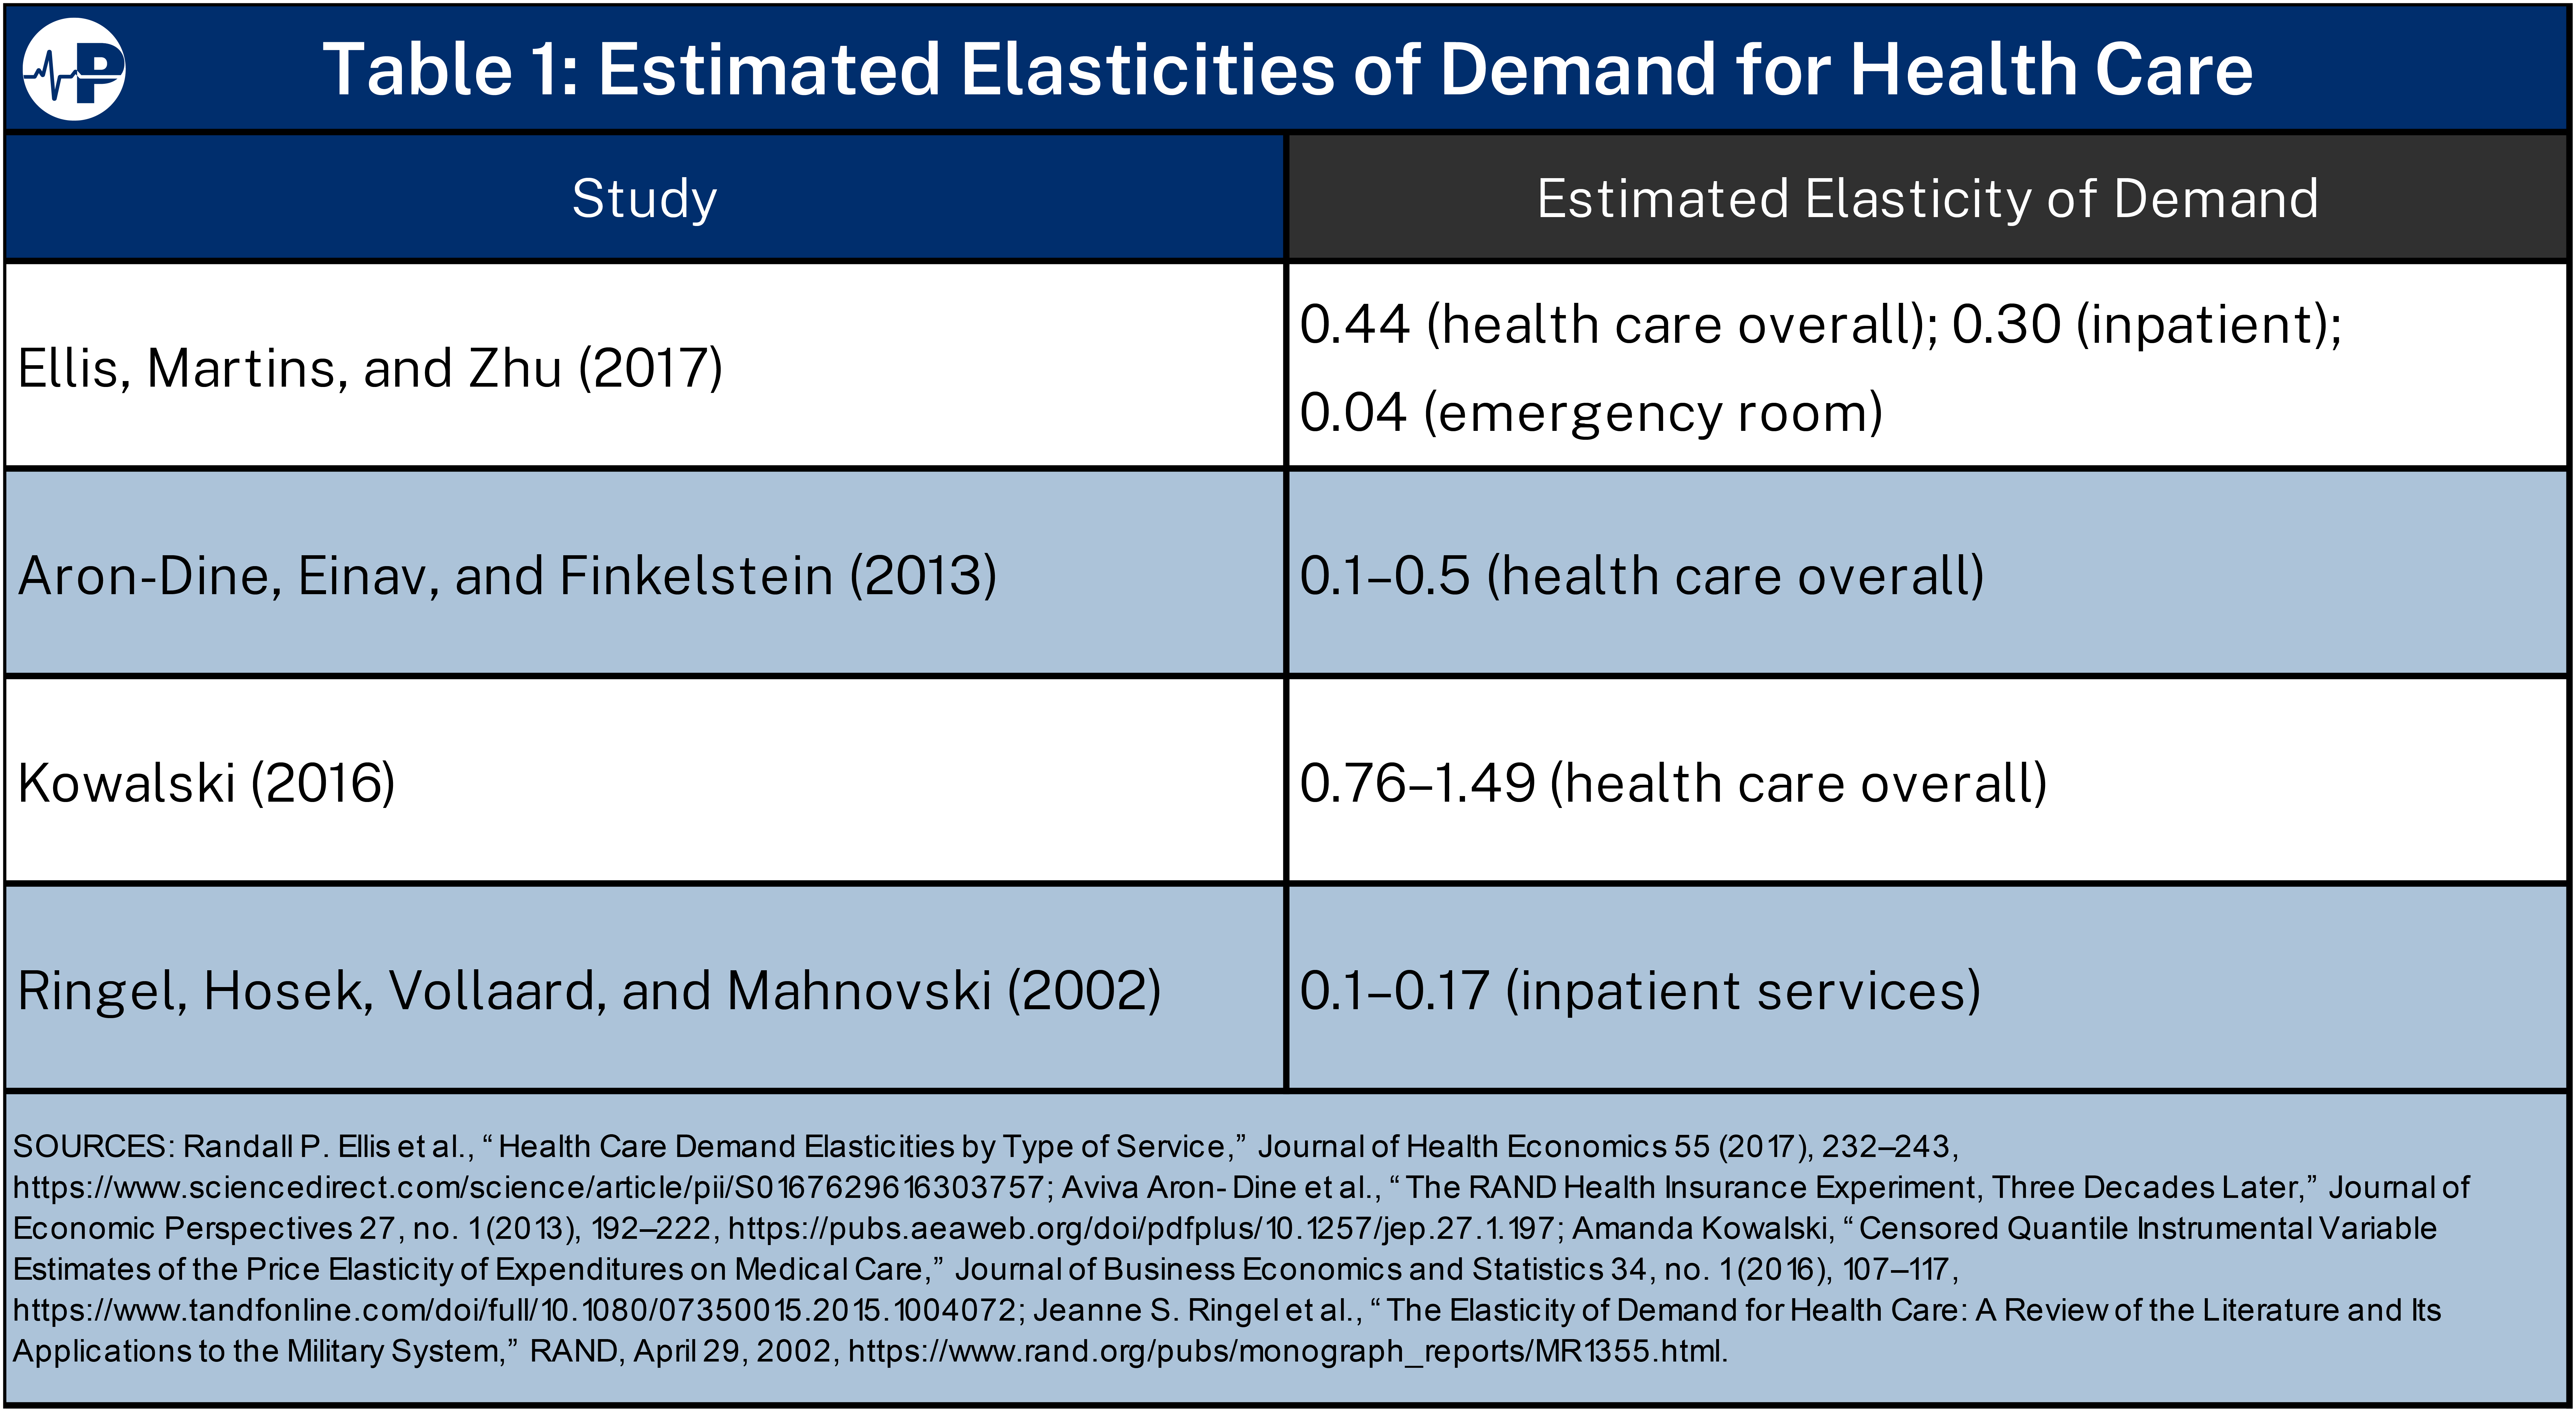
Fewer studies have estimated the elasticity of supply for health care services. One study10 estimated an elasticity of 1.5, and another11 similarly found an elasticity of 1.16, although both of these estimates were for physician (not hospital) services. Taken as a whole, the available literature suggests that because the supply of hospital services is more sensitive to price than demand, the majority of provider taxes will be passed on to patients in the form of higher prices. For example, the studies above suggest that the elasticity of demand for hospital services is somewhere in the 0.2–0.3 range. If we assume an elasticity of demand of 0.3 and an elasticity of supply of 1.3 (the midpoint of the estimates from the two studies cited above), this would suggest that roughly 80 percent of the tax would be passed on to patients in the form of higher prices, so a 6 percent tax on provider revenues would increase prices by roughly 5 percent. Even if, as an extreme, we assume the largest elasticity of demand—1.49 from the studies above—and the smallest elasticity of supply—1.17—this would suggest that 45 percent of the provider tax would be passed on to patients in the form of higher prices, so a 6 percent tax on revenue would be expected to increase prices by 2.6 percent.
California: An Example of Provider Taxes Leading to Higher Commercial Prices
To examine the potential impact of provider taxes on hospital prices, we examined California’s introduction of a tax on inpatient hospital services in 2010. In 2014, the Government Accountability Office (GAO) conducted a detailed survey of provider taxes across all 50 states and the District of Columbia between 2008 and 2012.12 This survey not only covered the specific services that were taxed, such as whether taxes were levied on nursing homes or hospitals; it also provided data on the size and nature of the tax, such as whether the tax was levied on patient revenue and, if so, the amount of the tax. We chose to examine California because it introduced a sizeable tax during this period, ranging from $27.25 to $275 per bed per day, or $9,946.25 to $100,375 per bed per year.13
We obtained data on hospital prices from the Merative MarketScan Research Databases, a large dataset of administrative claims for commercially insured patients. The MarketScan databases provide detailed data on health care utilization and spending for over 270 million patients14 and have been used in numerous studies15 to analyze health care spending and utilization. For this study, we used data from the MarketScan Inpatient Admissions Table, which reports detailed data on inpatient admissions, including (a) the Diagnosis-Related Group (DRG) for an admission and (b) the total amount paid to the hospital for the admission. The DRG reports the primary reason for the admission and is typically used to determine payment for the admission. Because the GAO report provides data on taxes between 2008 and 2012, we obtained data on hospital prices between 2008 and 2012. In addition, while the GAO report did not cover 2007, KFF provides information on the presence (although not the size) of provider taxes in 2007.16 Because there were no changes in provider taxes for the states that we studied (see below) from 2007 to 2008, we included price data for 2007.17
A simple comparison of prices before and after the introduction of the California provider tax may be confounded by many factors. For example, inflation impacts health care services, so comparing prices before and after the introduction of a tax may simply reflect the effects of inflation. Therefore, for this analysis we utilized a technique called “difference-in-differences.”
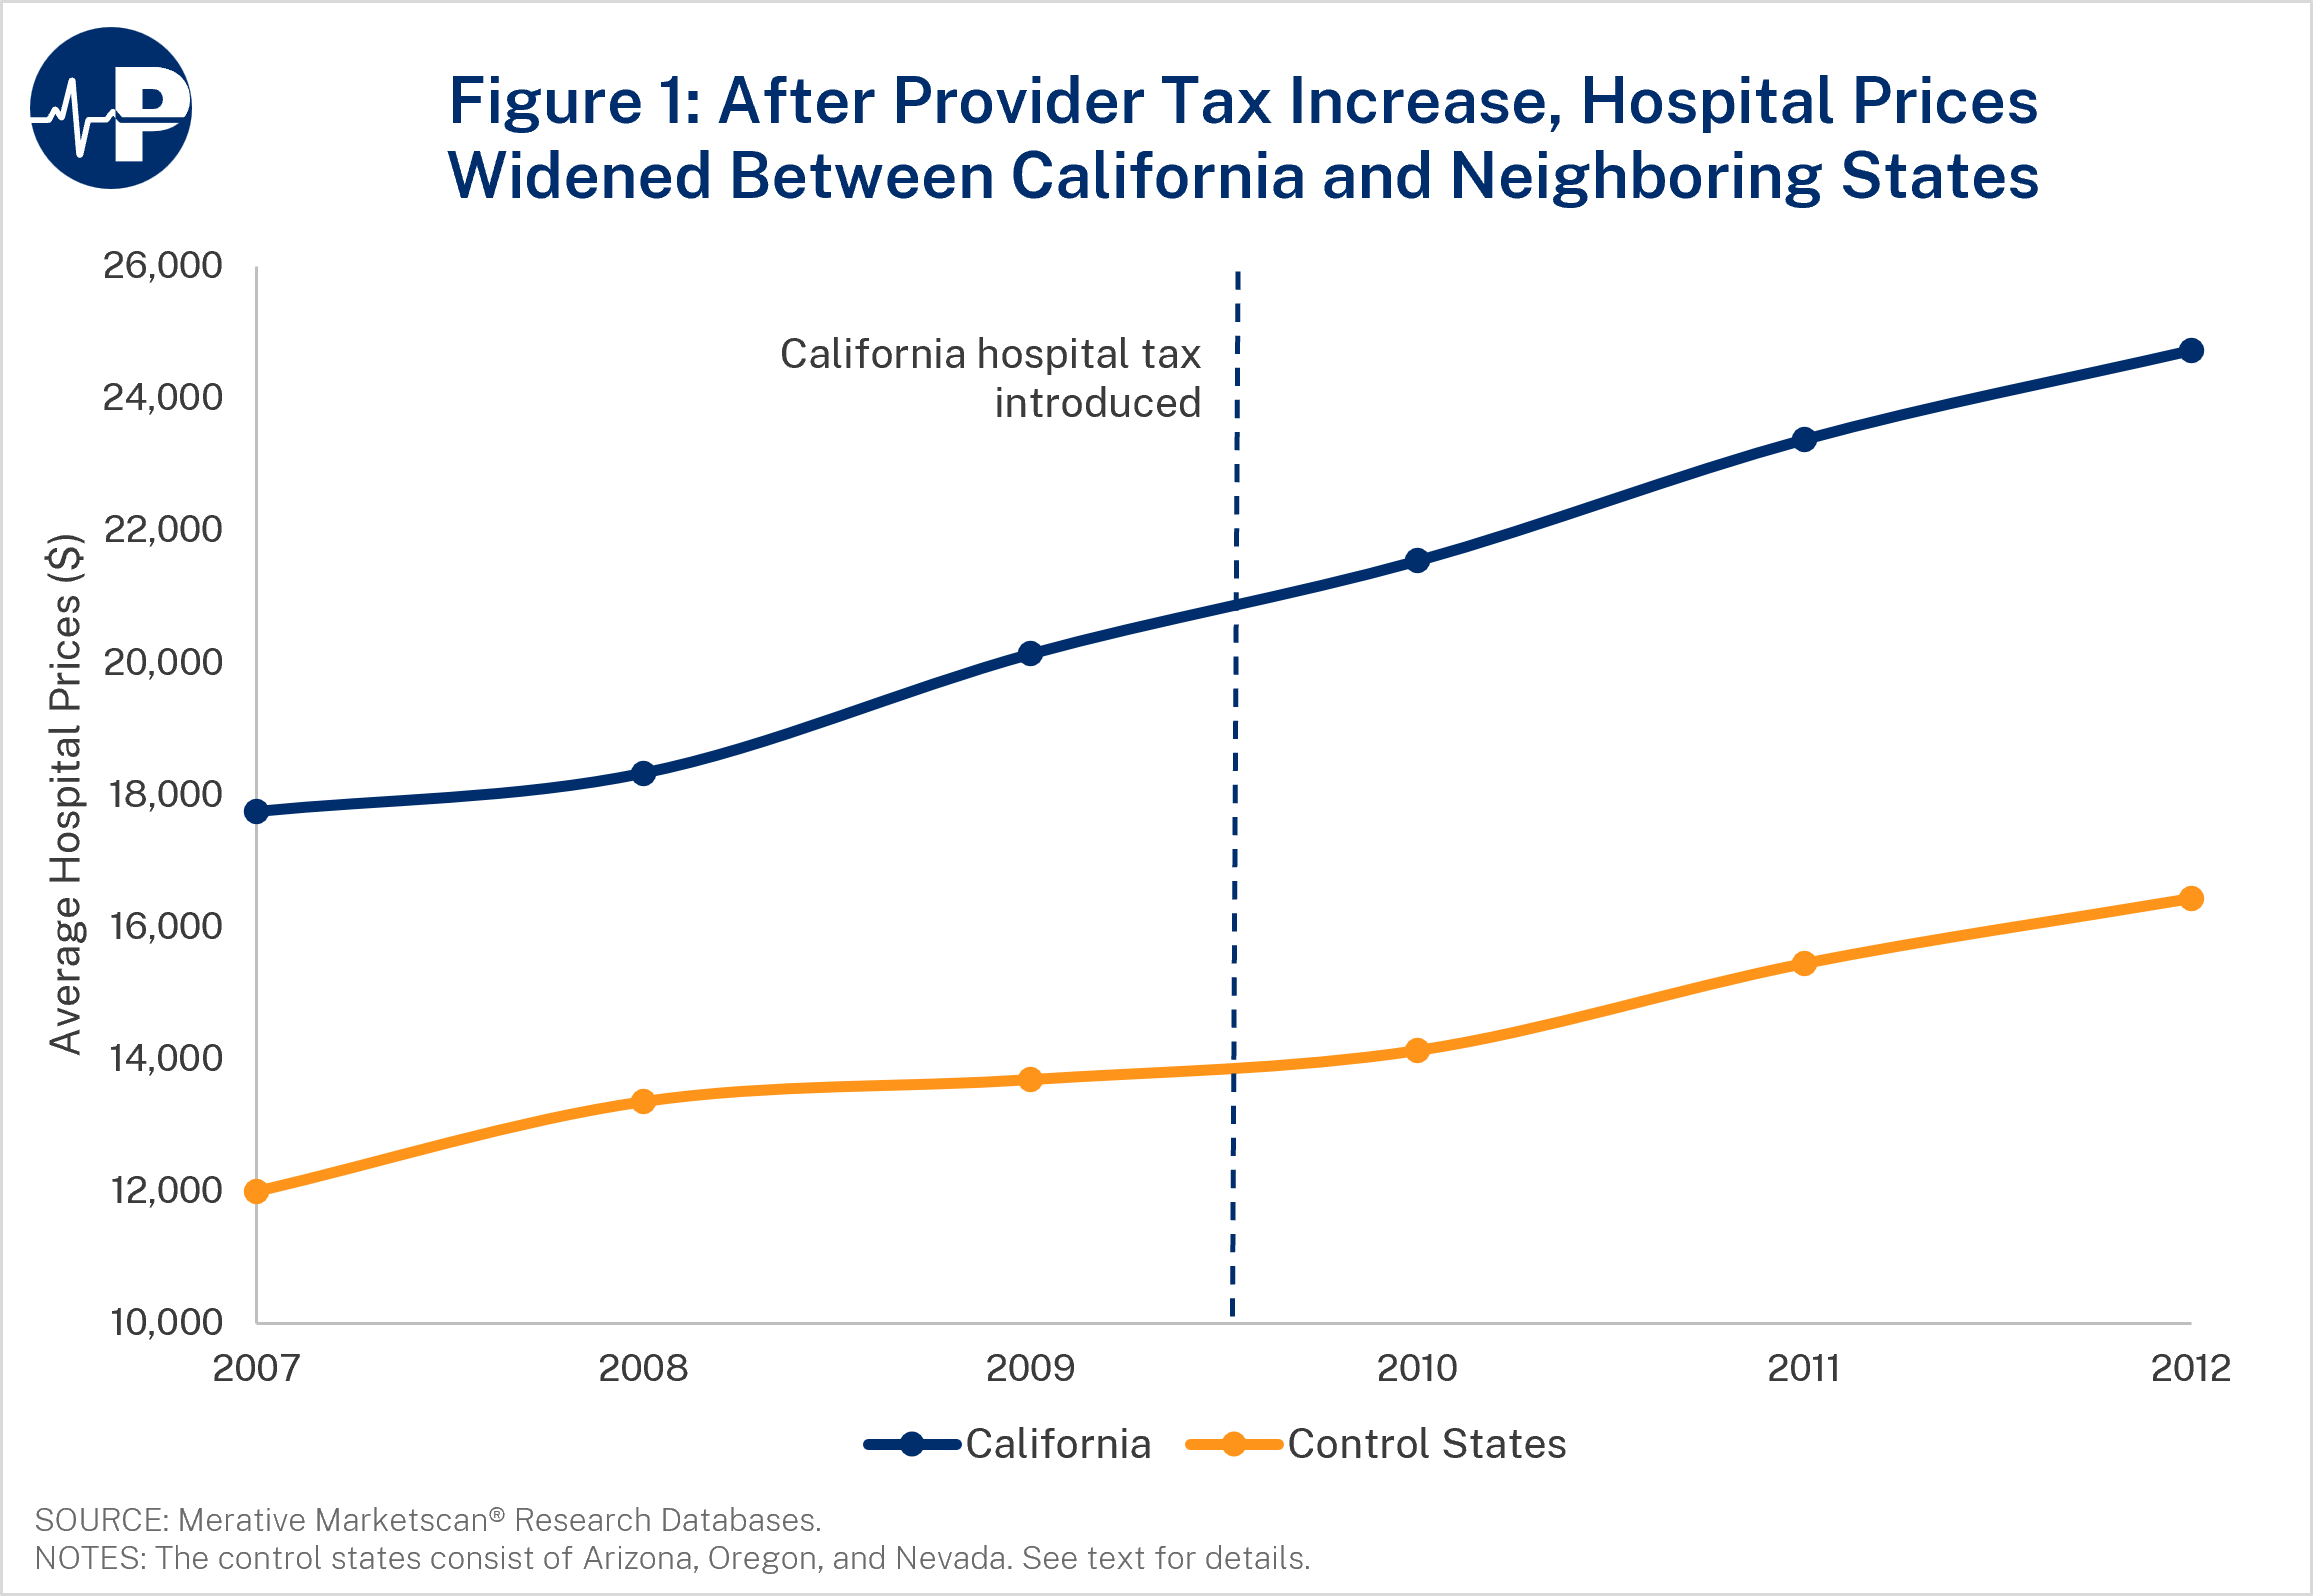
In this difference-in-differences approach, we begin by comparing hospital prices in California before and after the introduction of provider taxes on hospitals. We then compare those changes with changes in hospital prices (during the same period) in neighboring states (Arizona, Oregon, and Nevada) that did not have hospital taxes during this period. This second comparison uses these non-tax states as a control group to adjust for secular changes in prices (e.g., inflation) during this period. Put another way, the change in prices in the control states is used to estimate what the change in prices in California would have been in the absence of a provider tax.
Figure 1 illustrates this approach, as the figure plots average hospital prices in California compared to three control states between 2007 and 2012. We chose Arizona, Oregon, and Nevada as control states because they are the three states that border California. Prior to the introduction of a provider tax in 2010, the graph shows that prices in these three states increased at a fairly steady rate. However, Figure 1 shows that after the introduction of the tax, hospital prices in California grew more quickly relative to the growth in prices in neighboring states.
We formalize this approach using linear regression. To do so, we constructed an initial sample consisting of 1,537,557 inpatient admissions in California and its neighboring states. We then excluded the following from the sample: missing patient age (n=1,875), reported negative hospital payments (n=391), and patients who were insured by health maintenance organizations or capitated plans (n=494,880). We made the latter restriction because payments in these plans can often be made on a per-member basis rather than for individual services.18 Our final sample therefore consisted of 1,040,411 inpatient admissions.
We then performed a linear regression in which the dependent variable was the natural log of the payment to the hospital for the admission. We chose the natural log given the wide variation in payment amounts across states and DRGs. The primary independent variable was an indicator variable for whether the admission occurred after the introduction of the provider tax (July 1, 2010).19 To implement our difference-in-differences approach, we also included adjustments for year and state-DRG combinations (i.e., fixed effects for year of admission and state-DRG combination).20 We adjusted for state-DRG combinations in order to adjust for potential changes in case mix during this period. We also adjusted for patient age. In estimating these linear regression equations, we calculated our standard errors using the wild-cluster bootstrap method to adjust for clustering at the state level.21
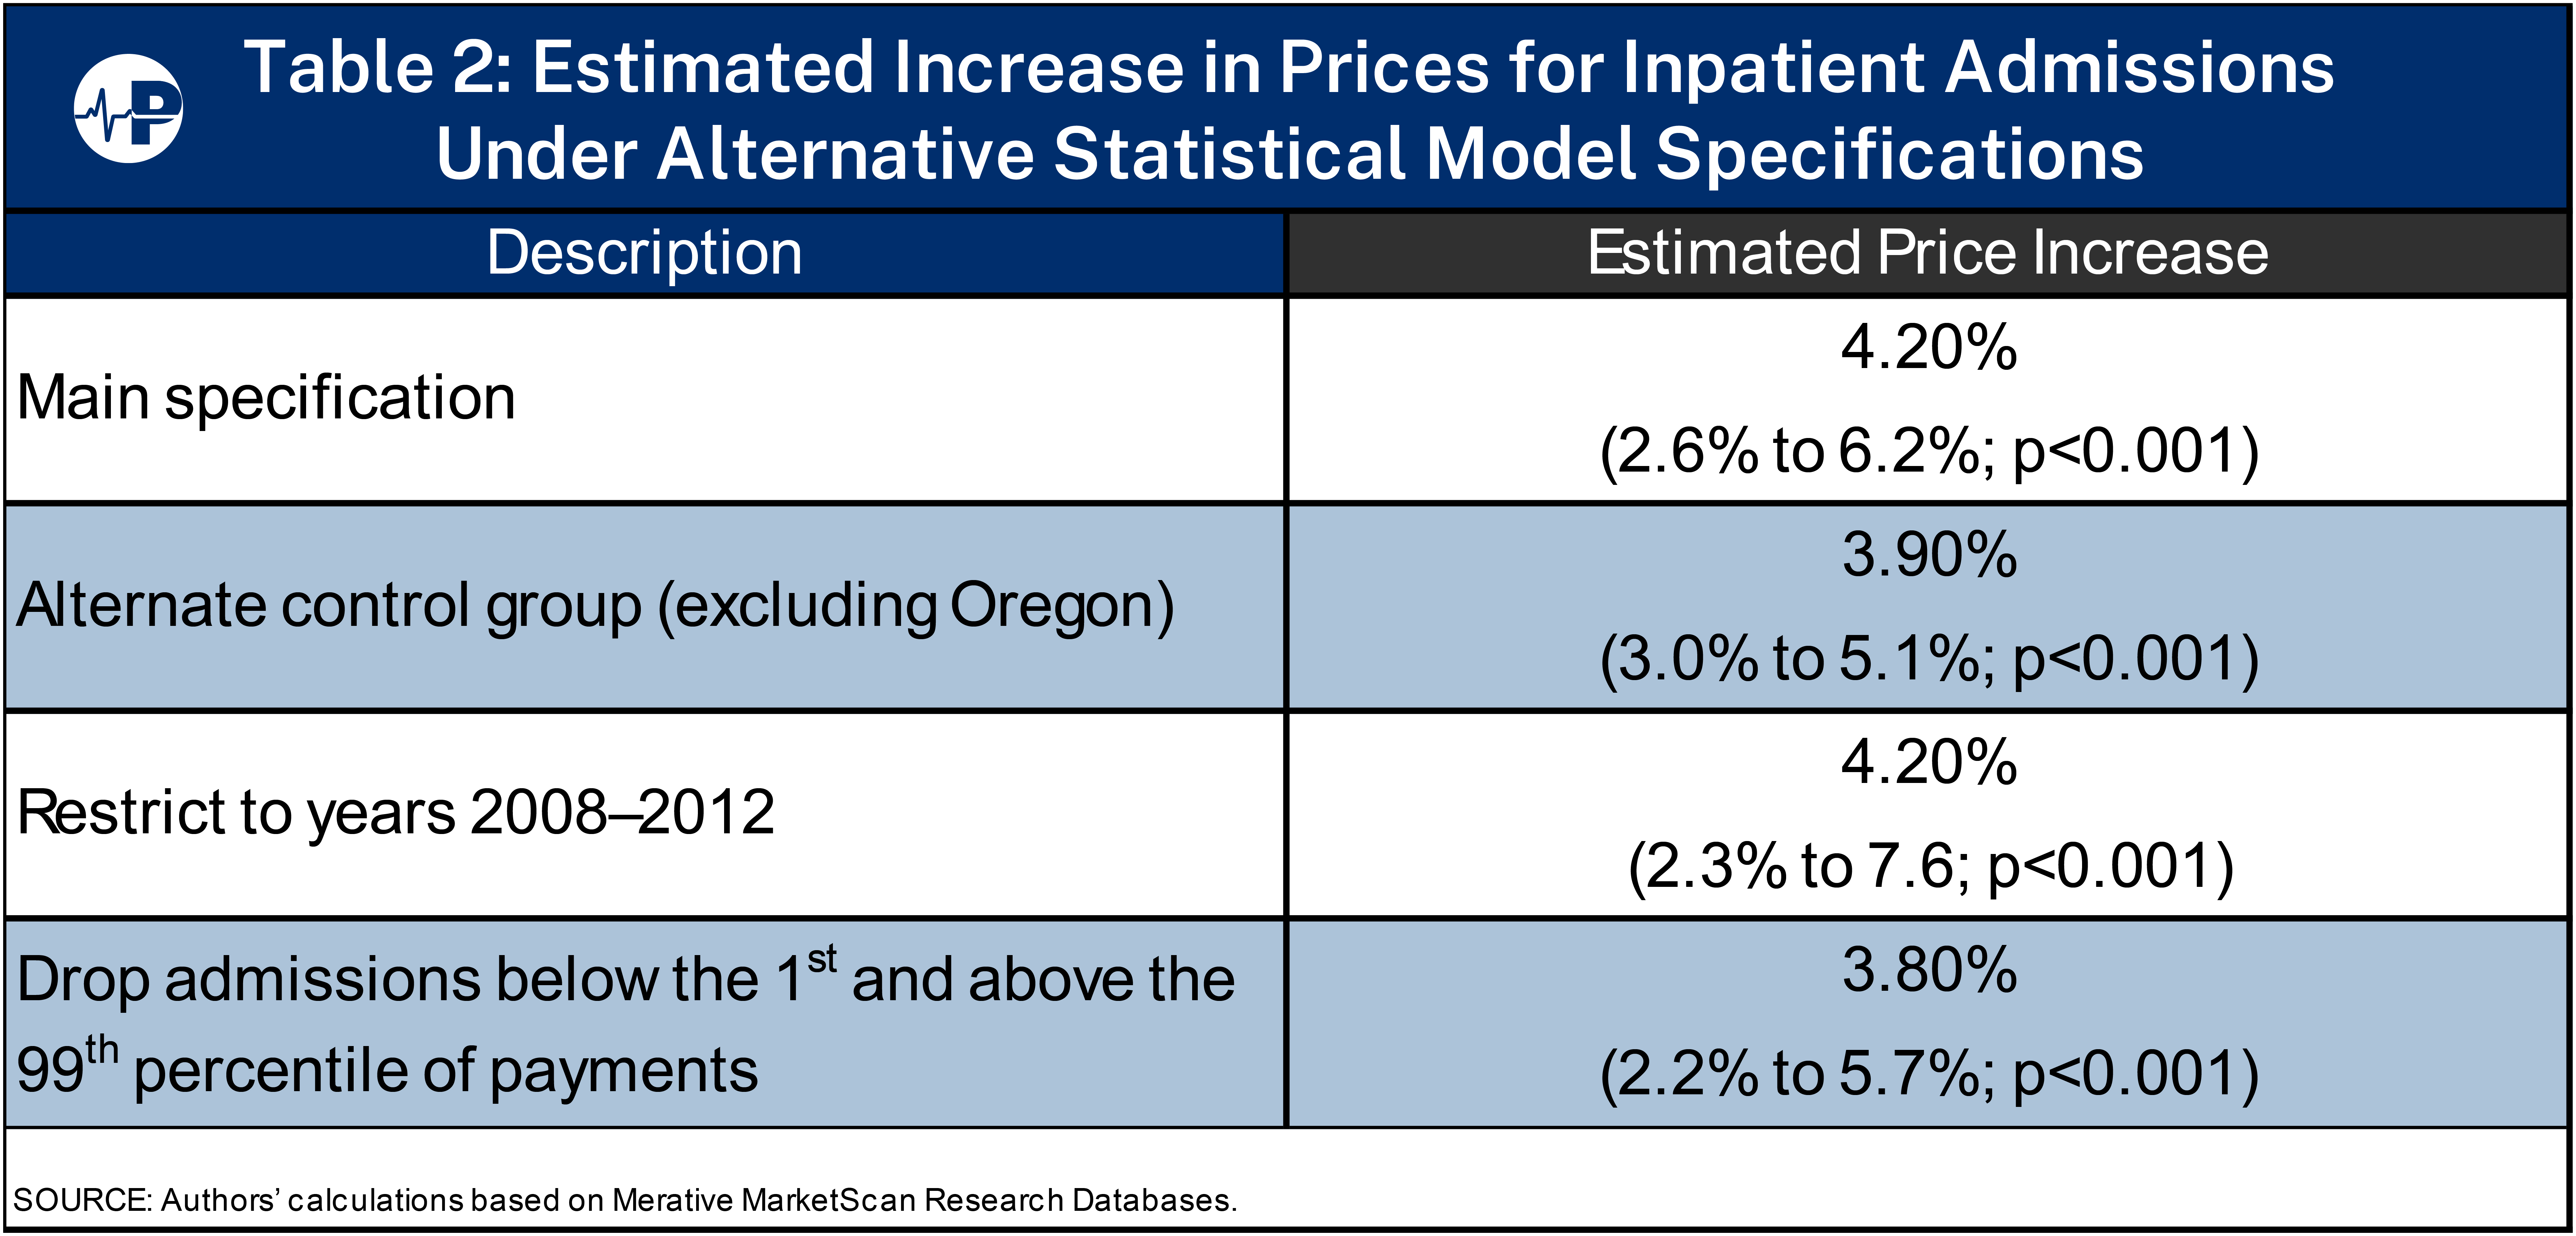
As shown in Table 2, our results suggest that the provider tax was associated with a 4.2% increase in hospital prices in California (95% CI 2.6% to 6.2%, p<0.001). We examined the extent to which this result held under alternative specifications. For example, Oregon had a provider tax in place as of 2005, so we estimated a specification in which we excluded Oregon as a control state. We also estimated a specification in which we restricted the data to the 2008–2012 time period, reflecting the years covered by the GAO report. Finally, we also estimated a specification in which we dropped admissions below the 1st percentile and above the 99th percentile of reported payments in order to exclude outliers and potential data errors. Our results were generally invariant to these alternative specifications.
Conclusions
Provider taxes are taxes imposed by states on health care providers, with the revenues from these taxes then used to fund higher Medicaid payments. The taxes have received substantial criticism for allowing states to receive far more federal funding than is economically efficient or consistent with the joint federal-state financing responsibilities for Medicaid. In this policy brief, we demonstrate that another problem with these taxes is that health care providers are likely to pass these taxes on to patients in the form of higher prices for privately insured patients, adding hidden costs for tens of millions of families. Over the last quarter-century, hospital prices have increased roughly three times faster than inflation and twice as fast as wage growth.22 Hospital care accounts for a large and growing share of health care spending. Provider tax schemes are likely one factor contributing to these trends by increasing commercial prices while simultaneously generating higher Medicaid payments for providers.
As we show, this is a standard result from economic theory, but there are two factors that are unique to provider taxes. First, because patients are fairly insensitive to health care prices, economic theory suggests that the majority of provider taxes will be passed on to patients in the form of higher prices as opposed to providers absorbing lower (after-tax) payments for their services. Second, these taxes provide a unique double windfall for health care providers: the ability to charge higher prices to privately insured patients and the ability to receive higher payments for publicly insured patients. This dynamic helps explain why provider taxes are unusual among taxes: The industry ostensibly subject to the tax is often one of its strongest supporters. Moreover, a real-world case study supports the economic theory, as provider taxes in California were associated with a 4 percent increase in the amounts paid for hospital admissions. While this effect may seem quantitatively modest, it is important to note that most Americans obtain their health insurance through the commercial market.
Thus, both economic theory and empirical evidence suggest that provider taxes raise prices for privately insured patients. In essence, the term provider taxes may be a misnomer, as the taxes are ultimately borne by two groups—privately insured patients, who face higher prices, and federal taxpayers, who finance the additional federal Medicaid matching payments. Notably absent from this list are the providers on whom the taxes are nominally imposed. In addition to eliminating an important source of waste and abuse in the Medicaid program, lowering—or eliminating—provider taxes would likely have the additional benefit of lowering health care prices more broadly. The One Big Beautiful Bill Act (OBBB)—which limits the growth of new provider taxes and reduces the revenue that many states can raise through provider taxes beginning in 2028—will likely result in lower commercial health care prices, all else equal.
Finally, our findings may understate the current impact of provider taxes on the commercial market. Our analysis of California’s 2010 policy predates the rapid growth in state-directed payments in Medicaid, many of which are pegged to average commercial rates. This development has created further incentives for hospitals to increase commercial rates, as doing so carries the added benefit of mechanically increasing Medicaid payments. The OBBB also put limits on the state-directed payment mechanism, which has permitted Medicaid rates to equal average commercial rates in many states. Those limits are aimed at reducing Medicaid spending but will likely have positive spillover effects in the commercial market.