
Reforming Government. Empowering Patients.
Navigation
State of the Affordable Care Act Exchanges Heading into 2027
Rising Premiums, Exploding Subsidies, and Fewer Phantoms

The Paper
Executive Summary
What We Found
The Affordable Care Act (ACA) exchanges have become an increasingly expensive, heavily subsidized insurance market. Premiums have risen much faster than those for employer-sponsored insurance (ESI), deductibles are substantially higher, and provider networks are considerably more restrictive. Federal taxpayers have absorbed nearly all the premium increases for subsidized enrollees. Despite enormous subsidies, the exchanges fell far short of their original enrollment expectations until Congress expanded subsidies during the pandemic. Those expanded subsidies contributed to a surge in improper and phantom enrollment by making coverage free for millions of people.
Why This Matters
The ACA was intended to create a competitive and affordable individual health insurance market. Instead, it has produced a market characterized by high premiums, limited provider access, and overwhelming dependence on taxpayer subsidies. The growing disparity between ACA subsidies and the tax benefits for employer coverage creates incentives for workers to move to exchange coverage and for employers to stop offering insurance, potentially shifting additional costs to federal taxpayers. Moreover, fully subsidized plans have weakened an important safeguard against unauthorized and fictitious enrollment. Rising enrollment figures from 2022 through 2025 included millions of improper and phantom enrollees—many of whom have been removed over the past year.
Key Findings
- The ACA caused individual-market premiums to soar. Premiums increased sharply when the ACA’s major insurance regulations took effect in 2014 and have continued rising much faster than employer coverage premiums. From 2014 to 2026, benchmark premiums for a 50-year-old increased 129 percent, compared with 63 percent for ESI premiums and 39 percent for overall inflation.
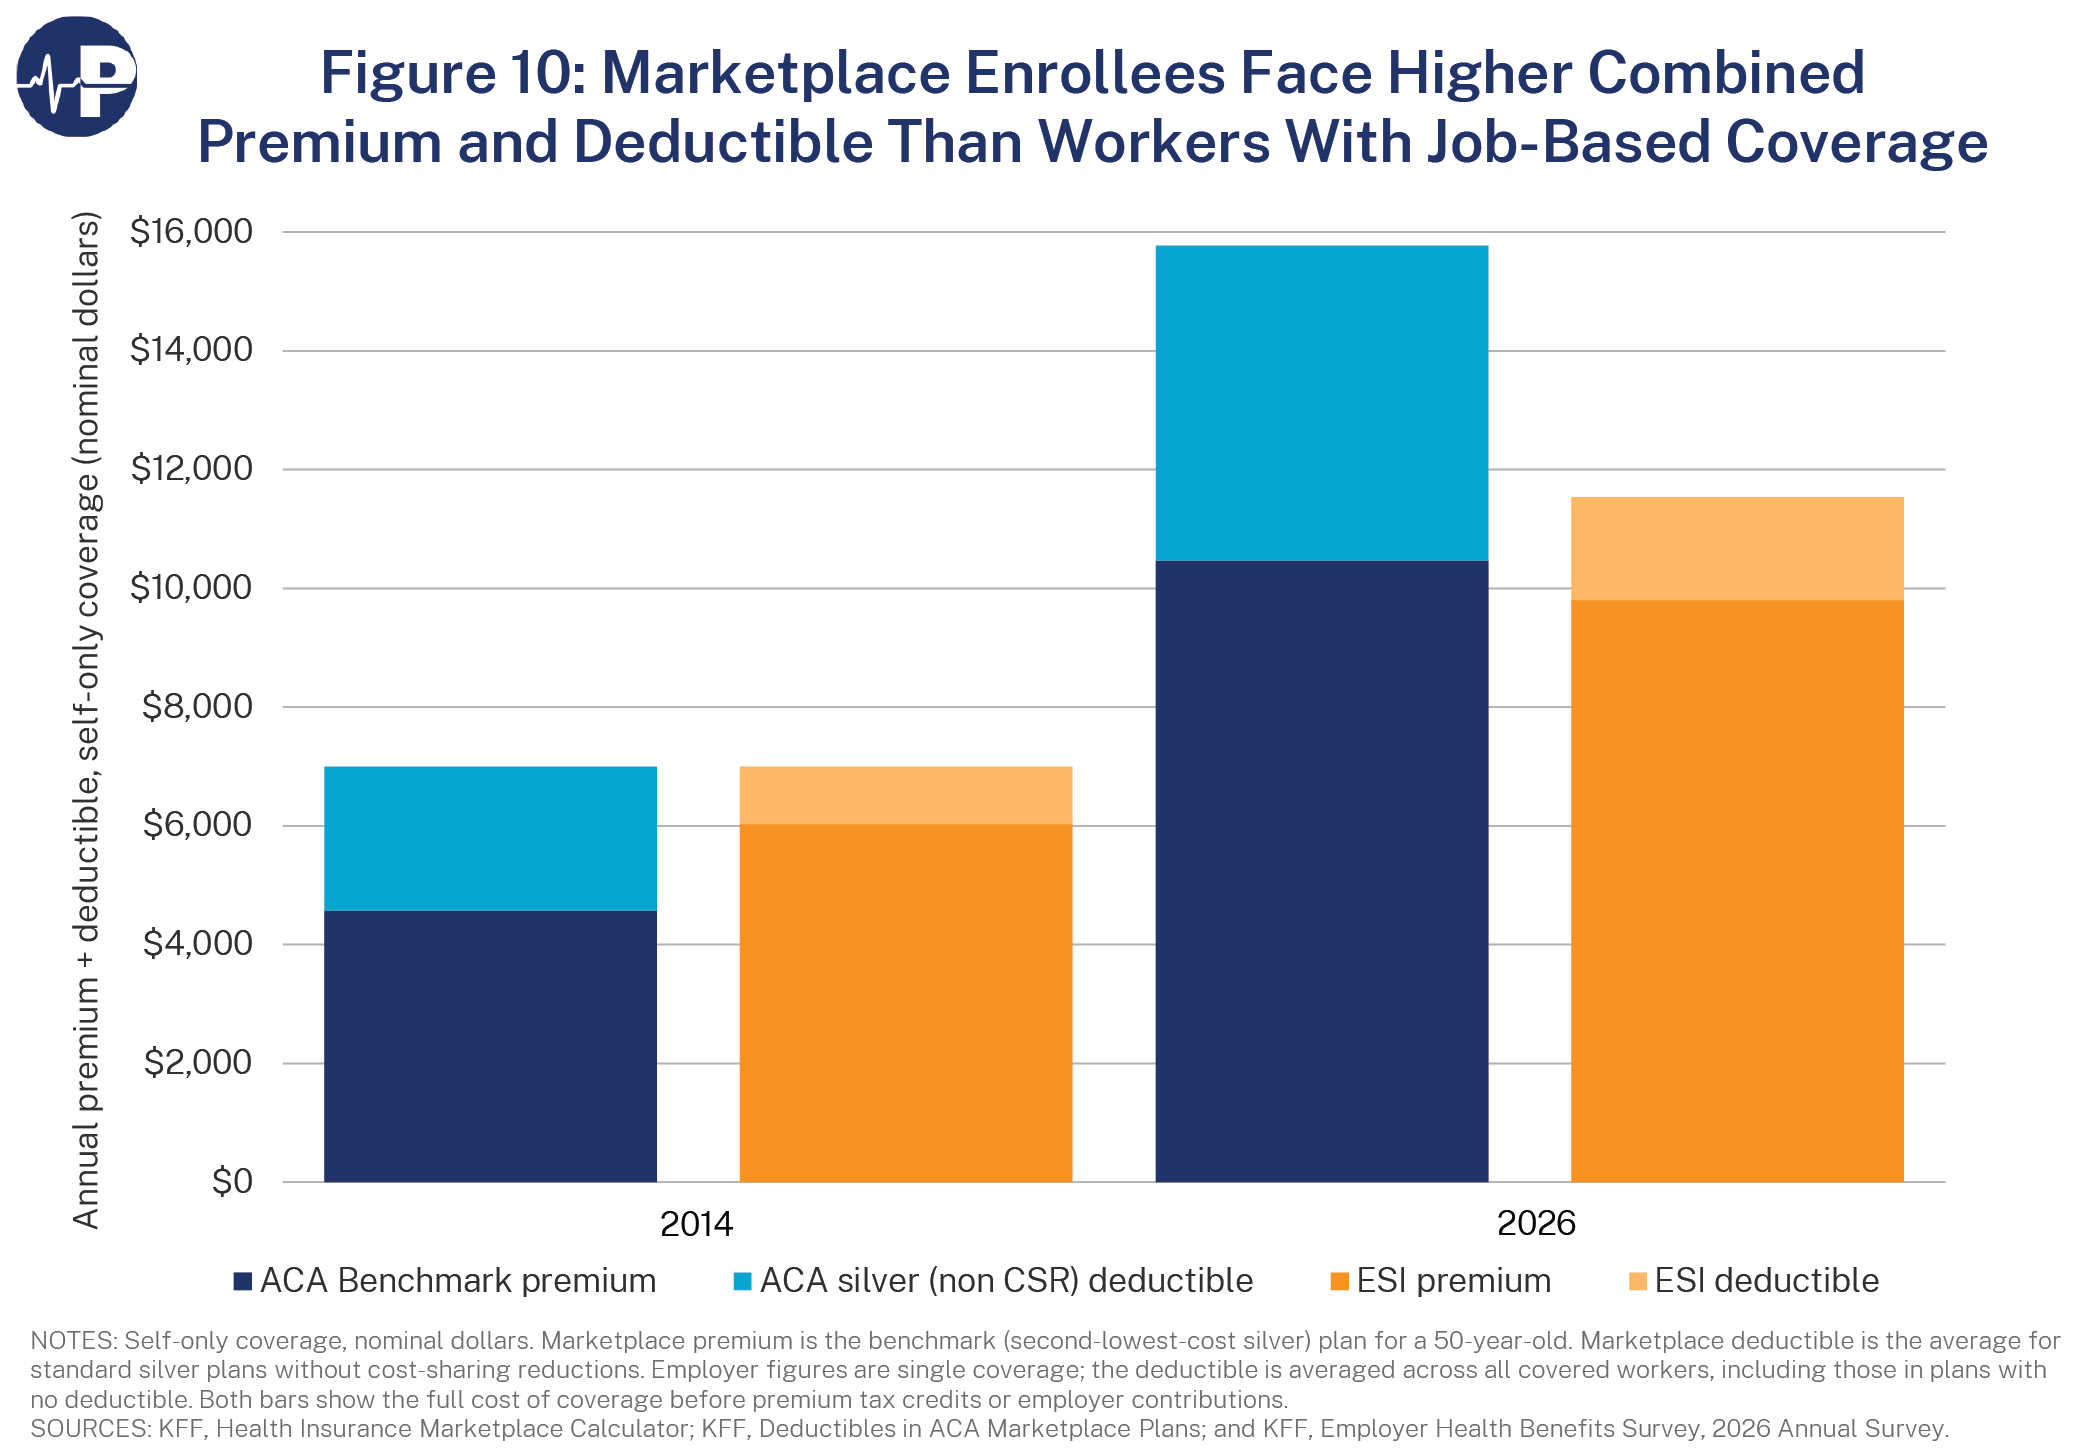
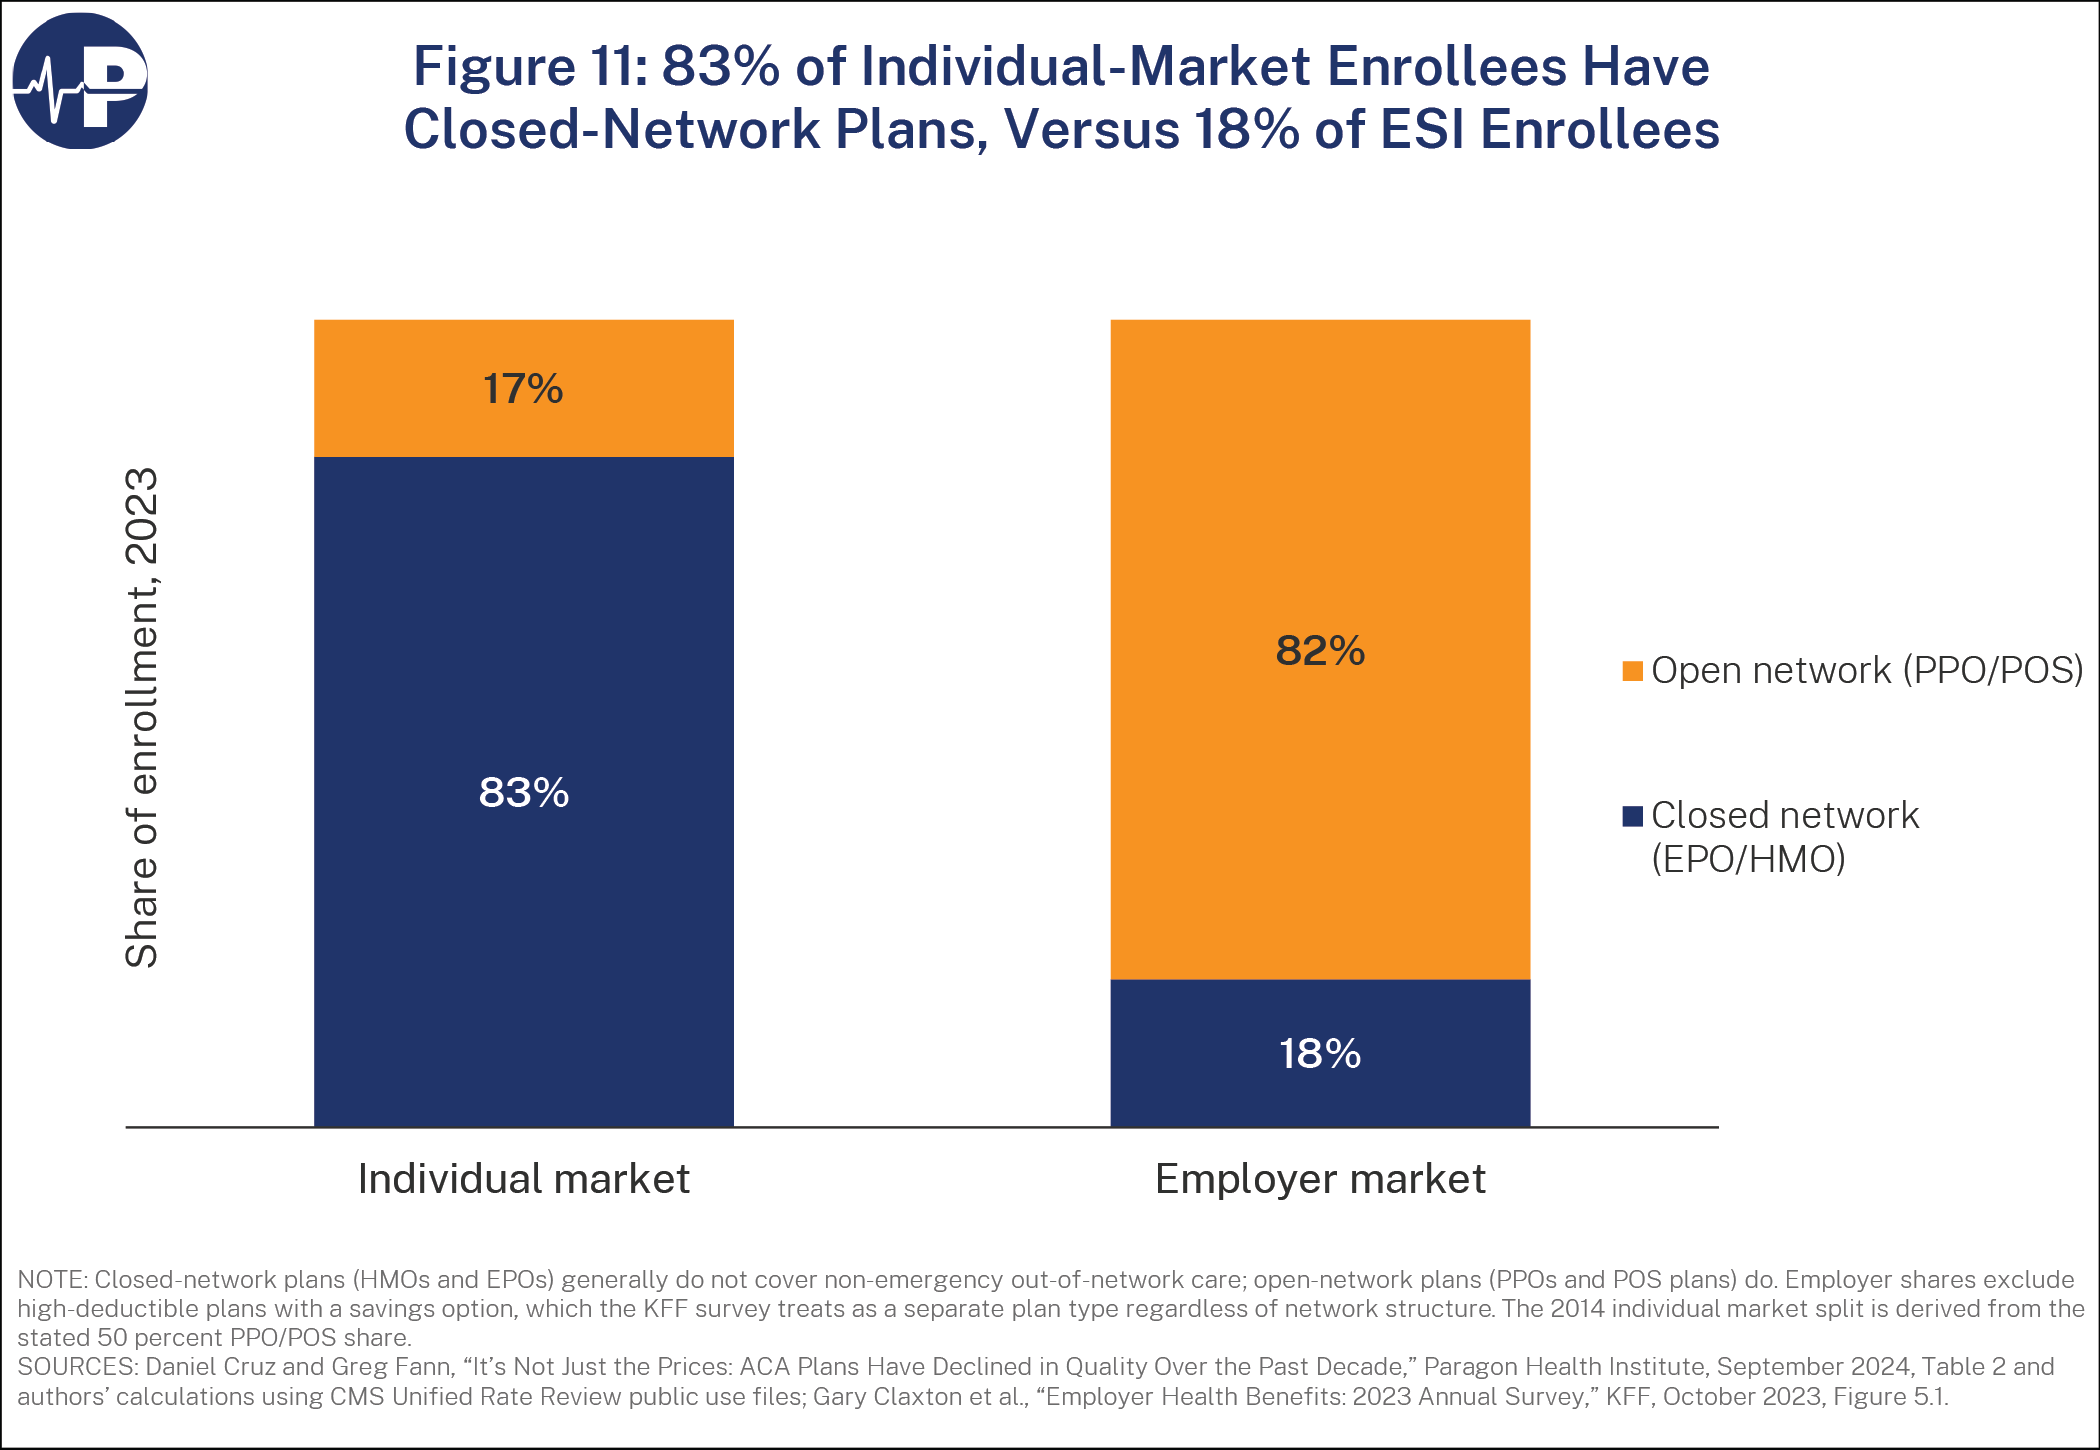
- ACA coverage provides less financial protection and more limited provider access than typical employer coverage. The combined premium and deductible for an ACA benchmark silver plan was approximately equal to that for ESI in 2014 but substantially higher by 2026. In 2023, 83 percent of individual-market enrollees had closed-network plans, compared with 18 percent of ESI enrollees.
- Taxpayers bear nearly all the increase in subsidized premiums. For a 50-year-old at 200 percent of the federal poverty level, taxpayers will finance approximately $10,000 of a $12,000 benchmark premium in 2027, absorbing more than 90 percent of the premium increase since 2014.
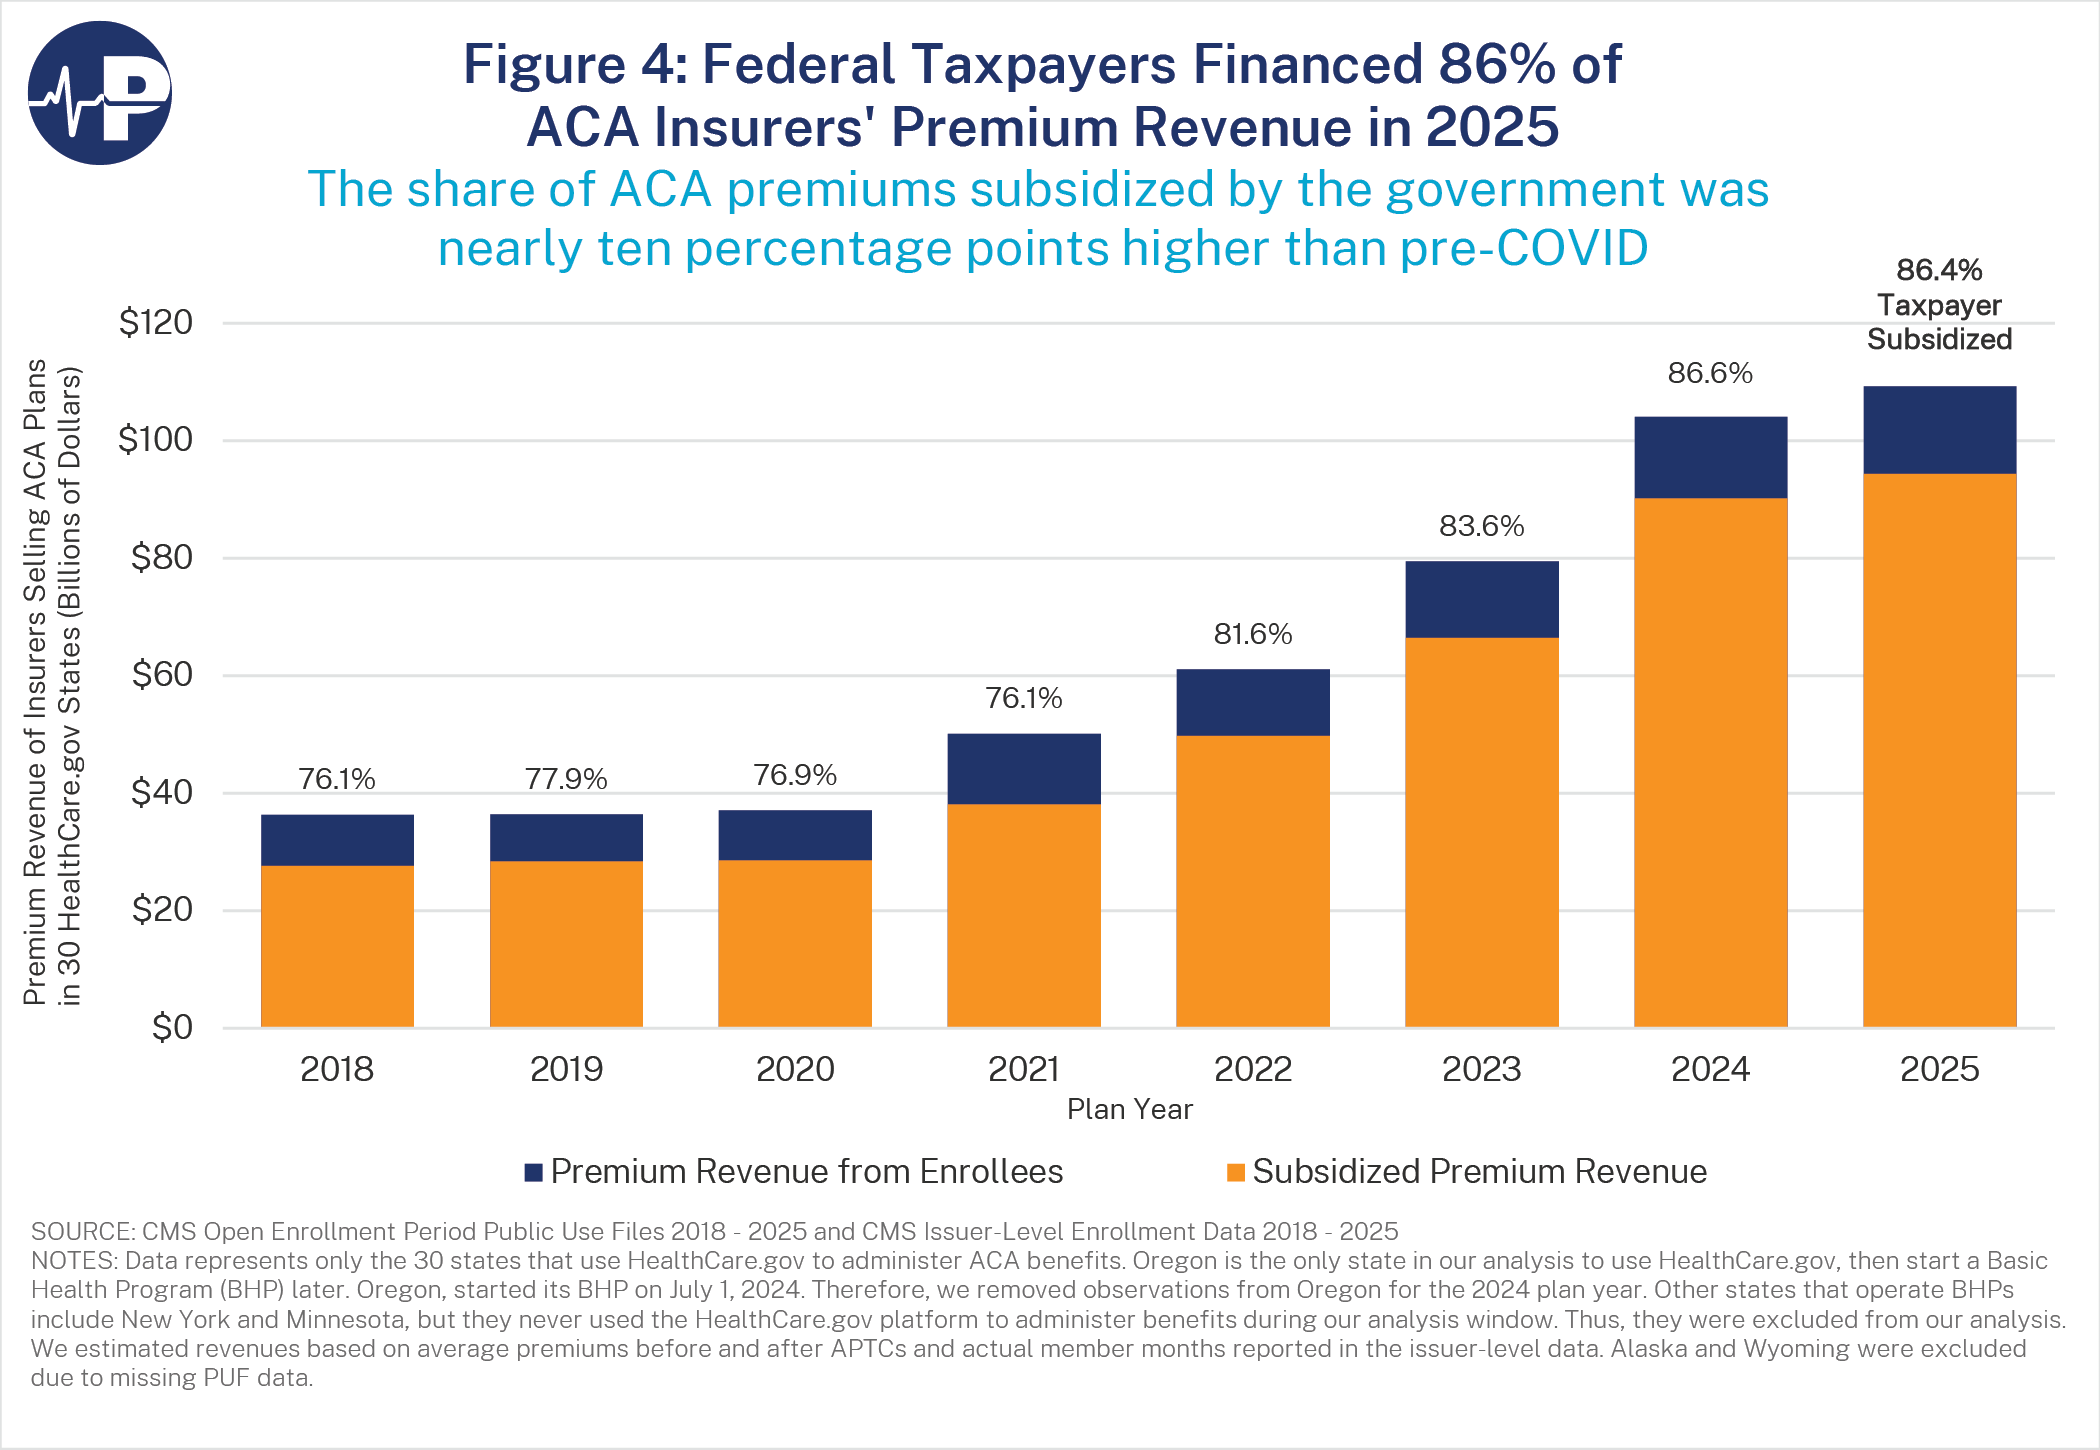
- The exchanges are overwhelmingly taxpayer-financed. Federal subsidies accounted for approximately 77 percent of premium revenue in HealthCare.gov states before the pandemic, increasing to 86 percent in 2025.
- ACA subsidies increasingly favor exchange coverage over employer coverage. For many lower- and middle-income households, the ACA subsidy is substantially greater than the tax benefit for ESI, creating incentives to shift coverage away from employers.
- Exchange enrollment surged only after Congress expanded subsidies. Enrollment was less than half of CBO’s original projection in 2016 and remained far below expectations for years. Enrollment increased substantially after the COVID-era subsidy expansions, which made coverage fully subsidized for millions and contributed to widespread improper and phantom enrollment.
- Evidence of improper and phantom enrollment is substantial. In 2026, 56 percent of HealthCare.gov plan selections reported incomes between 100 and 150 percent of the federal poverty level. In 13 states, enrollment in this category was more than twice the estimated eligible population, exceeding three times that population in several states. After both the 2025 and 2026 open enrollment periods, there were more than 6 million improperly enrolled individuals. The share of individual-market enrollees without medical claims increased from 19 percent in 2021 to 35 percent in 2024—while the rate of zero-claim enrollment in the unsubsidized small group market remained at roughly 20 percent. The Trump administration has taken action to remove phantom enrollees, and states with higher zero-claim rates have generally experienced larger subsequent enrollment declines.
Introduction
Two years ago, Paragon released The Falsehoods of Obamacare, which documented how the Affordable Care Act (ACA) increased health care costs and federal deficits, caused people to lose their plans and doctors, and failed to improve health outcomes.1 One of the ACA’s central promises was that it would create a competitive, robust individual health insurance market. The reality has been quite different. ACA plans generally have high premiums, large deductibles, and narrow provider networks, and the market depends on far more federal subsidies than originally anticipated. The structure of the ACA encourages higher premiums.
As the 2027 open enrollment period approaches, this paper uses a series of figures to illustrate the current state of the ACA exchanges and the developments that brought the market to this point. The figures tell a troubling story: premiums have continued to rise quickly; taxpayers bear an ever-growing share of the cost; and expanded subsidies have contributed to widespread improper and phantom enrollment. Recent enrollment changes also provide evidence of how much the market has been distorted by zero-premium coverage.
Exchange Enrollment Fell Far Short of Expectations Until Subsidies Expanded
The ACA exchanges attracted far fewer enrollees than originally expected. In 2013, the Congressional Budget Office (CBO) projected that average exchange enrollment would reach 22 million in 2016 and approximately 24 million by 2023. As Figure 1 shows, actual enrollment was just 10 million in 2016 and remained near that level until Congress expanded the premium subsidies during the COVID pandemic.
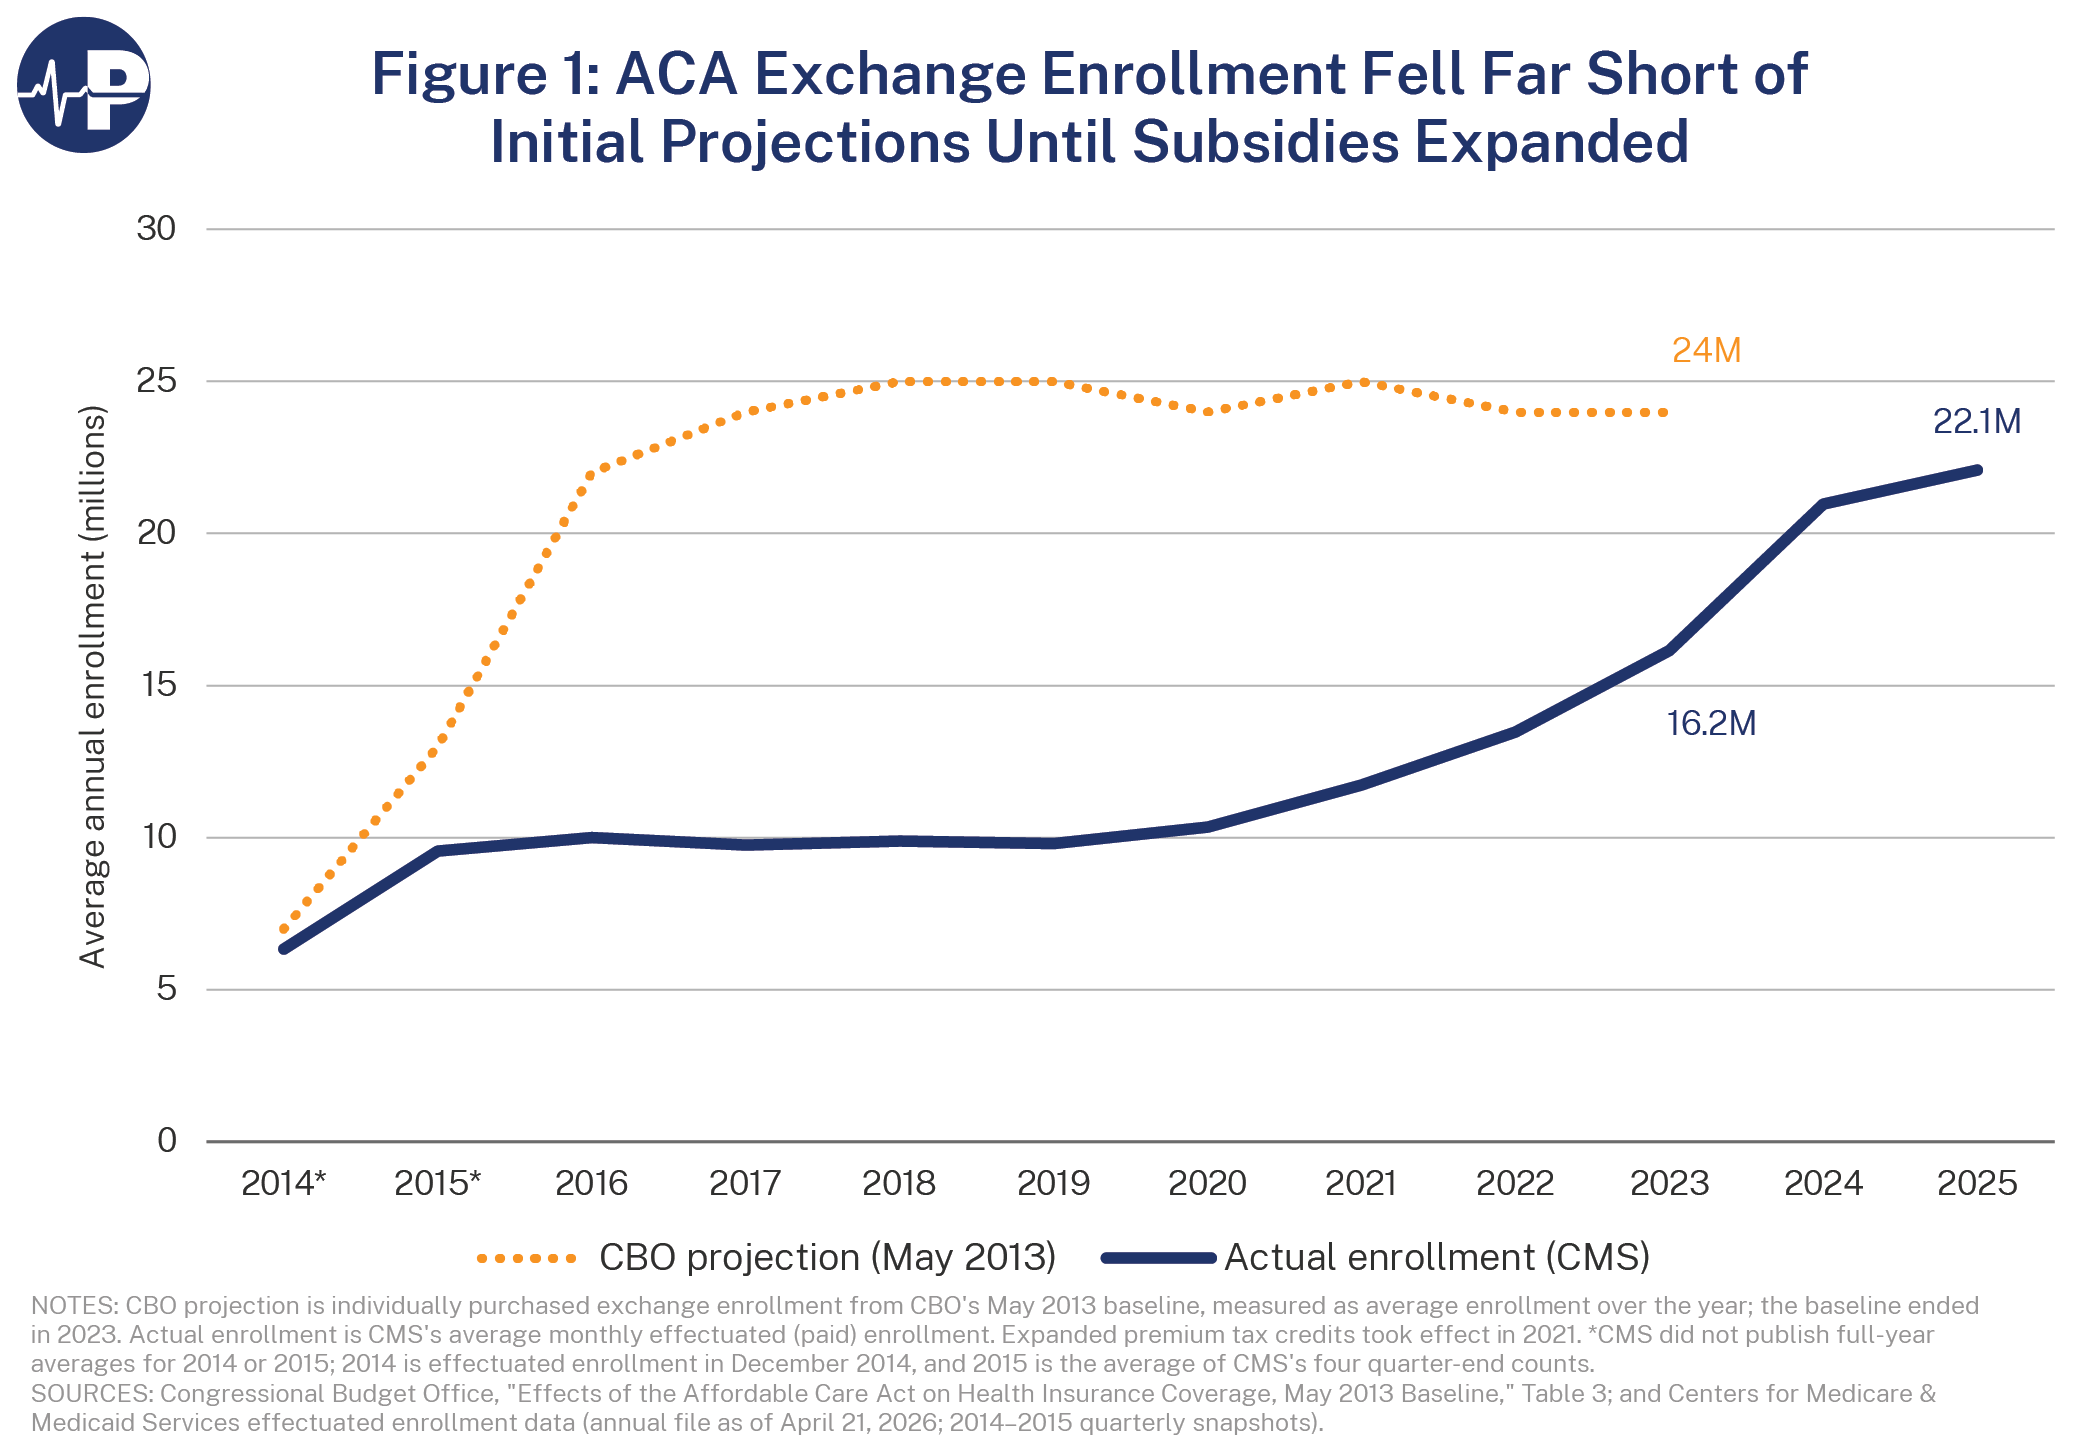
The exchanges proved far less attractive to consumers than anticipated, with high premiums, large deductibles, and restrictive provider networks. Enrollment increased substantially only after Congress expanded premium subsidies during the pandemic, making coverage free for millions of people. As discussed later in this paper, much of the subsequent enrollment growth coincided with widespread improper and phantom enrollment.
Rising Premiums, Rising Taxpayer Subsidies
Figure 2 compares benchmark premiums in 2014 and 2027 by state, sorted by the size of the 2027 premium. The benchmark plan is the second-lowest-cost silver plan available on the exchange, and its premium largely determines federal subsidies. Nationally, the benchmark premium has increased by 163 percent from 2014 to 2027. Premium growth has varied widely across the country, ranging from 64 percent in New Hampshire to 352 percent in West Virginia. Geographic disparities have also widened: the standard deviation of state benchmark premiums increased from $55 in 2014 to a projected $190 in 2027, while the coefficient of variation rose from 19.9 percent to 25.7 percent.2
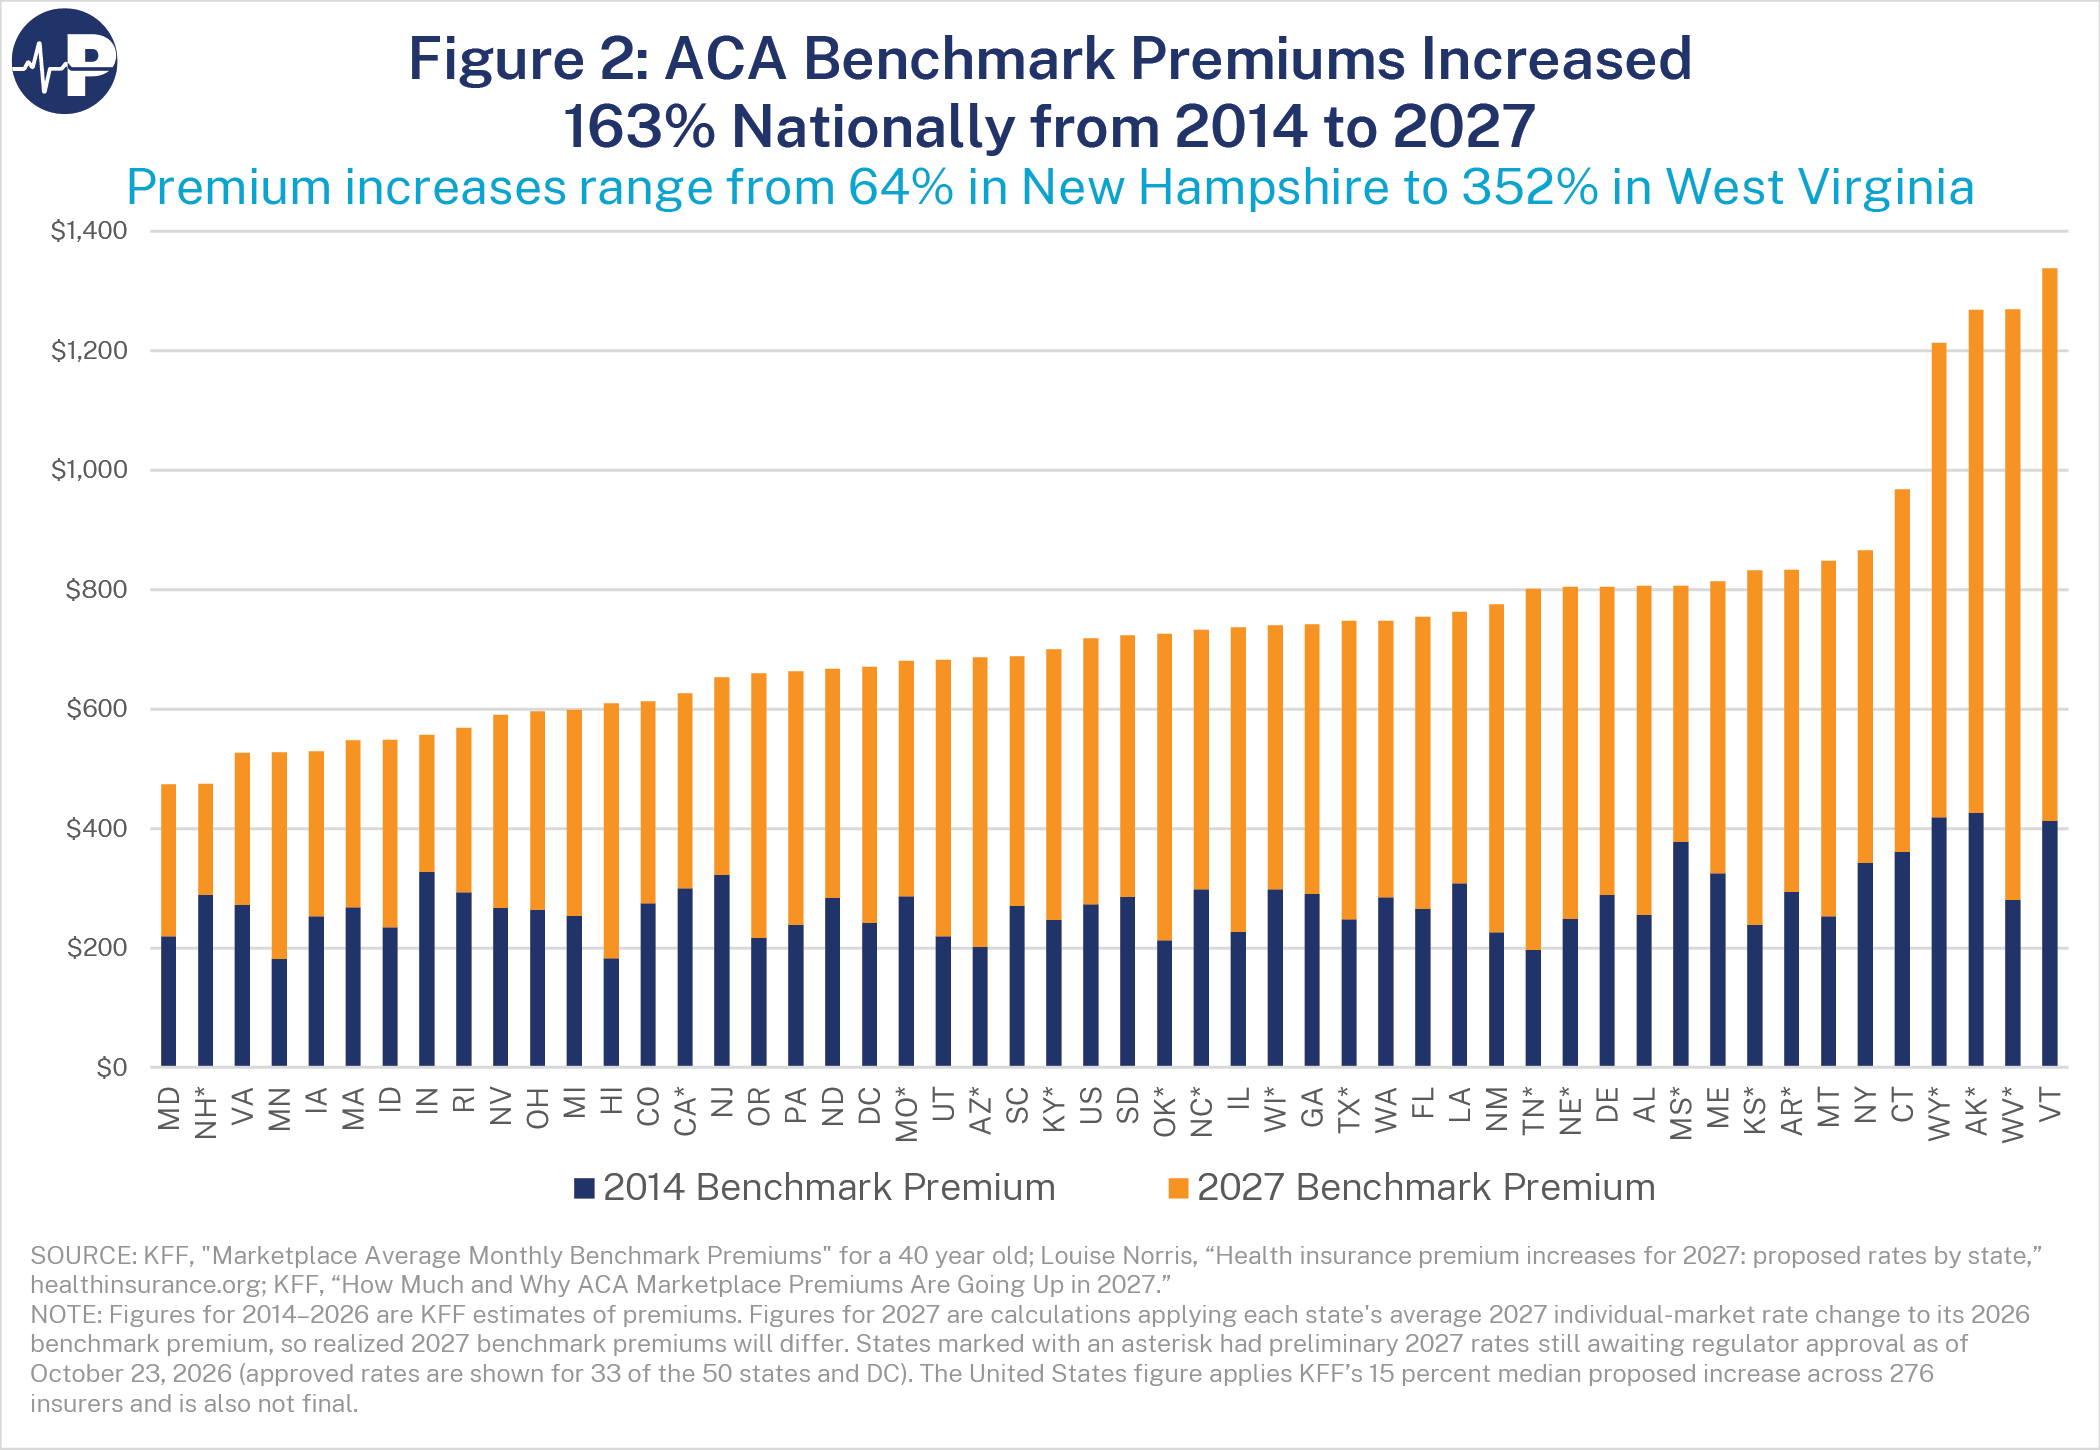
Since benchmark premiums vary so dramatically across the country, so do subsidies. The contrast between neighboring states New Hampshire and Vermont makes this clear. Federal taxpayers are bearing a much greater cost for exchange enrollees in Vermont—largely because Vermont does not permit insurers to charge younger enrollees lower premiums than older enrollees, which significantly raises overall premiums.
Of the people who selected a plan during the 2026 open enrollment period, 87 percent were subsidized through premium tax credits.3 Figure 3 shows an essential feature of the ACA—the subsidy caps the amount of money that enrollees have to pay for their coverage. The subsidies are structured so that the benchmark premium cannot exceed a certain amount of household income, with higher subsidies for lower-income enrollees.
Figure 3 shows the enrollee and taxpayer share of the benchmark premium for a 50-year-old enrollee at 200 percent of the federal poverty level (FPL)—about the average age and income for a single ACA plan enrollee. The enrollee’s share (the orange bar) has barely changed because taxpayers have absorbed more than 90 percent of the premium increase since 2014. In 2027, this enrollee will receive about a $10,000 subsidy for a $12,000 plan. The enrollee’s share of the premium has fallen from 31.6 percent to 17.5 percent while the taxpayer share of the premium has risen from 68.4 percent to 82.5 percent in 13 years.
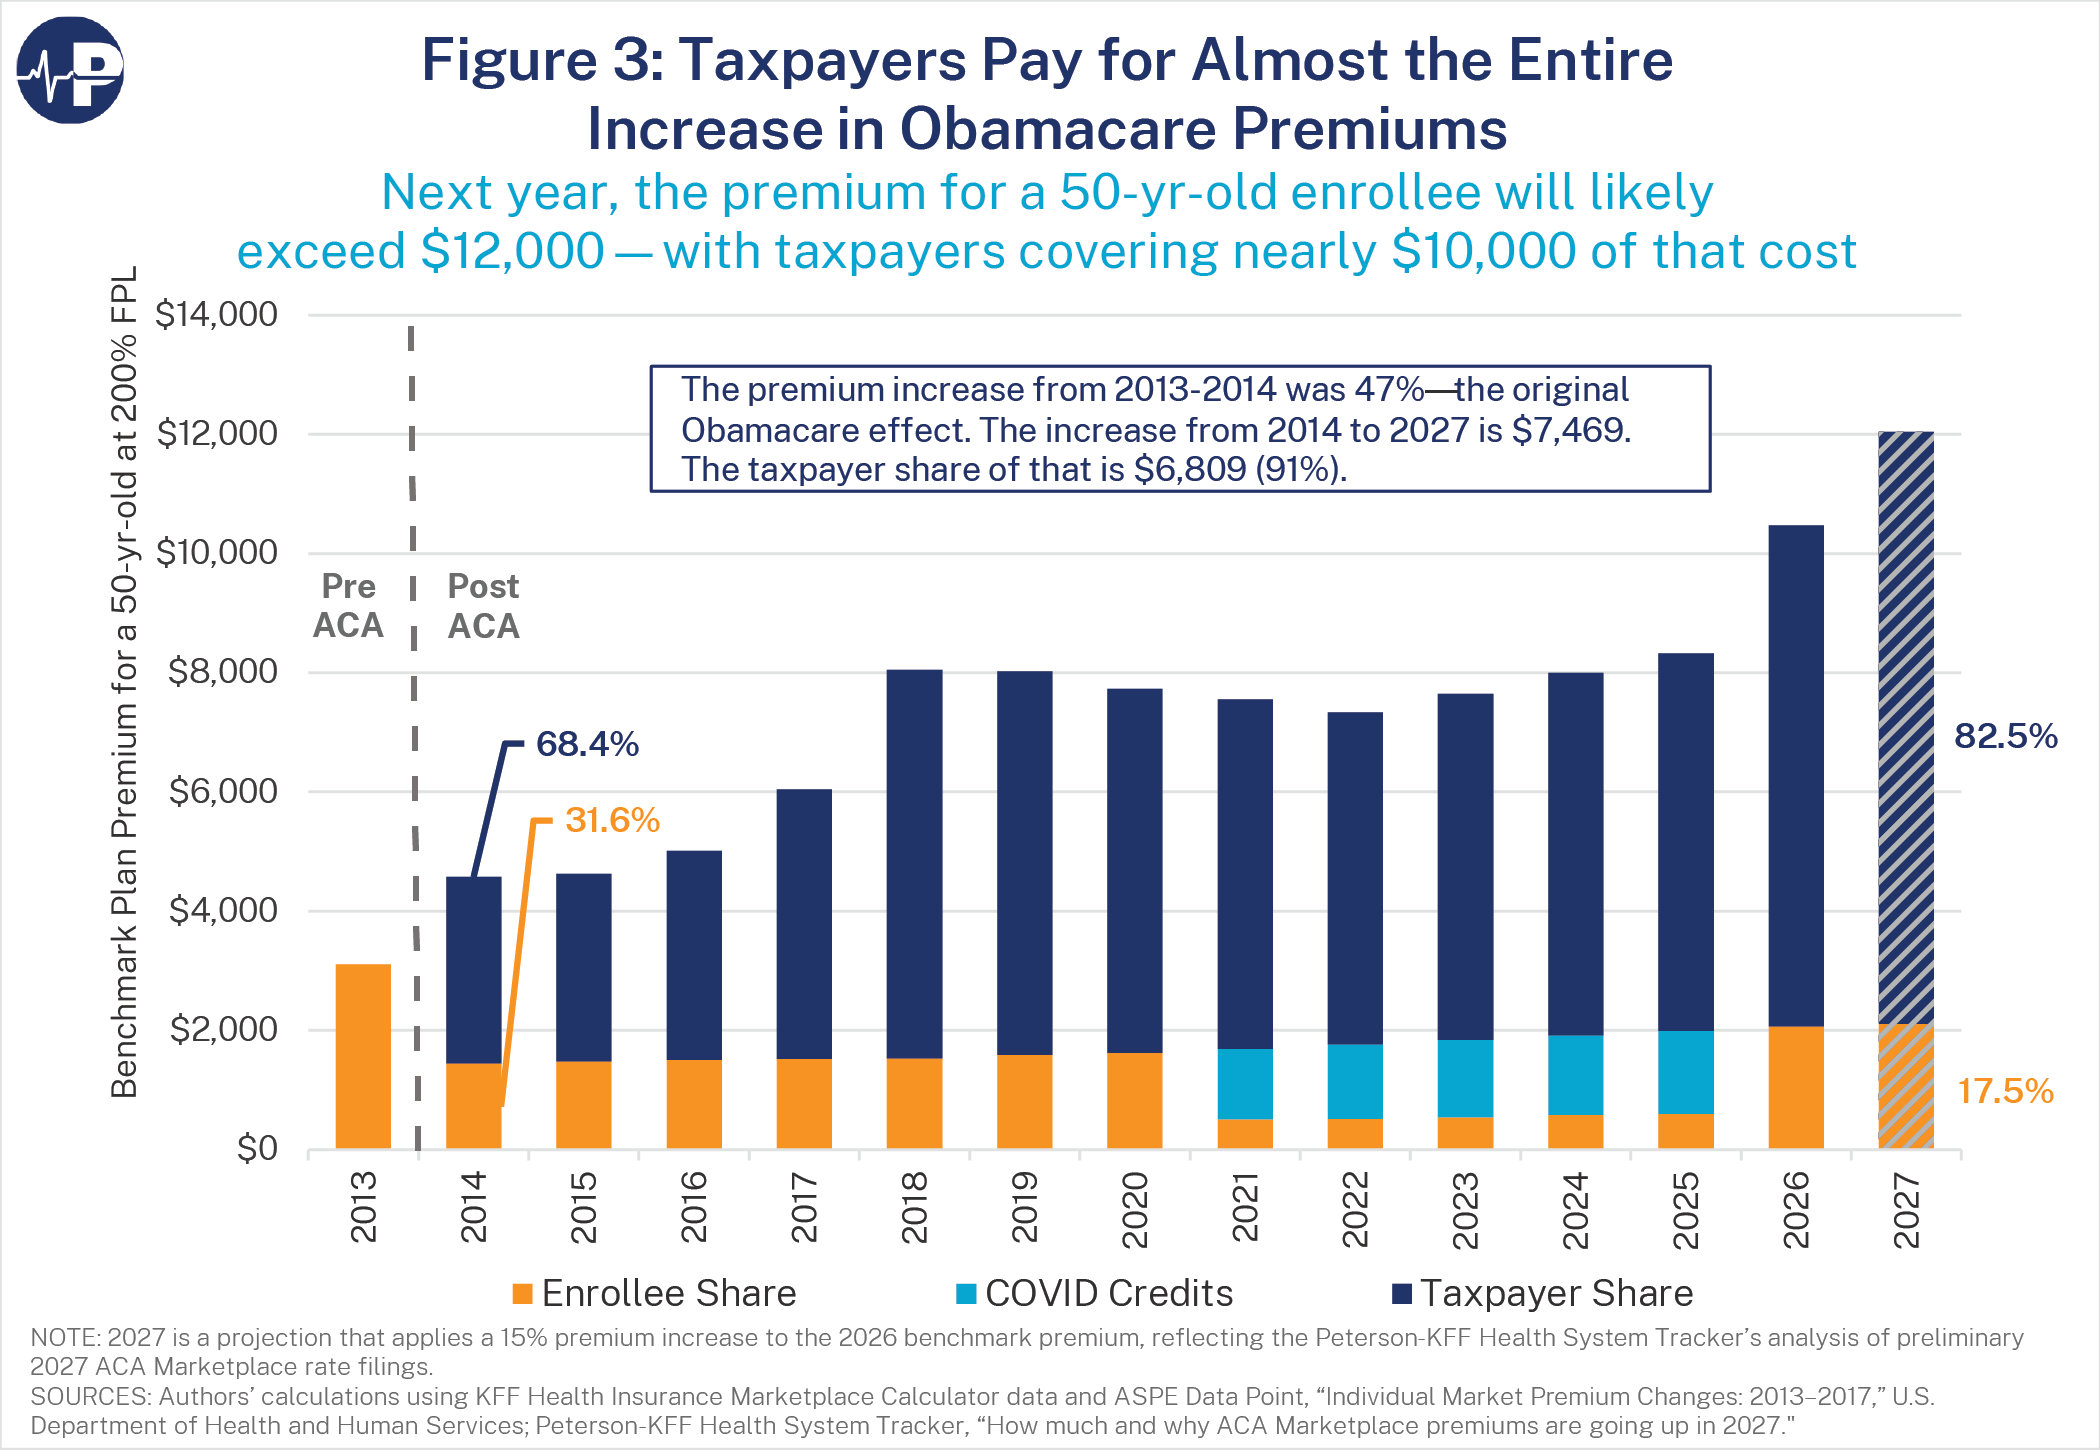
Figure 4 shows the growing share of ACA insurers’ premium revenue financed by federal taxpayers in states using HealthCare.gov. Before the pandemic, taxpayers already financed approximately 77 percent of premium revenue. By 2025, that share had increased to more than 86 percent. The analysis focuses on HealthCare.gov states because CMS does not publish comparable premium data for states operating their own exchanges.
In 2021, as a pandemic relief measure, Congress increased the subsidies and extended them to people in households with income above 400 percent of the FPL. Congress set those enhanced subsidies to expire after 2025. The enhanced subsidies are displayed in Figure 3 as the light blue bar and represent a shift in the financial burden from the enrollee to the federal taxpayer.
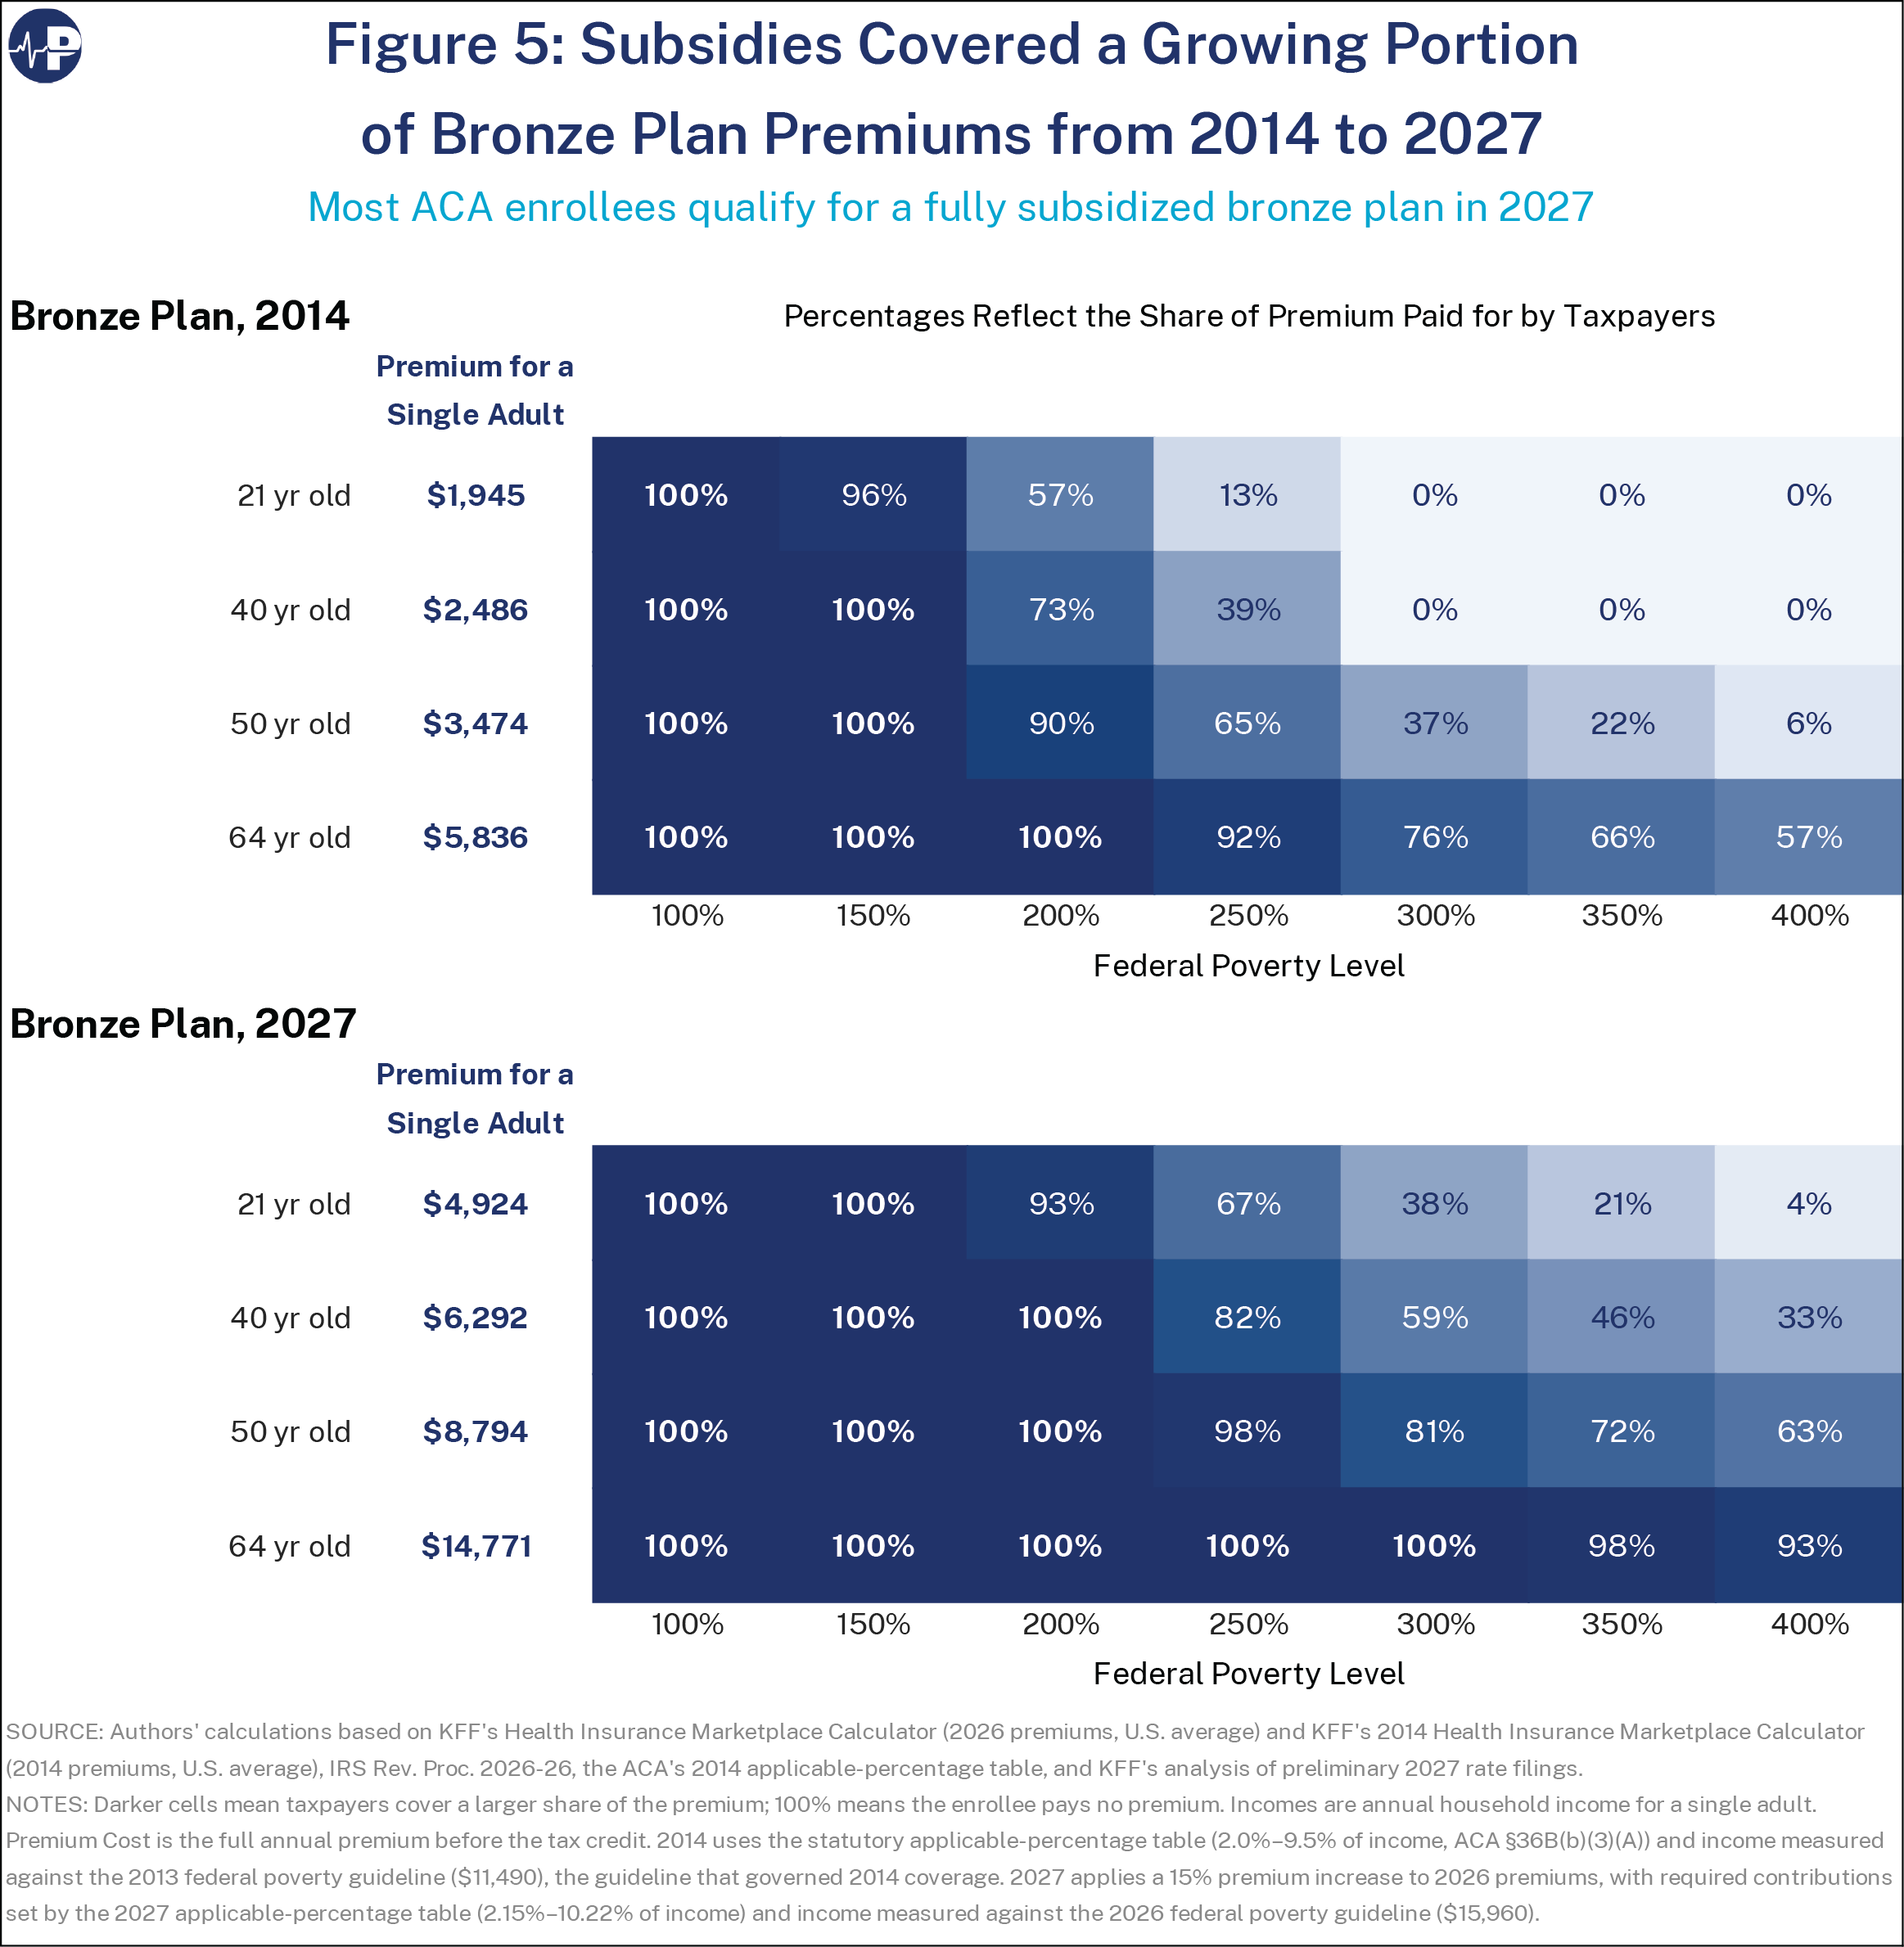
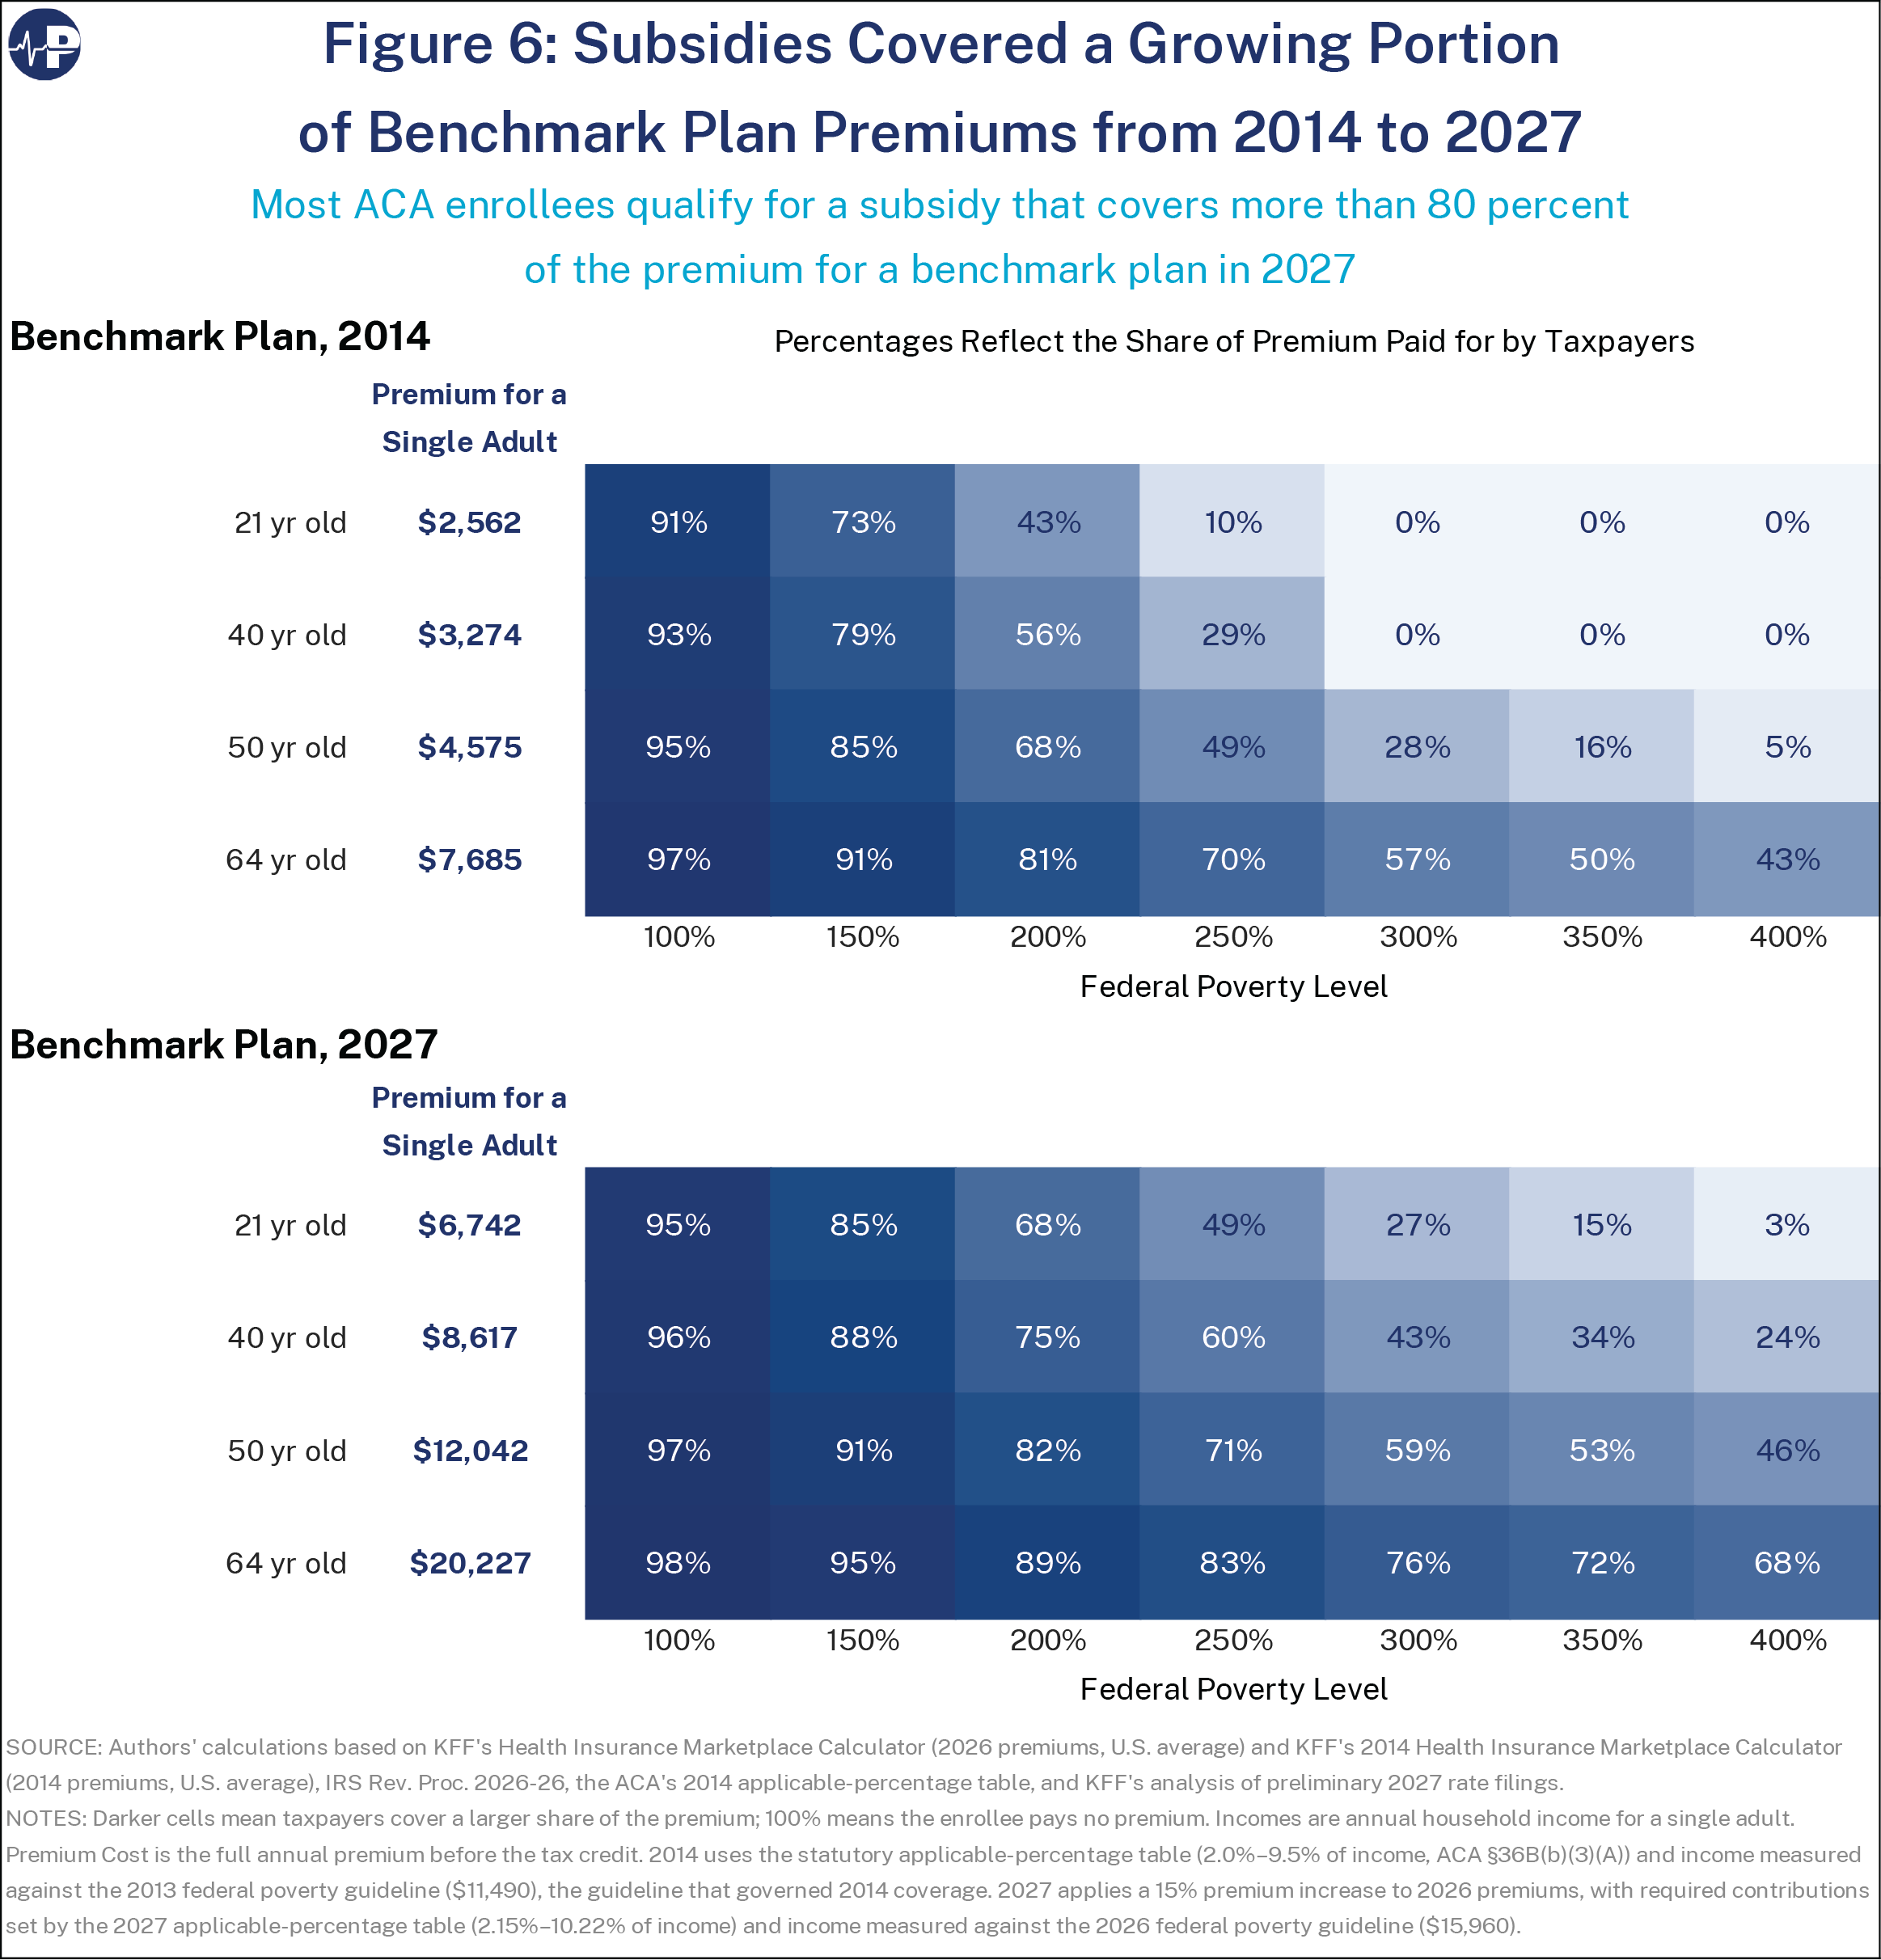
The ACA organizes health insurance marketplace plans into four metal categories based on actuarial value (AV)—bronze (60 percent AV), silver (70 percent AV), gold (80 percent AV), and platinum (90 percent AV). AV is the average percentage of covered medical costs paid by the plan. Higher AV plans generally have lower deductibles and cost-sharing requirements. Lower-income enrollees who choose silver plans qualify for an additional benefit that raises the actuarial value of the plan by lowering plan deductibles and copayments. Figures 5 and 6 show how much more heavily subsidized the market is in 2027 than it was in 2014. Figure 5 shows the percentage of the national average bronze plan premium covered by the subsidy for single enrollees of four ages at various income levels. Figure 6 shows the percentage of the national average benchmark silver plan premium covered by the subsidy. Nearly half of exchange enrollees report incomes below 150 percent of FPL, and more than two-thirds report incomes below 200 percent of FPL. As the figures illustrate, these enrollees generally qualify for fully subsidized bronze plans and subsidies covering most of the cost of benchmark silver plans.
ACA Subsidies Increasingly Favor Exchange Coverage Over ESI
The ACA also provides much larger federal subsidies to many low- and middle-income people who obtain coverage through the exchanges than the tax benefits available to those with employer-sponsored insurance (ESI). Employer-paid health insurance premiums are generally excluded from federal income and payroll taxes.
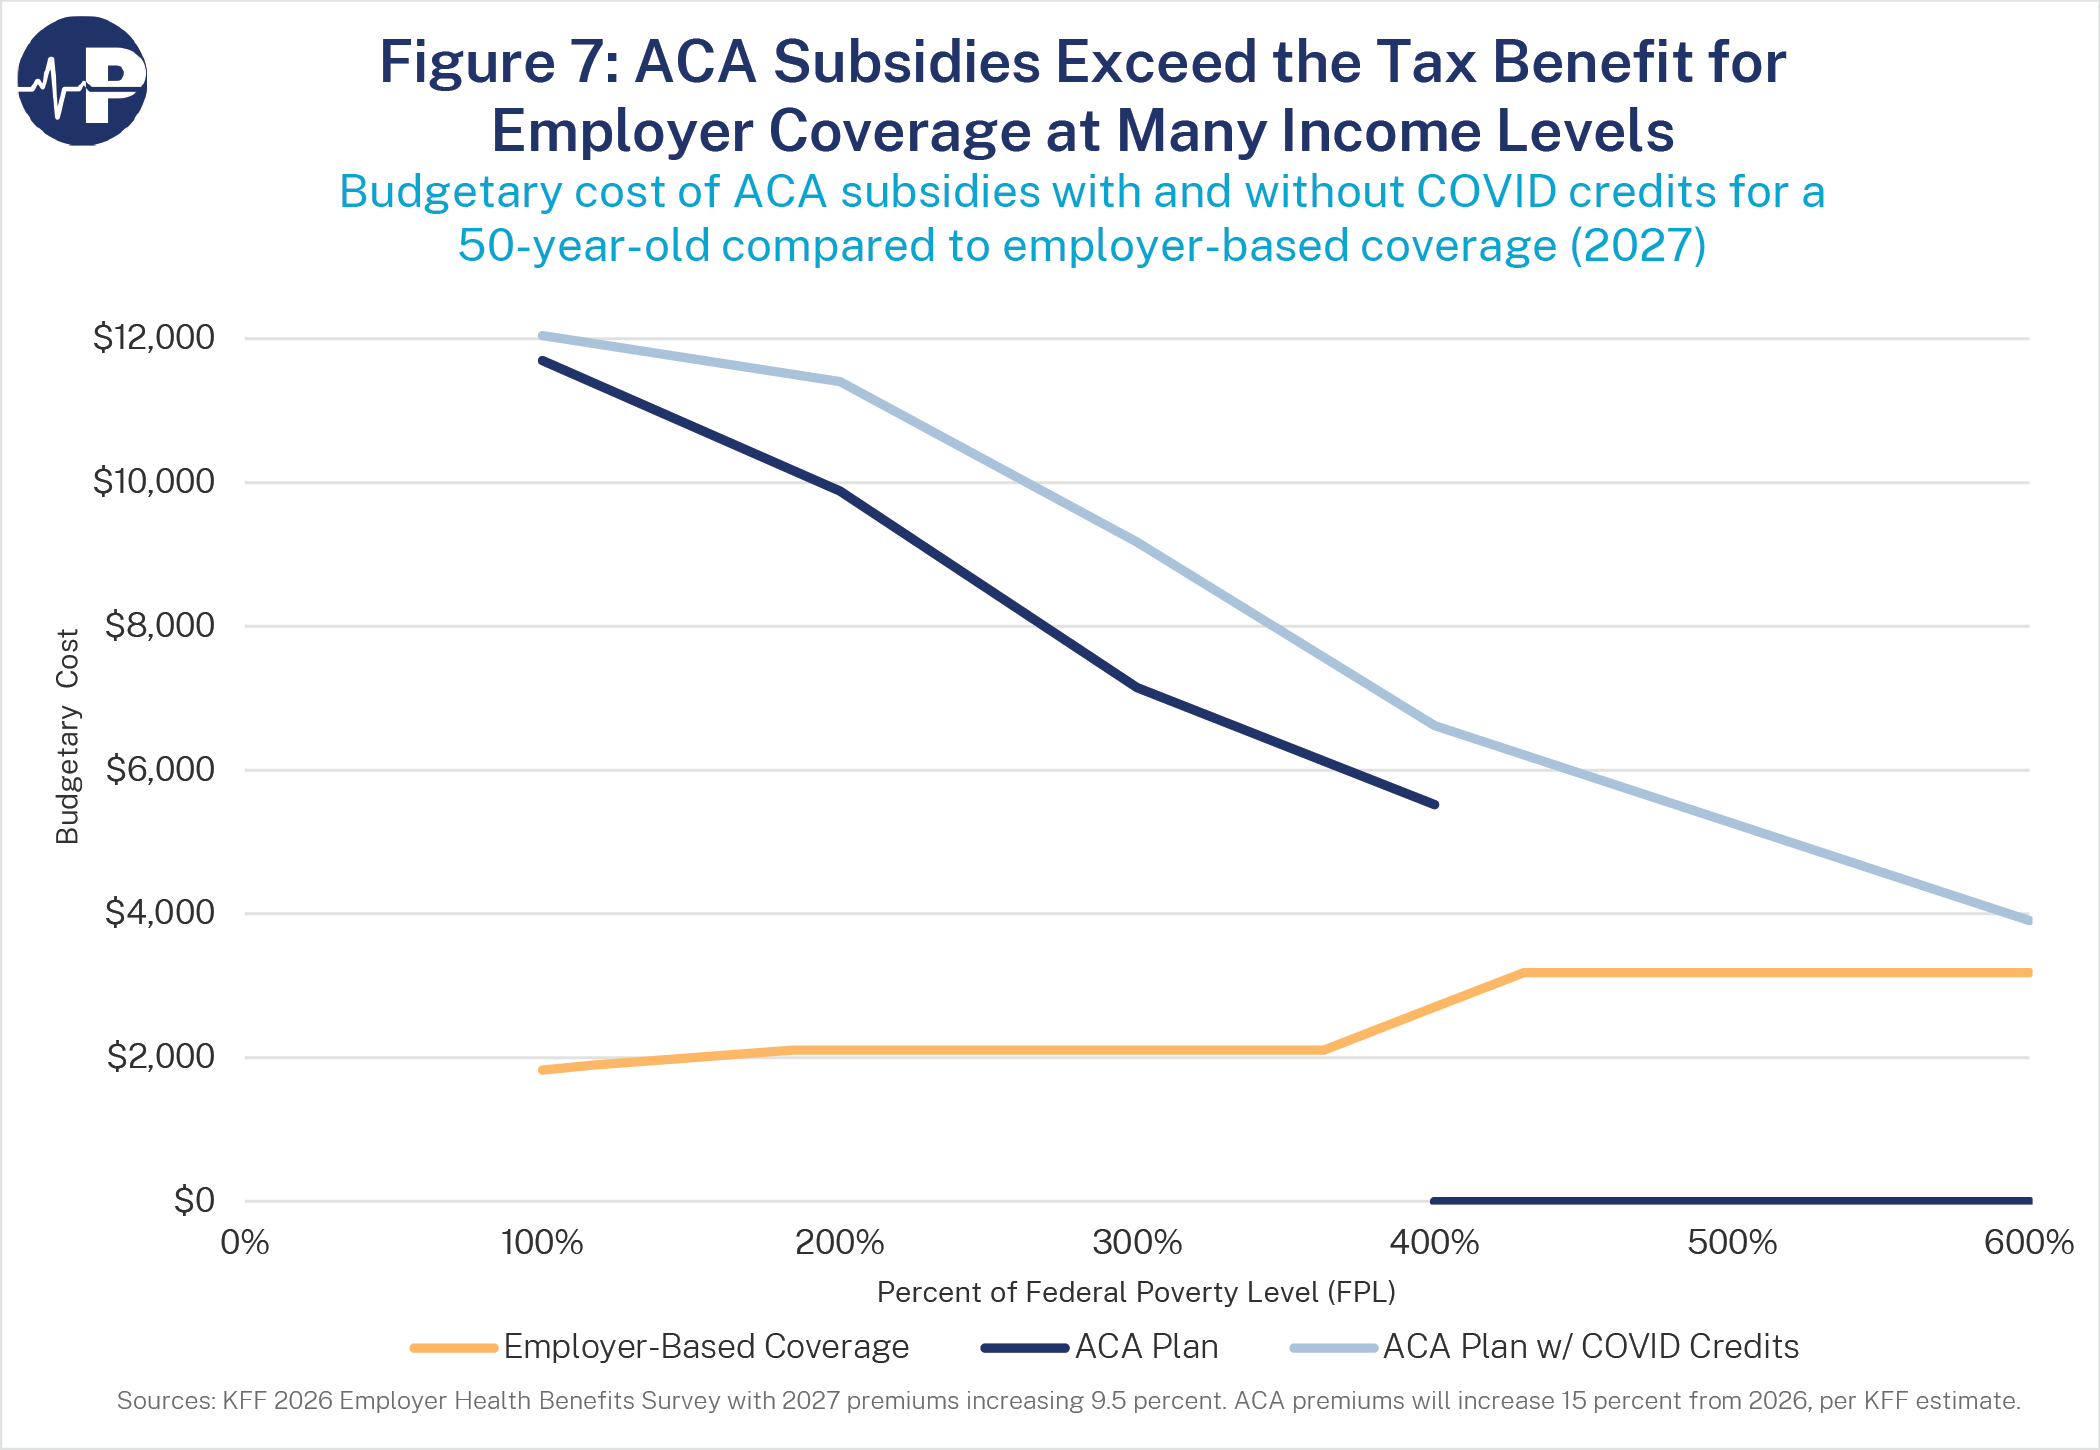
Figure 7 updates a figure from a November 2025 Paragon policy brief by Brian Blase and John R. Graham, comparing the value of the tax exclusion for employer coverage with ACA premium tax credits at different income levels in 2027.4 For example, a 50-year-old earning $47,880 would receive a federal tax benefit of approximately $2,109 for employer coverage that year, compared with an ACA premium tax credit of $7,151 under the original subsidy structure. If the COVID-19 enhanced subsidies were restored, the ACA benefit would be $9,171. This disparity creates a powerful incentive for lower- and middle-income workers to seek jobs that do not offer employer coverage and that come with higher wages as a compensating differential. It also creates incentives for employers to discontinue coverage, shifting more workers into federally subsidized plans and increasing federal spending.
ACA premiums have increased more than twice as fast as ESI premiums since 2014. As Figure 8 shows, benchmark premiums for a 50-year-old ACA enrollee increased 129 percent from 2014 to 2026, compared with 63 percent for average ESI premiums and 39 percent for overall inflation. These figures measure the full premium, including the amounts paid by taxpayers and enrollees. The much faster growth in ACA premiums suggests that the law’s regulatory and subsidy structures have contributed to higher premium growth than in the employer market.
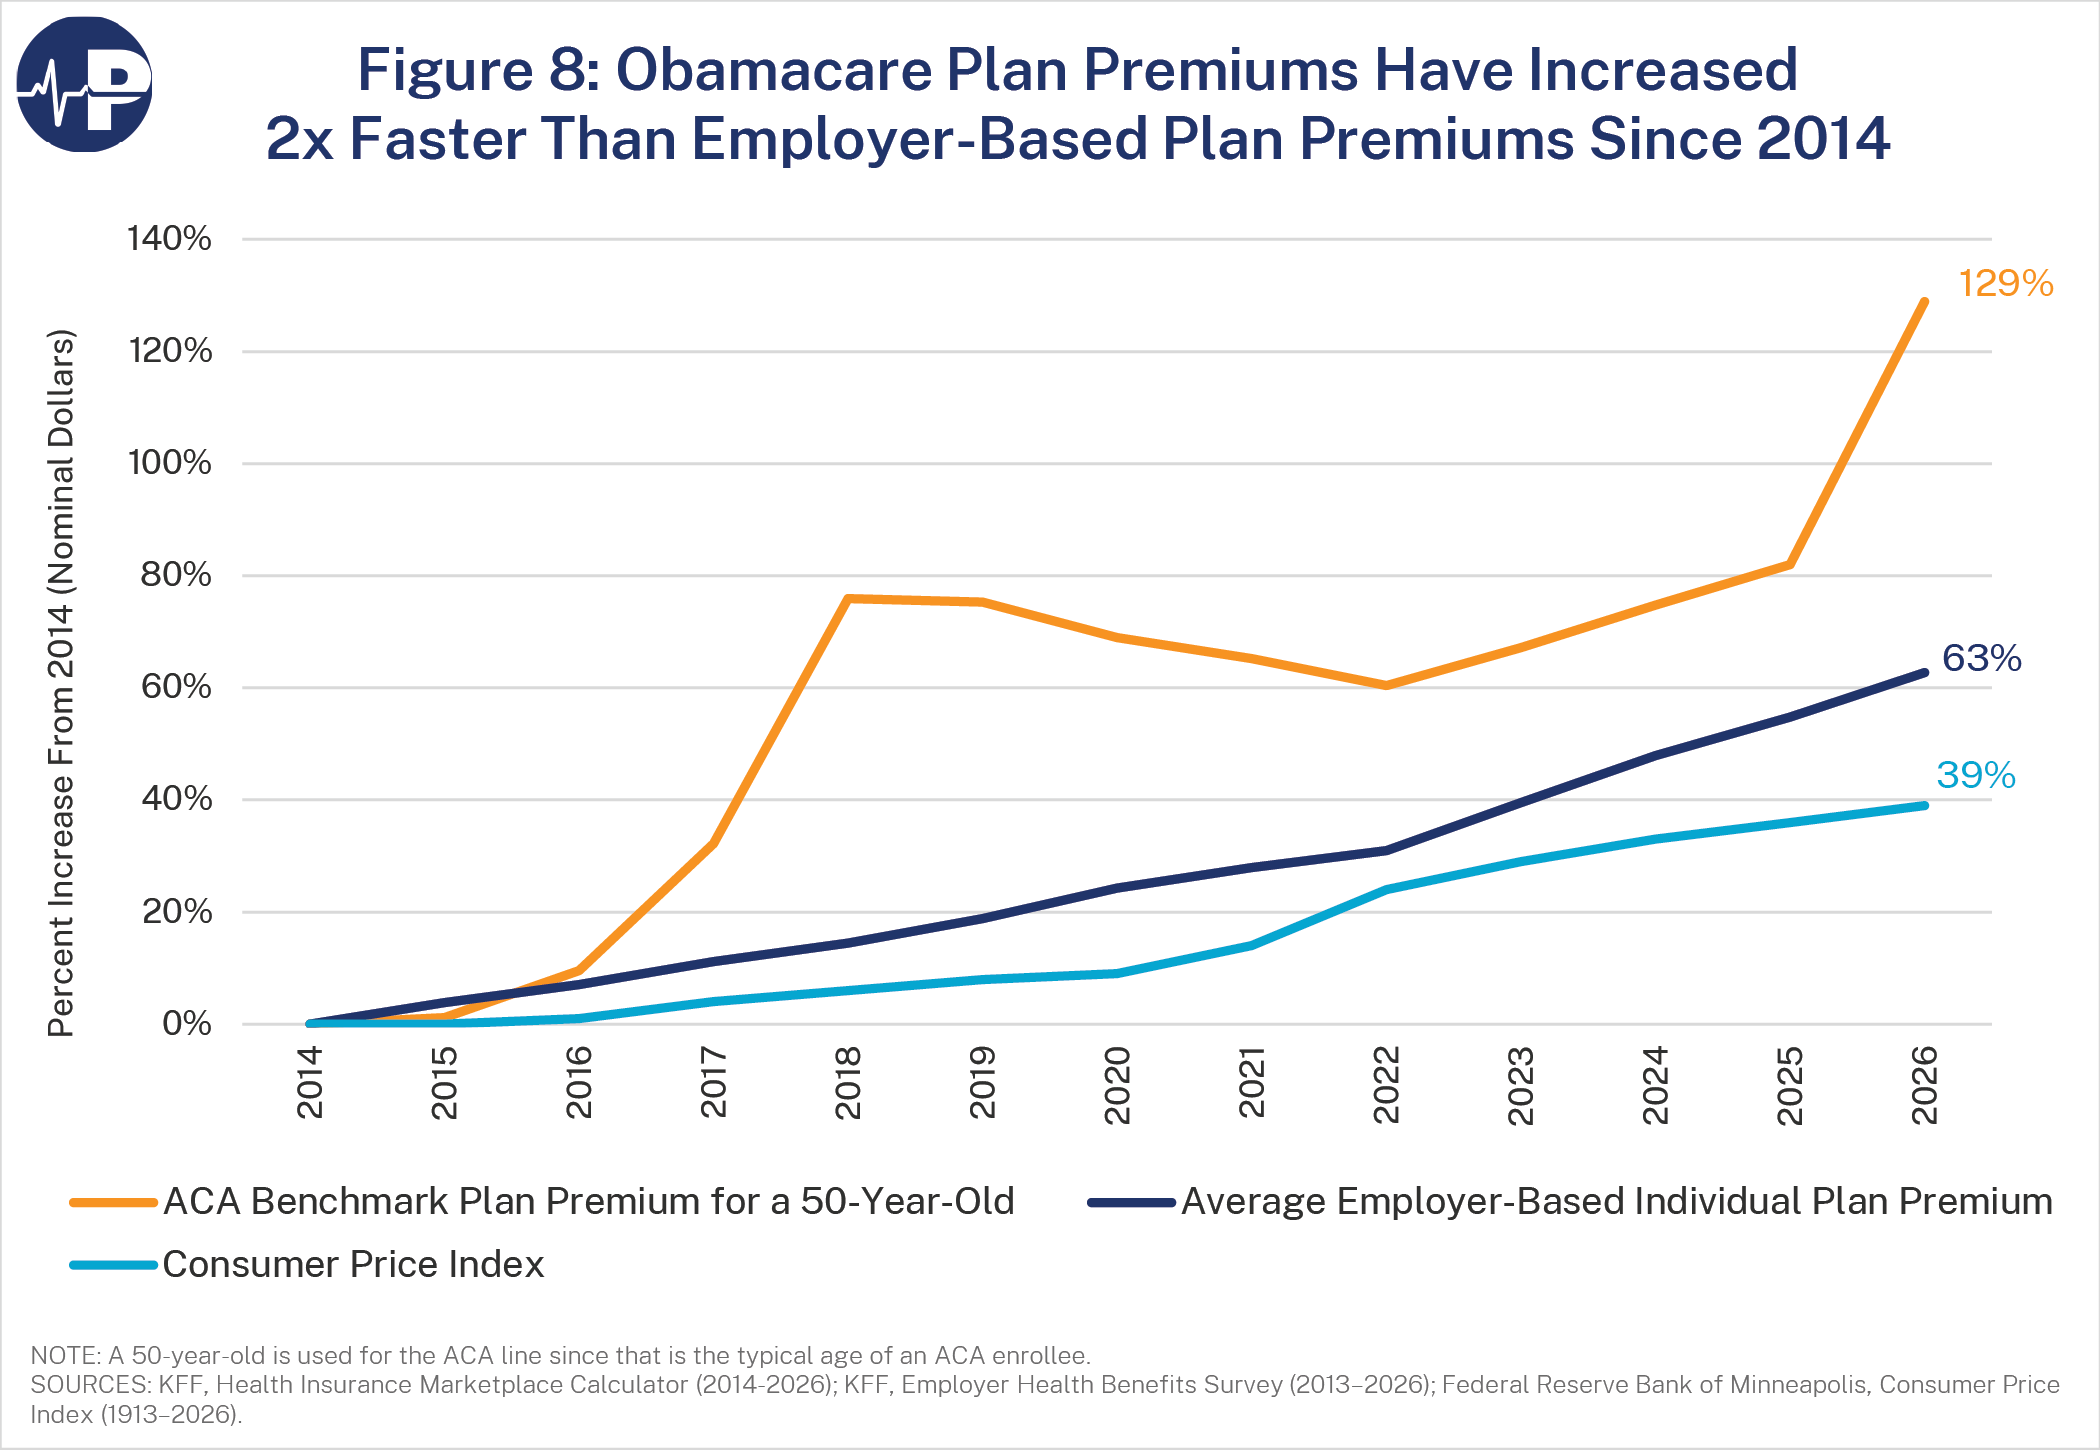
A particularly large increase in premiums occurred in 2018, driven by “silver loading”—the practice of inflating ACA silver plan premiums to cover insurers’ cost-sharing reduction (CSR) obligations after a court ruled that the Obama administration’s CSR payments were unlawful.5 After the federal government halted CSR payments in 2017, insurers still had to offer CSR plans to eligible enrollees. To recoup these costs, insurers increased premiums on silver plans, which are used to calculate benchmark premiums and determine premium tax credits (PTCs). Insurers overshot those premium increases in 2018—which is a large reason for the decline during the next few years.
High Deductibles and Narrow Networks
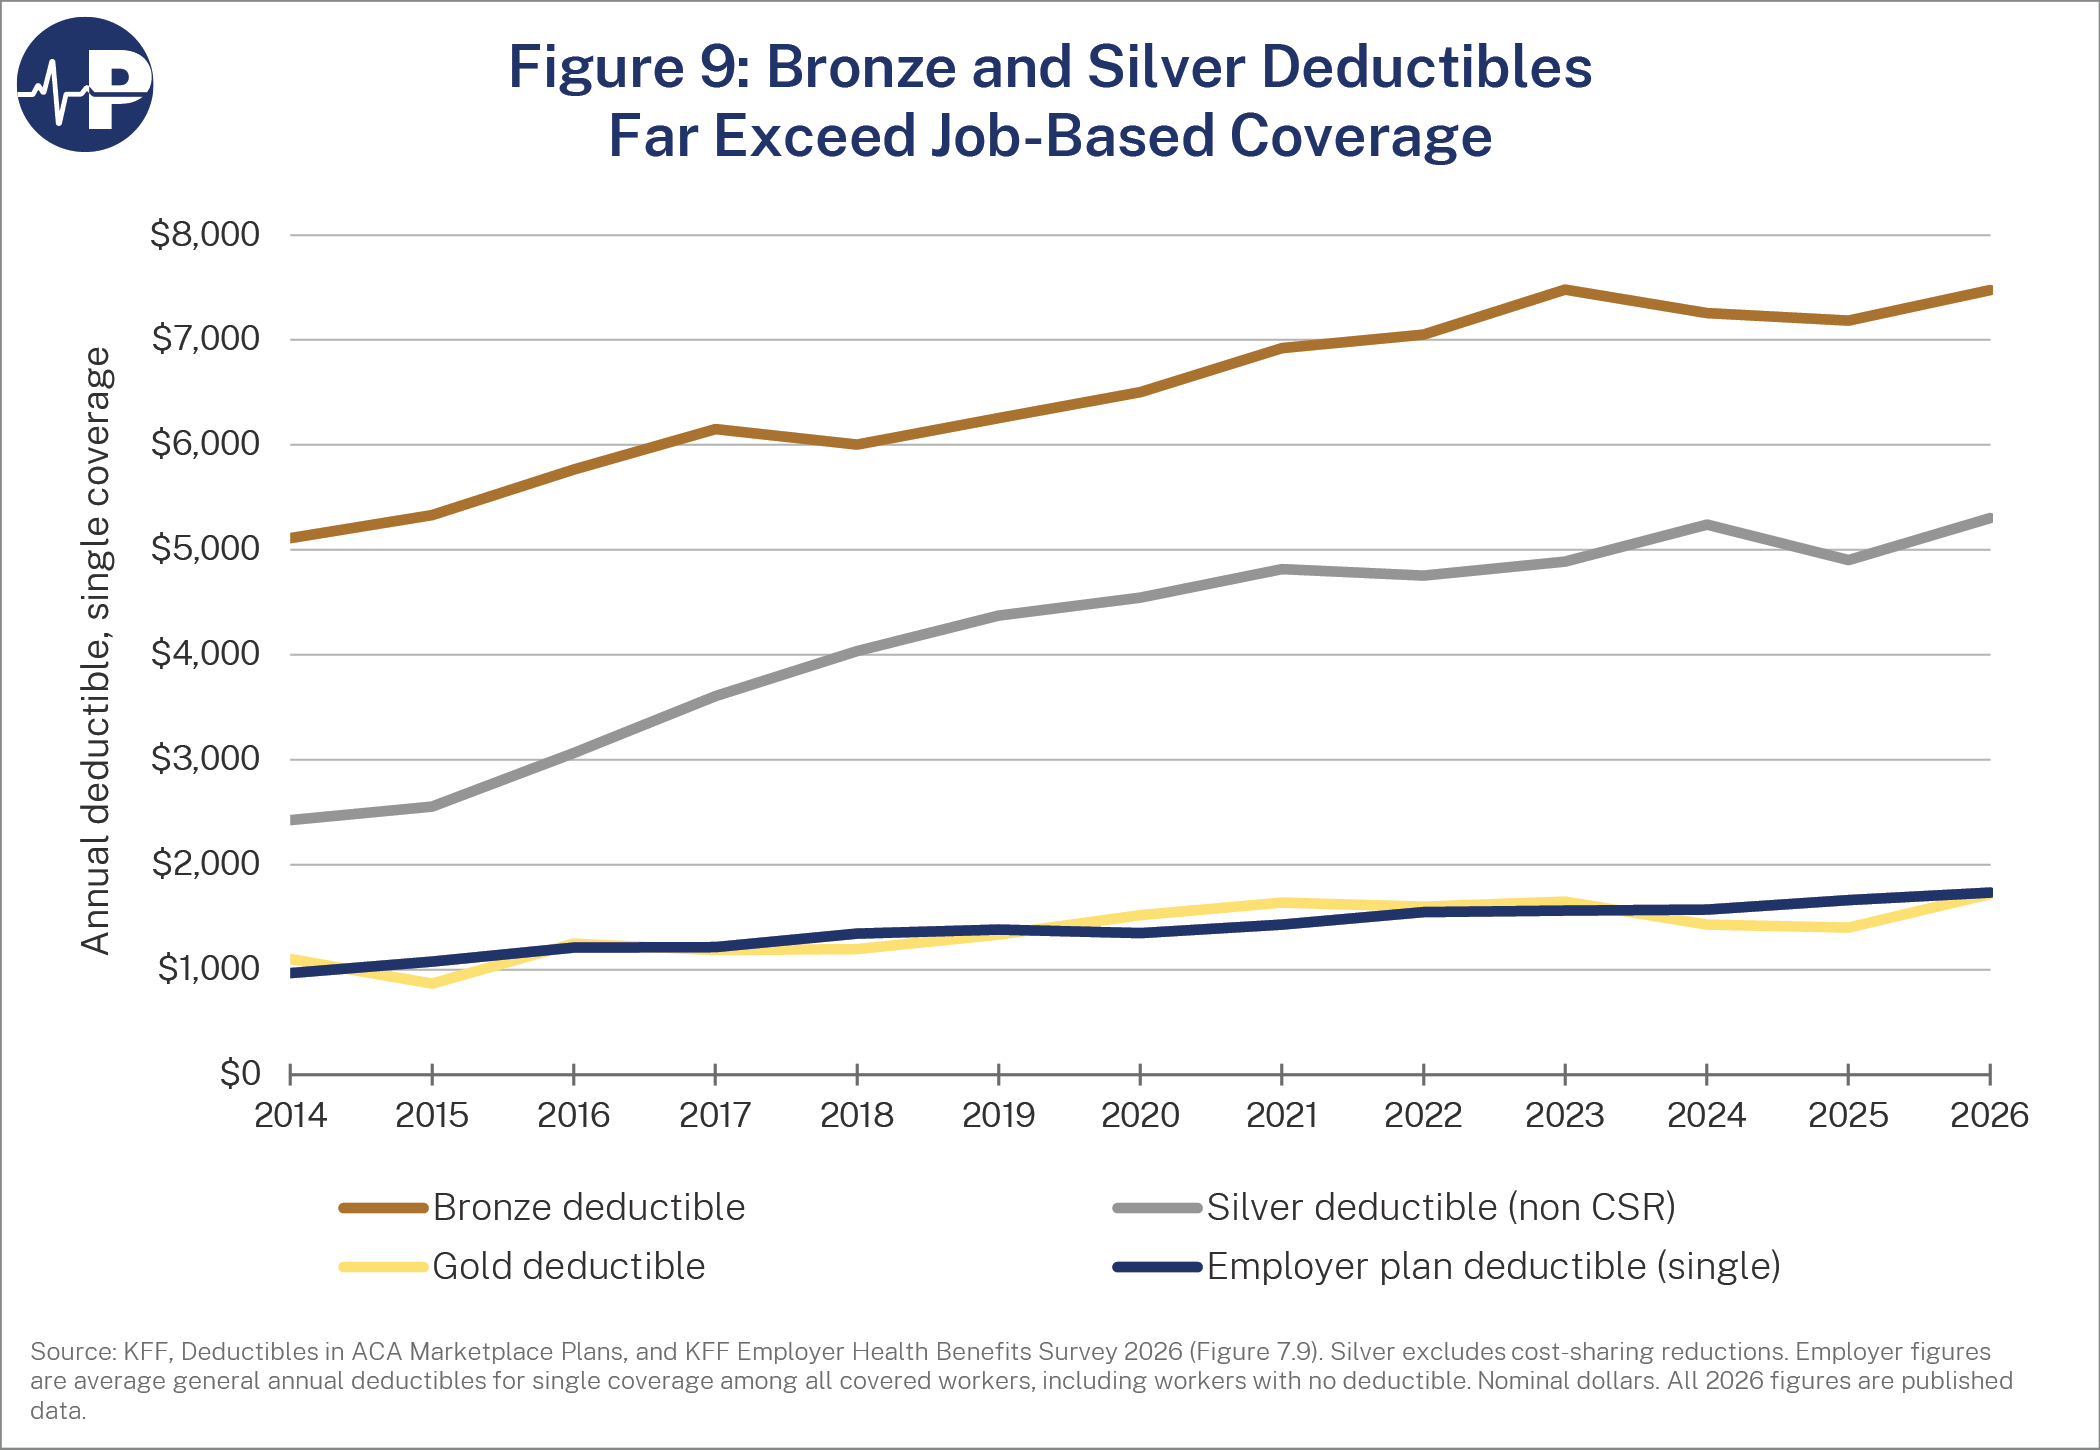
Figure 9 shows that ACA bronze and standard silver plans have substantially higher deductibles than ESI. In 2026, the average bronze plan deductible was approximately $7,500, while the average standard silver plan deductible exceeded $5,000. By comparison, the 2026 average deductible for employer coverage was about $1,700, roughly the same as the average ACA gold plan deductible. These differences are particularly important for enrollees who do not qualify for cost-sharing reductions, as they may face thousands of dollars in out-of-pocket costs before their insurance covers many services. Thus, even with substantial federal premium subsidies, many ACA plans provide significantly less financial protection than typical employer coverage.
The combination of rising premiums and high deductibles is a measure of the individual’s financial exposure. As Figure 10 shows, by 2026, the combined premium and deductible was much higher for ACA plans than employer plans. In 2014, the combined annual benchmark premium and standard silver deductible for a 50-year-old ACA enrollee was approximately $7,000, roughly equal to the combined premium and deductible for ESI. By 2026, the ACA combined amount had increased to nearly $16,000, compared with approximately $11,500 for ESI. Thus, the combined premium and deductible for ACA coverage increased by nearly twice as much in dollar terms as the corresponding amount for ESI. Although enrollees do not necessarily incur their full deductibles, the comparison illustrates the much greater potential financial exposure associated with ACA coverage, even before accounting for its narrower provider networks.
The differences between individual-market and ESI coverage extend beyond premiums and deductibles to patients’ choice of providers and access to care. Individual-market coverage generally provides substantially less access to out-of-network care and narrower provider networks than ESI plans. Figure 11, from a September 2024 Paragon study by Daniel Cruz and Greg Fann, shows that 83 percent of individual-market enrollees were in closed-network HMO or EPO plans in 2023, compared with just 18 percent of people with ESI coverage.6 A study published in JAMA Network Open independently found that large-group ESI plans included an average of 57 percent of local primary care physicians, compared with just 36 percent for ACA marketplace plans.7 A 2024 KFF analysis found that marketplace enrollees had access to only 40 percent of local physicians, on average.8 KFF also found that marketplace enrollees were more likely than those with ESI coverage to report that a needed doctor or hospital was not covered by their plan (20 percent versus 13 percent).9
The Surge in Improper and Phantom Enrollment
Table 1 compares open enrollment plan selections with average monthly effectuated enrollment from 2014 through 2026. It shows how the gap between these measures has changed over time. The 2026 average reflects only January and February enrollment. Before the COVID-era subsidy boosts, average monthly effectuated ACA exchange enrollment was approximately 18 percent below open enrollment plan selections from 2014 through 2019, reflecting normal attrition as individuals transitioned to other coverage or chose not to pay their share of premiums. Average monthly effectuated enrollment refers to the average number of enrollees with effectuated coverage during the period measured, including those who paid their monthly premium or had no premium obligation because subsidies covered the full premium.
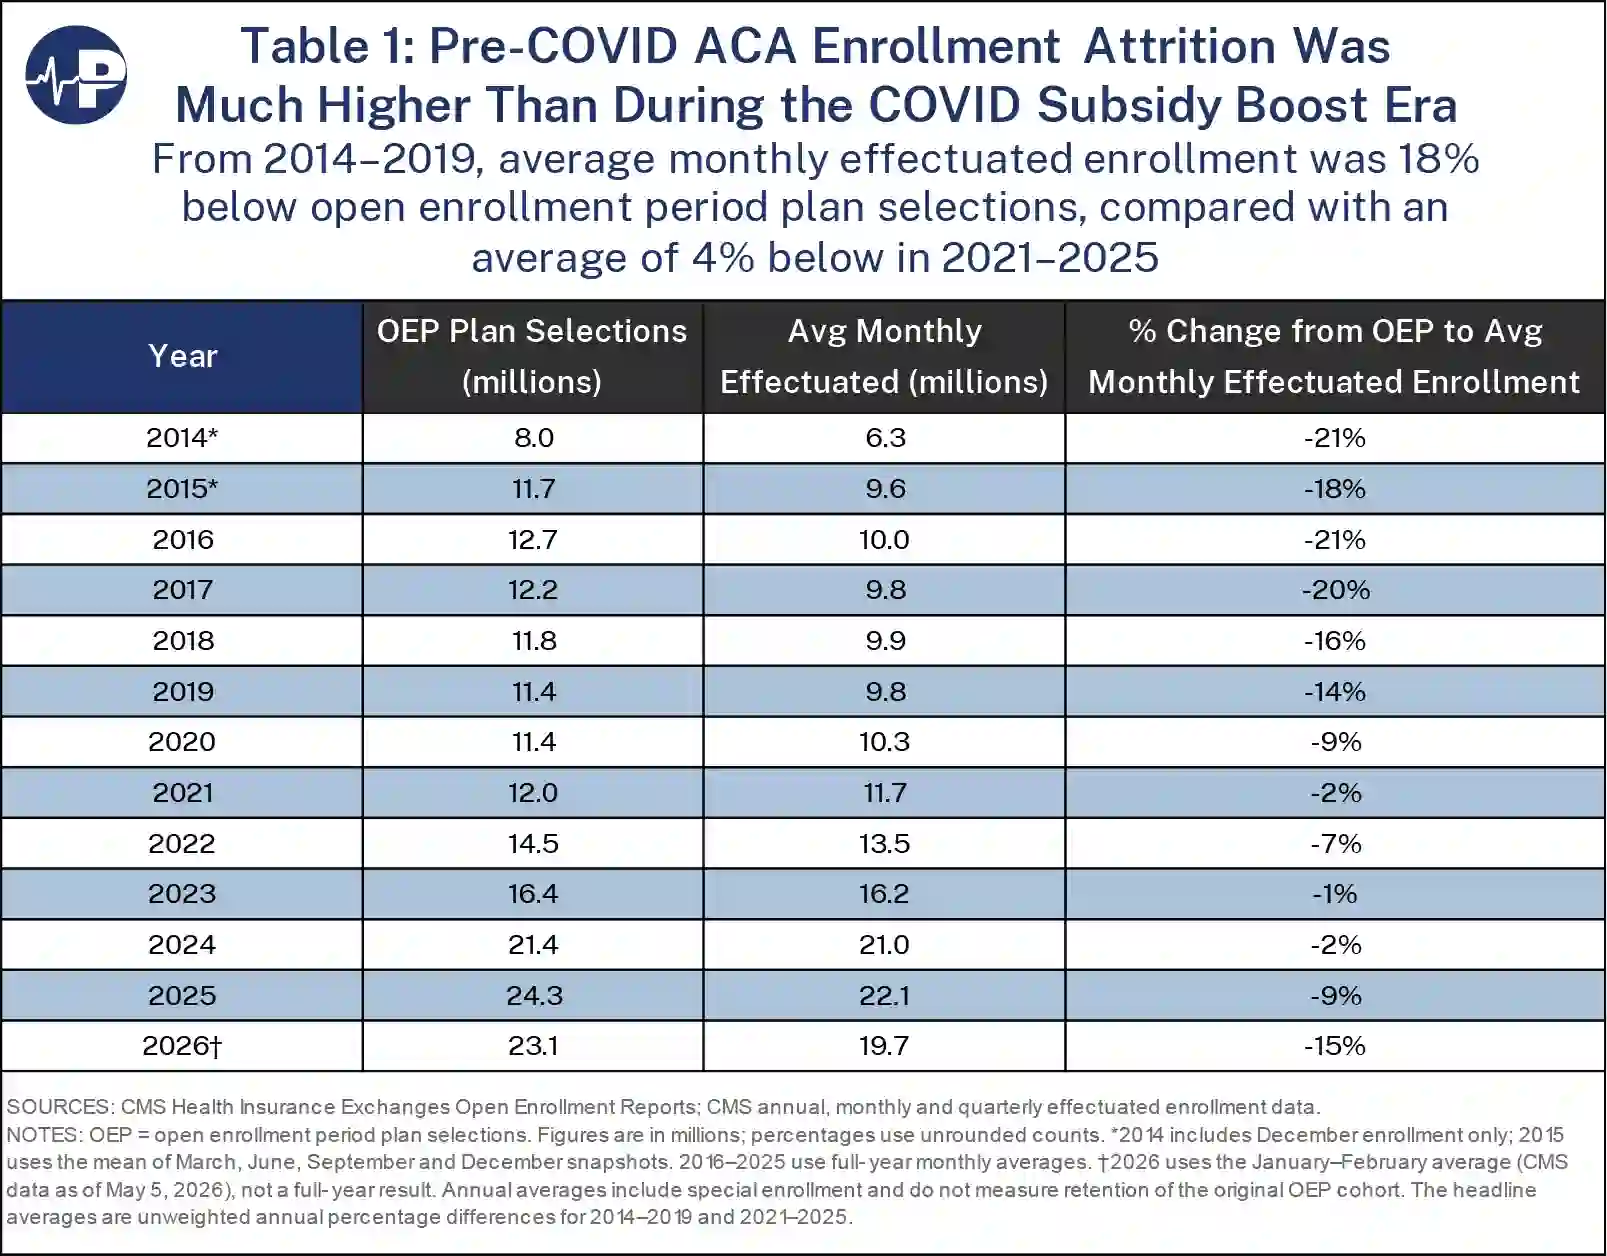
Through February 2026, average monthly effectuated enrollment was 15 percent below open enrollment selections, compared with a 9 percent gap for 2025.10 Although the 2026 data are preliminary and cover only the first two months of the year, the widening gap suggests that enrollment patterns may be moving back toward their pre-COVID levels as enhanced subsidies expire and CMS strengthens program-integrity enforcement.
HealthCare.gov enrollment has become increasingly concentrated among people reporting incomes between 100 and 150 percent of FPL, with reported enrollment far exceeding the subsidy-eligible population in this income range in many states. During the COVID enhanced subsidy period, these enrollees qualified for fully subsidized silver plans with a 94 percent actuarial value. Enrollment in this category surged from fewer than 5 million in 2023 to nearly 9 million in 2026, accounting for 56 percent of all HealthCare.gov plan selections. Figure 12 shows the percentage of enrollment by FPL grouping from 2015 to 2026, and Figure 13 shows total enrollment by FPL grouping.
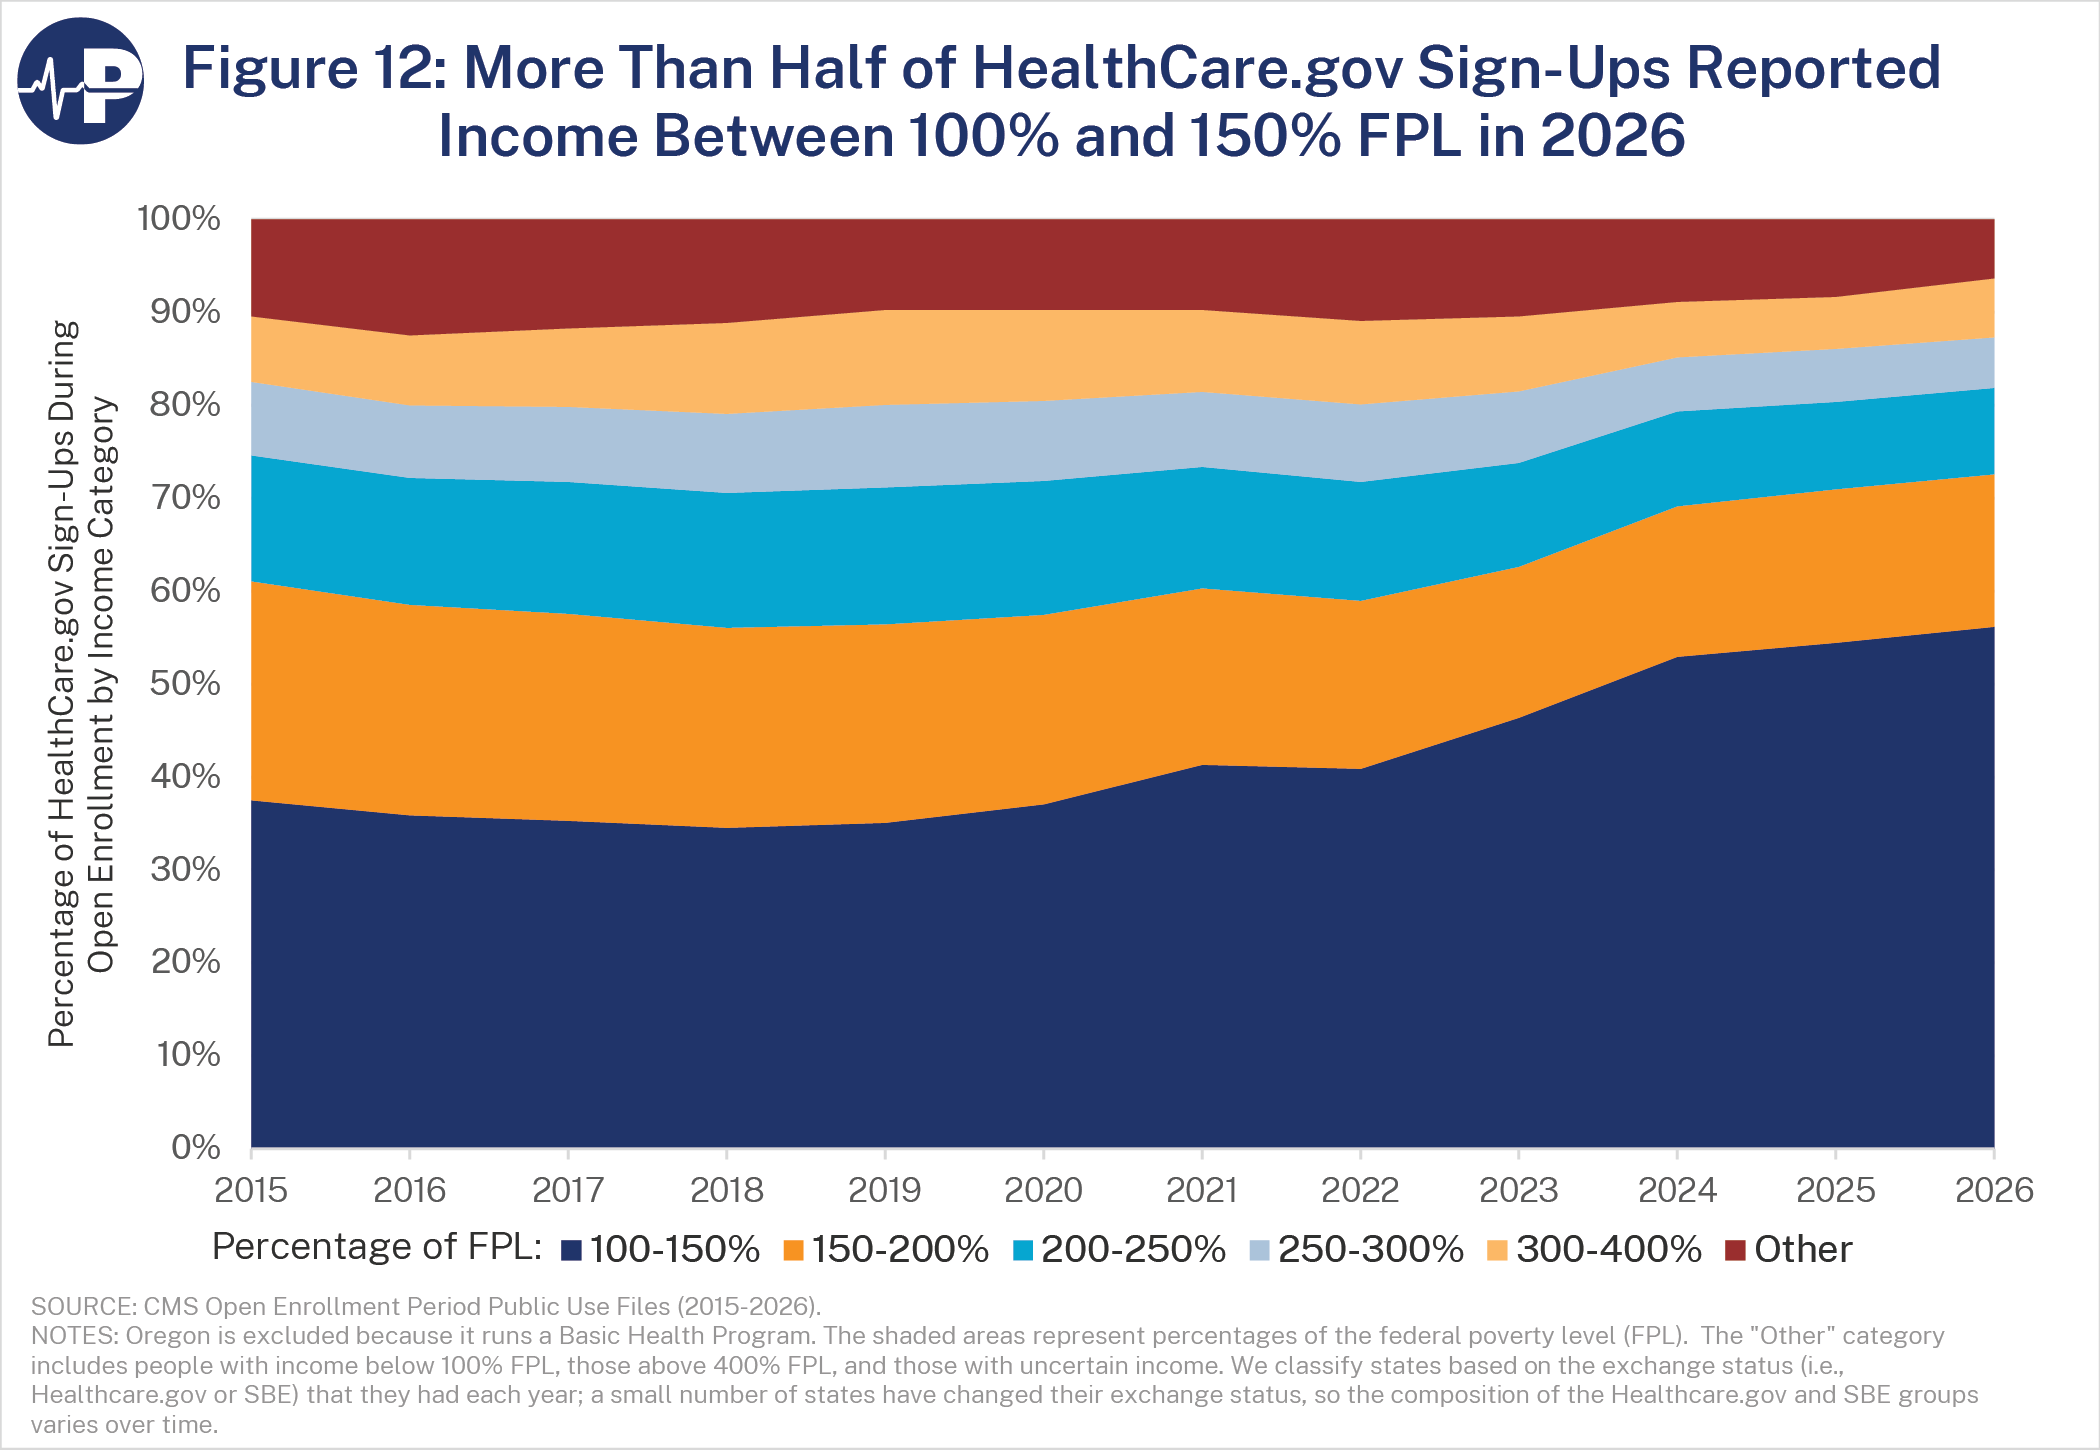
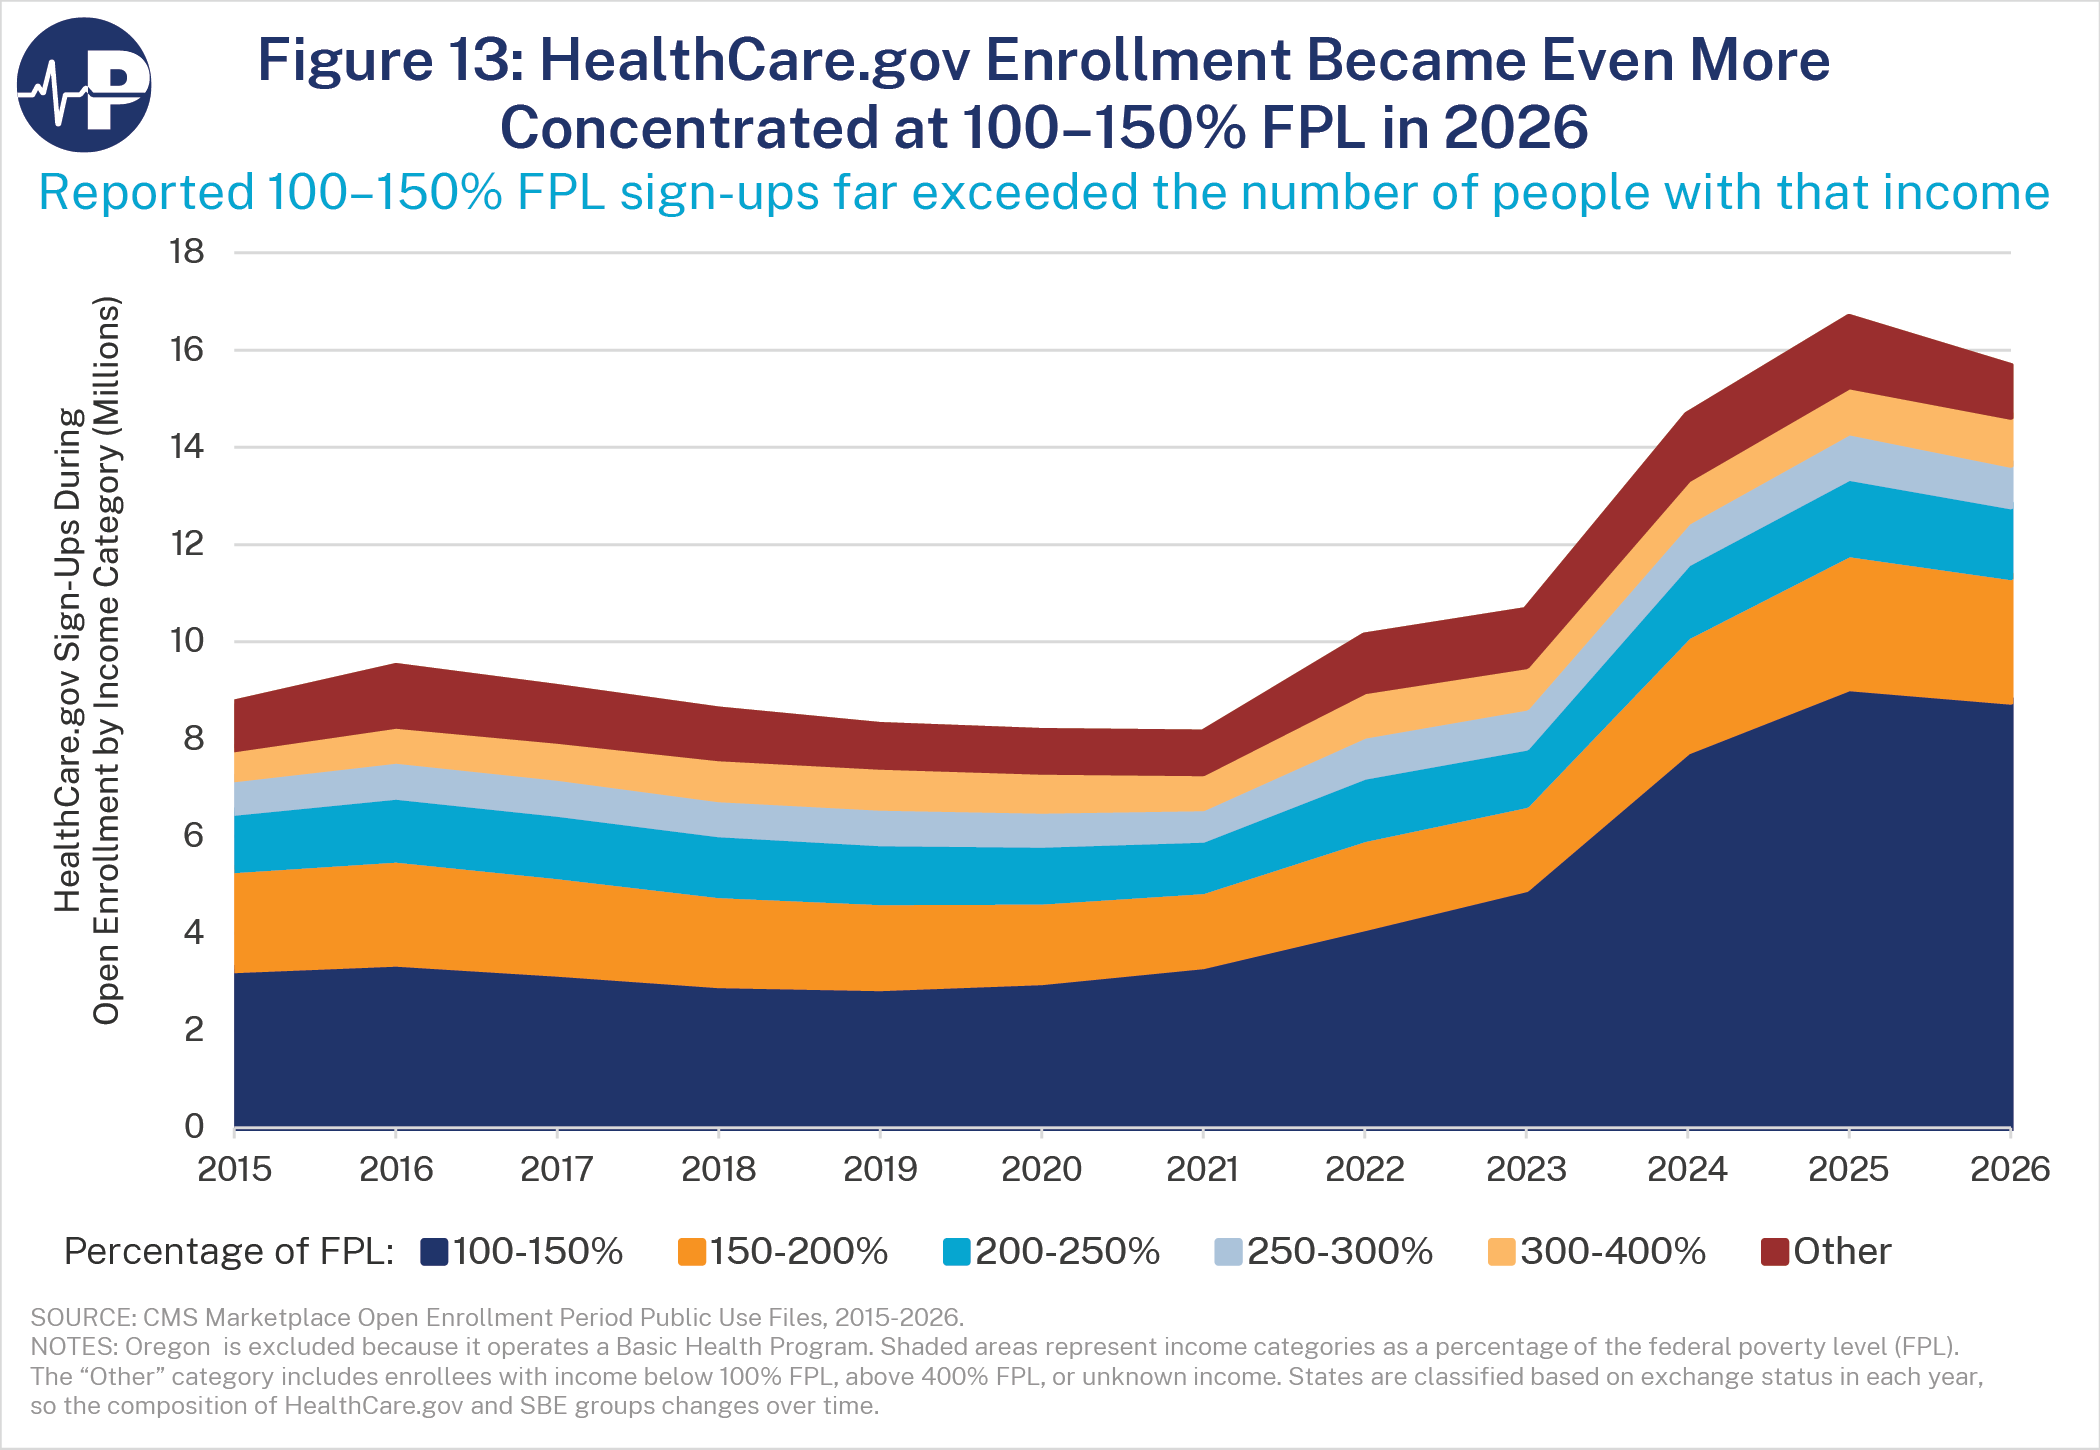
The number of people signing up in this income category far exceeds the number of Americans who actually have incomes in that range—strong evidence of widespread improper enrollment.11 Zero-premium plans are central to the problem. When coverage requires no premium payment from the enrollee, brokers can enroll people without their knowledge, and fictitious enrollees can remain on the rolls. People who are unaware they have coverage, or who do not even exist, cannot pay premiums themselves. Fully subsidized plans eliminate that natural check on enrollment while allowing insurers to continue collecting federal subsidies.
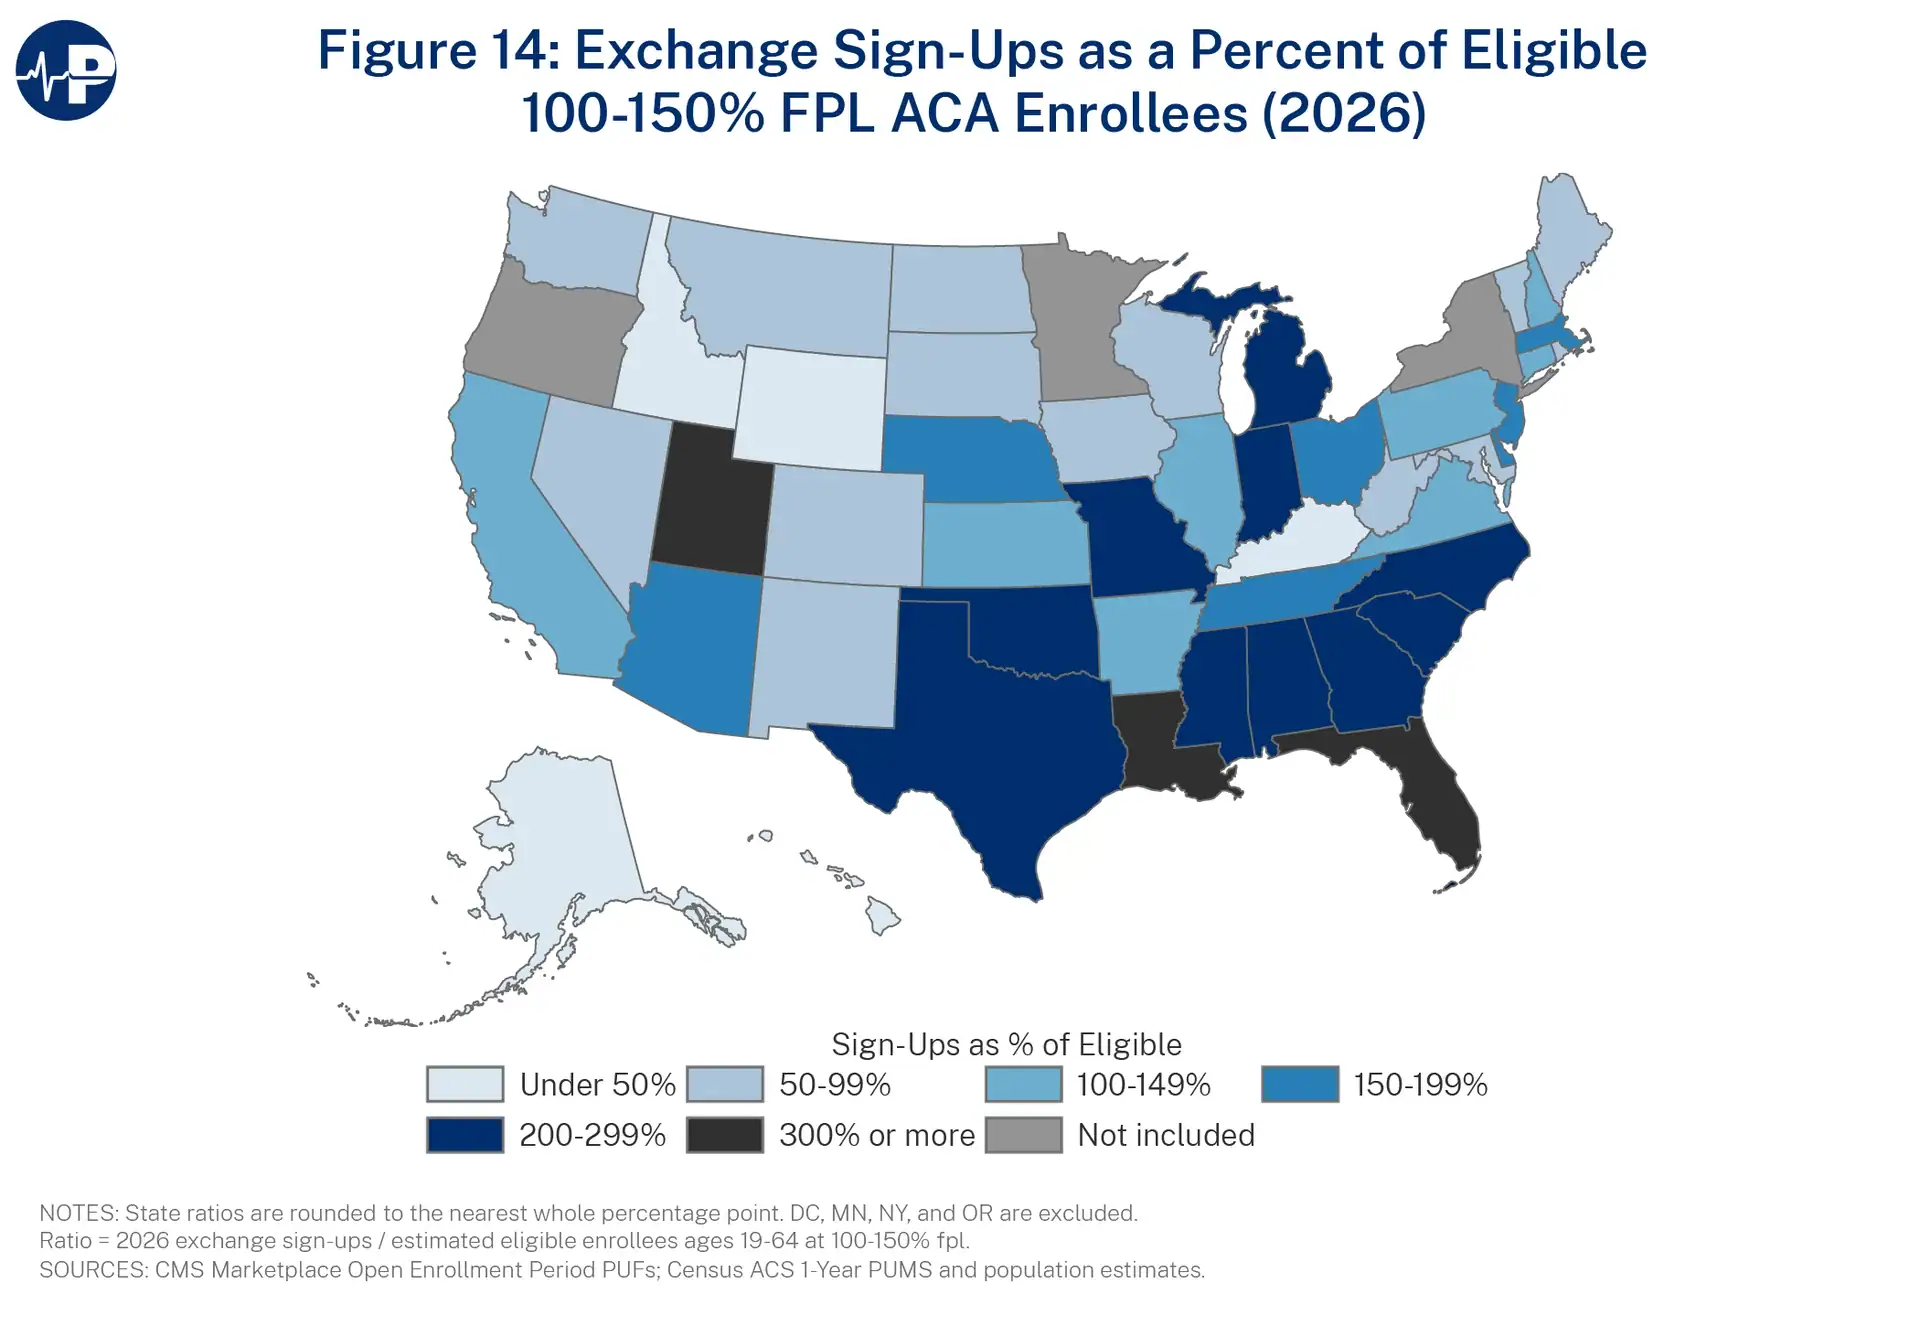
Figure 14 shows that the apparent improper exchange enrollment is heavily concentrated in the Sun Belt. In 13 states, the number of people signing up for exchange coverage in 2026 who reported incomes between 100 and 150 percent of the FPL was more than twice the estimated number of people eligible for exchange subsidies in that income range. In several states, including Florida, Louisiana, and Utah, reported enrollment exceeded three times the estimated eligible population.
Zero-Claim Enrollment and the Evidence of Phantom Coverage
In August 2025, CMS released data on individual-market enrollees who had no medical claims from 2019 through 2024.12 While a well-functioning health insurance market would be expected to include enrollees with no medical claims in any given year, the ACA individual market exhibits unusually elevated numbers of zero-claim enrollees. As Figure 15 shows, the percentage of enrollees without claims was nearly identical in the ACA individual and small-group markets from 2019 through 2021, before the enhanced subsidies were available during open enrollment (they were enacted in March 2021, after that year’s open enrollment period). After the enhanced subsidies took effect, the trends diverged sharply. The share of individual-market enrollees without claims rose from 19 percent in 2021 to 35 percent in 2024, while the small-group market remained relatively stable at approximately 20 to 22 percent. This divergence coincided with the proliferation of fully subsidized plans and provides strong evidence of growing phantom enrollment—people enrolled without their knowledge or fictitious individuals.
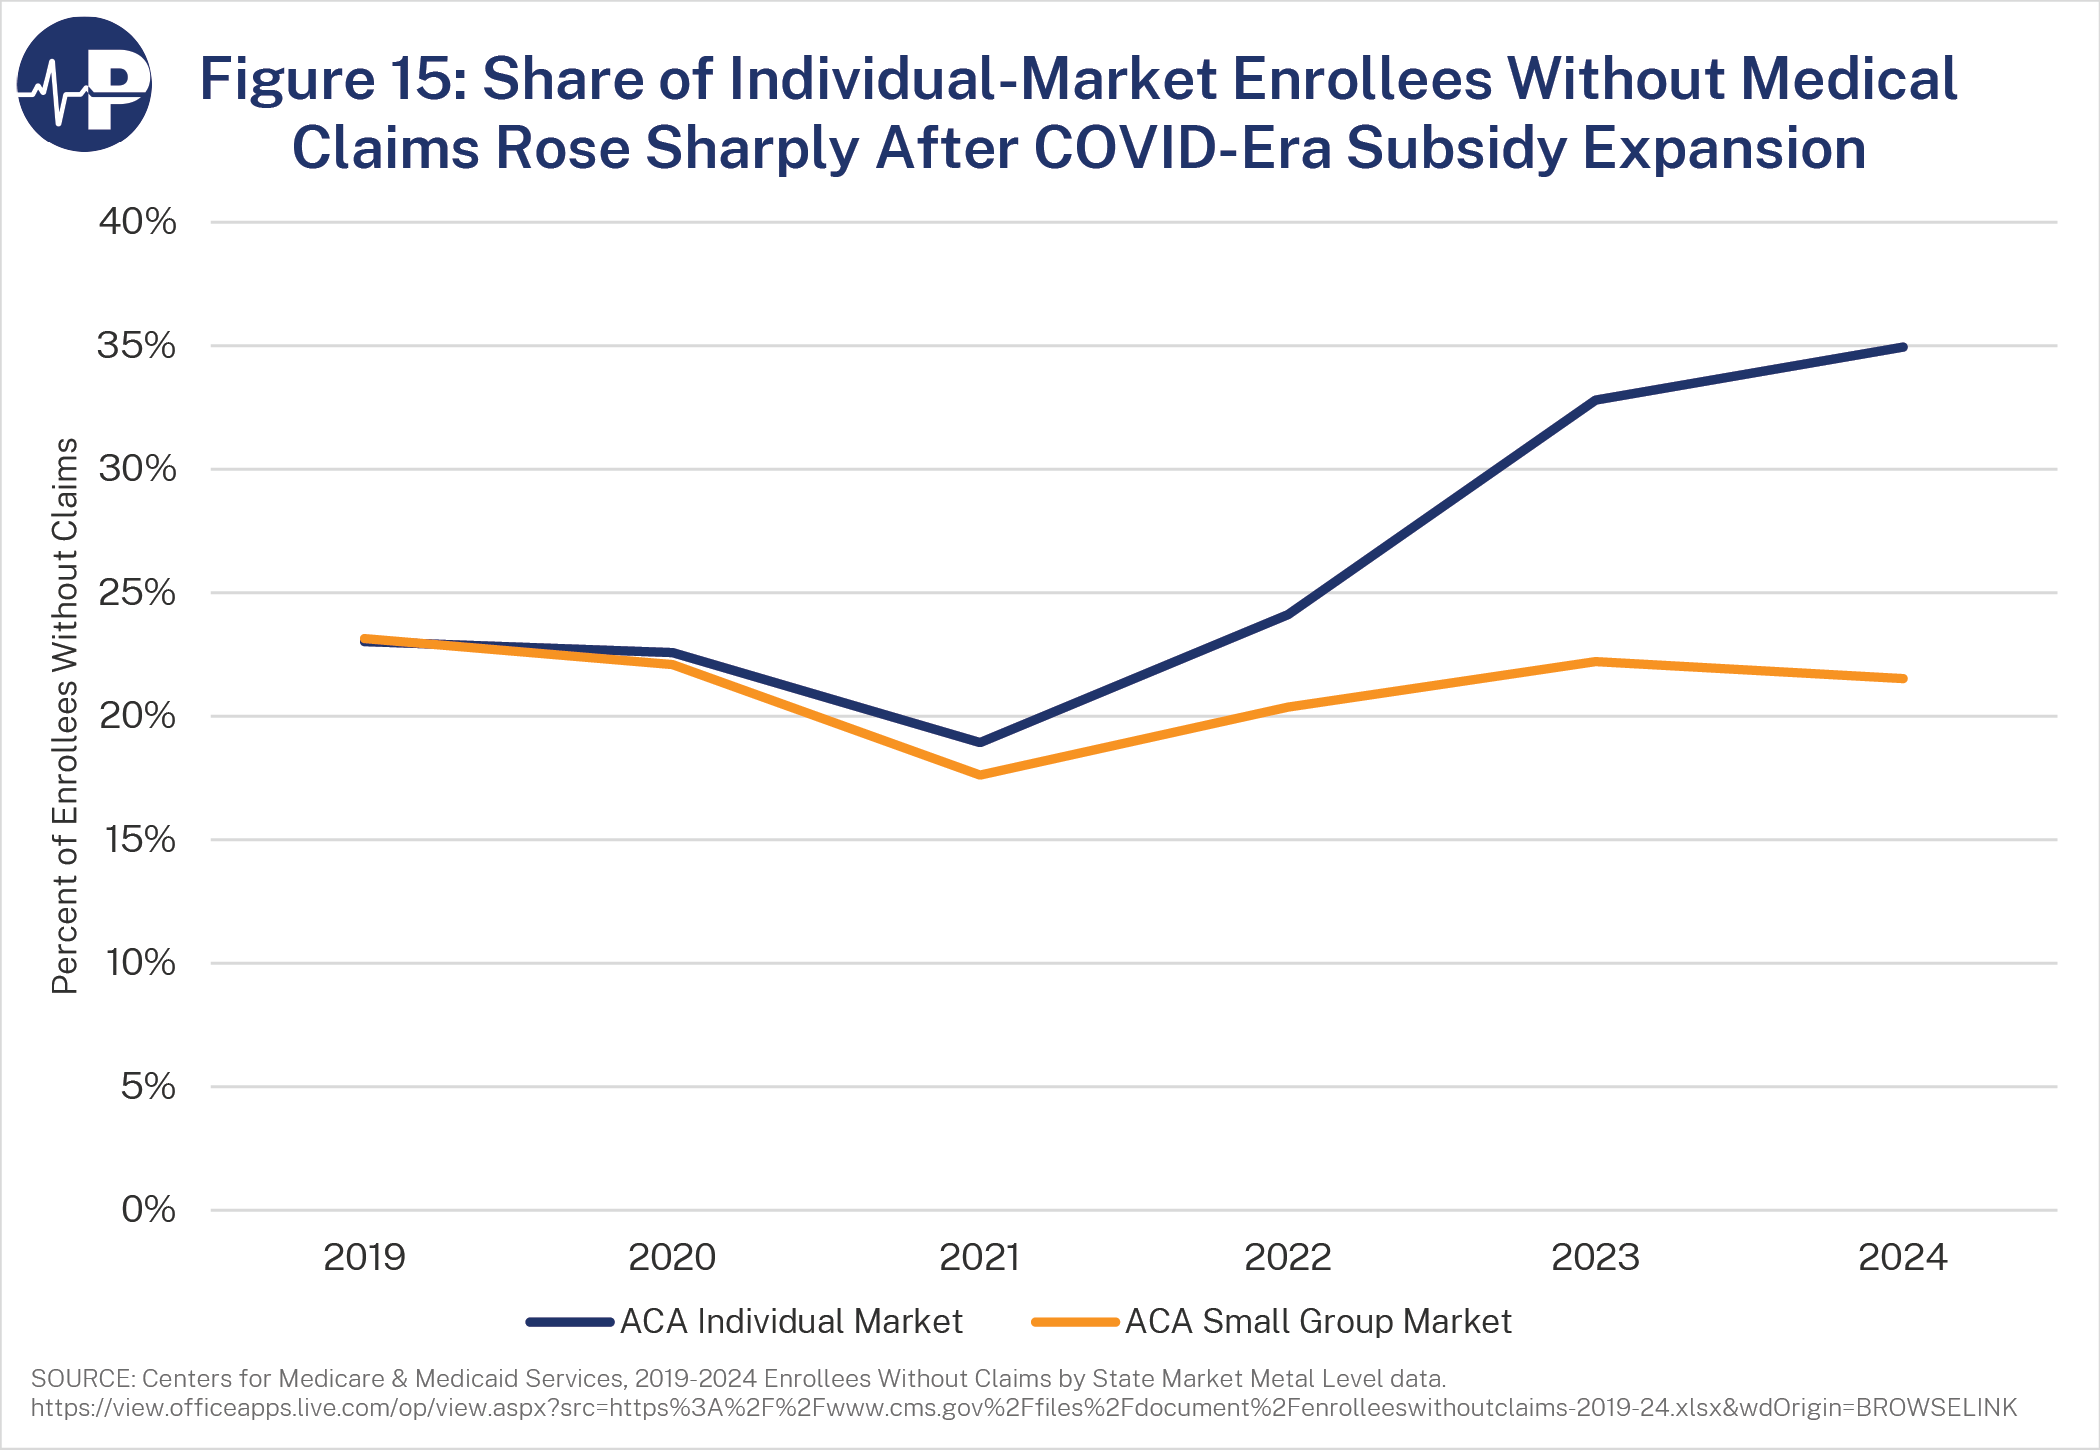
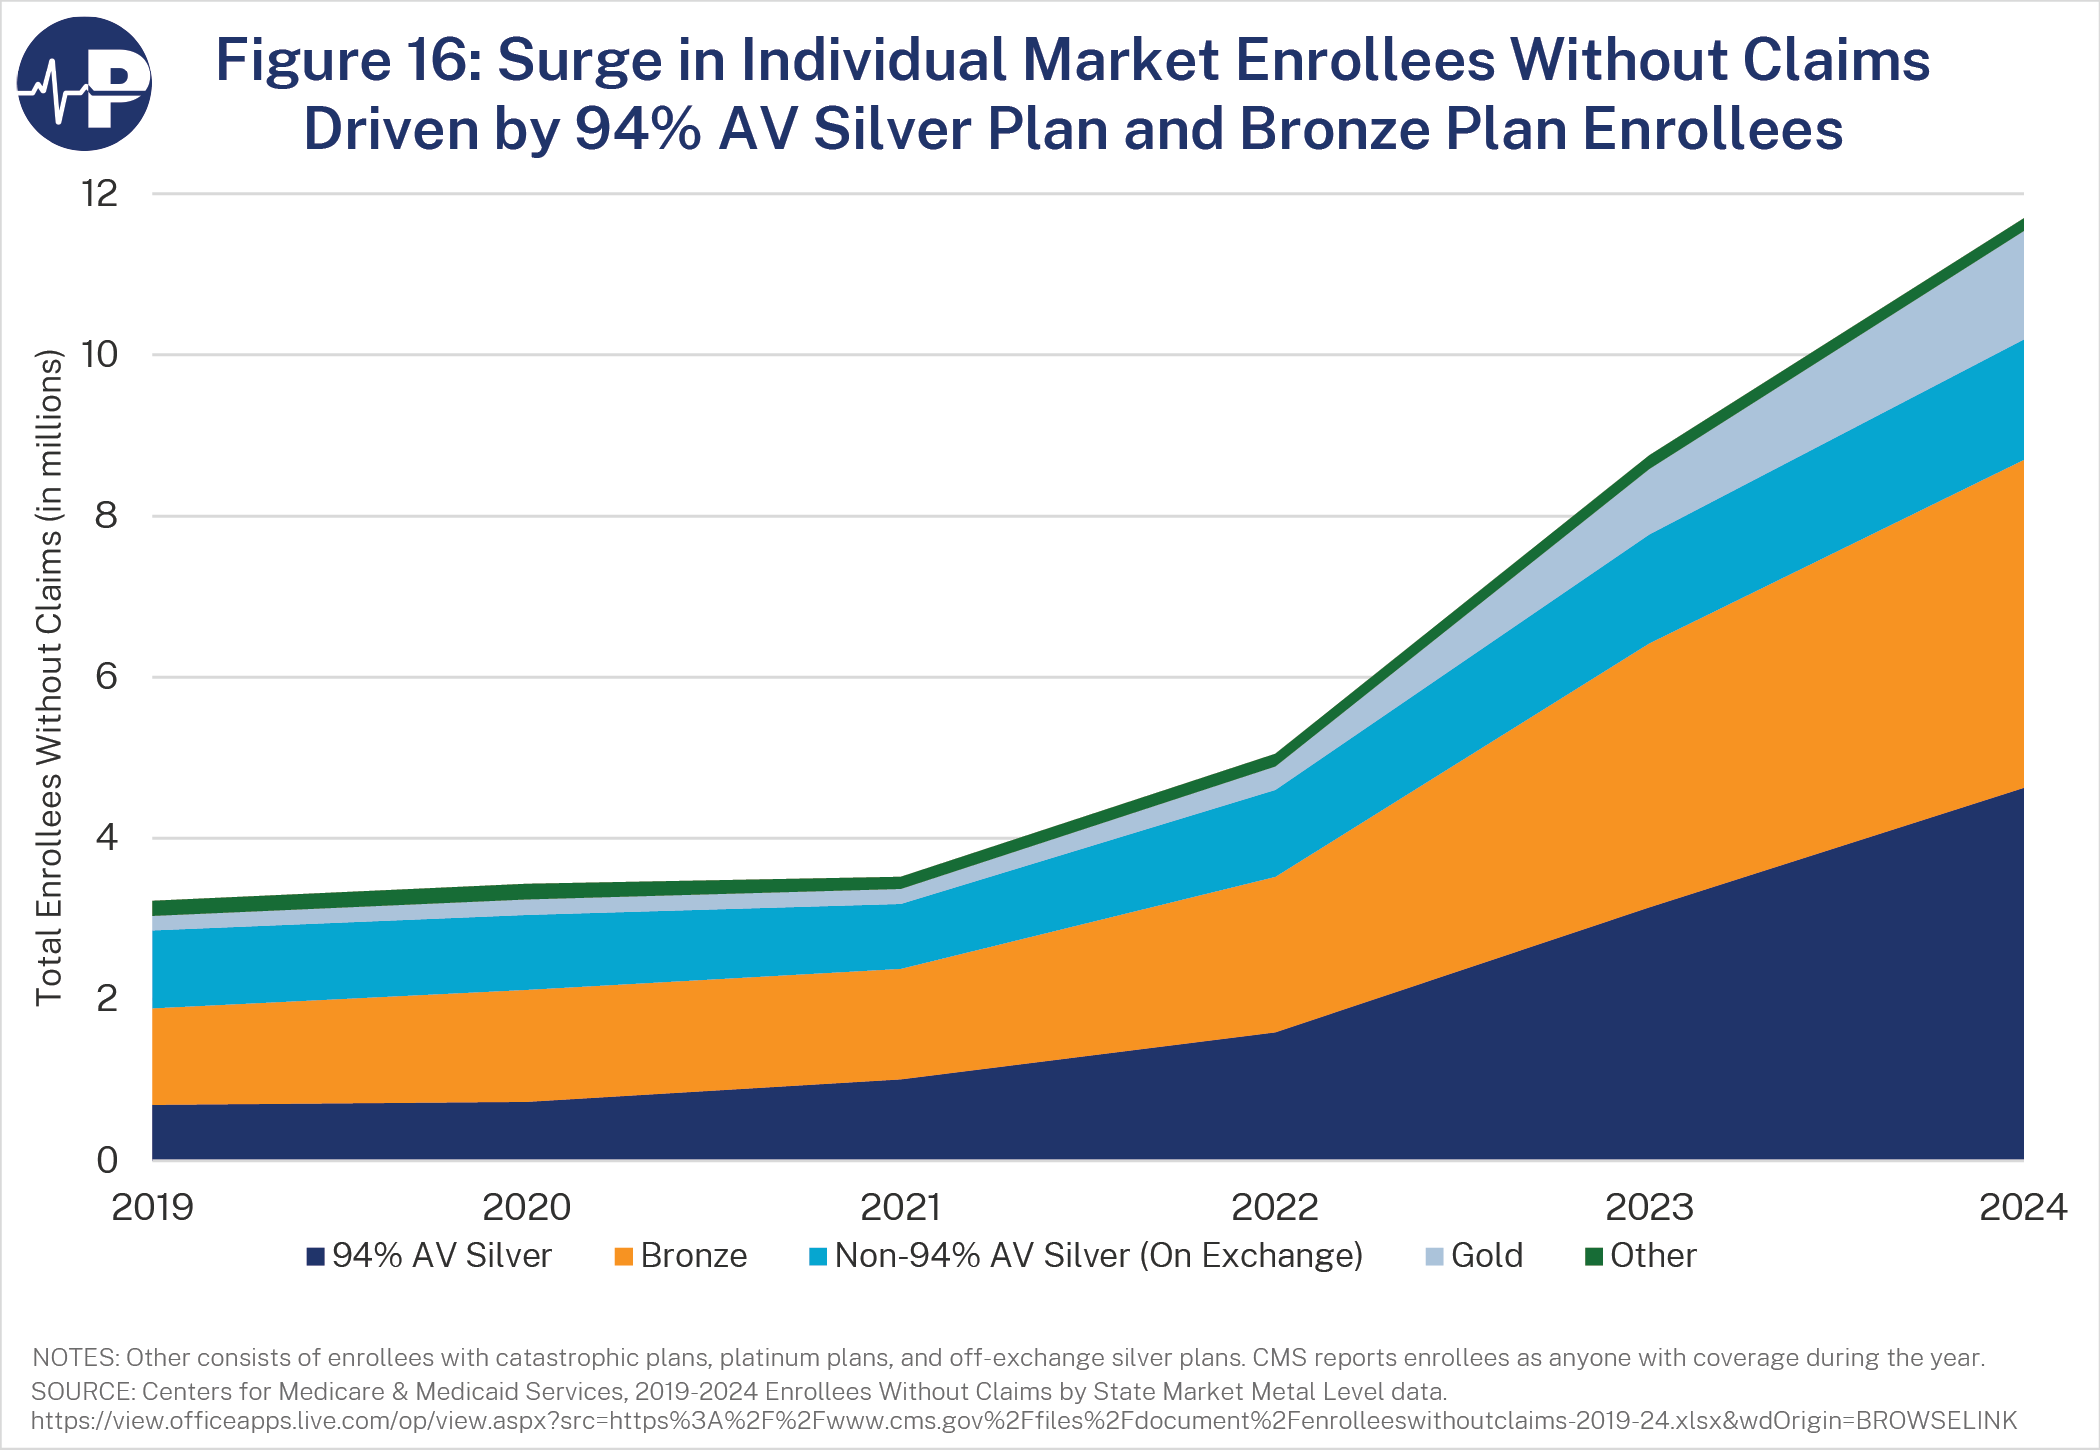
Figure 16 shows that the number of individual-market enrollees without medical claims surged from approximately 3.5 million in 2021 to 11.7 million in 2024. Much of this increase occurred in 94 percent actuarial value silver plans, which were available with zero premiums to people reporting incomes between 100 and 150 percent of FPL, and bronze plans, almost all of which were also available with zero premiums for lower-income enrollees. These plans accounted for the vast majority of the increase in zero-claim enrollment. The CMS figures count anyone enrolled for any period during the year, rather than average monthly enrollment, and some individuals may be counted more than once if they switched plans. Zero-premium coverage allows unauthorized or fictitious enrollments to persist because people who are unaware of their coverage—or do not exist—cannot make premium payments themselves.
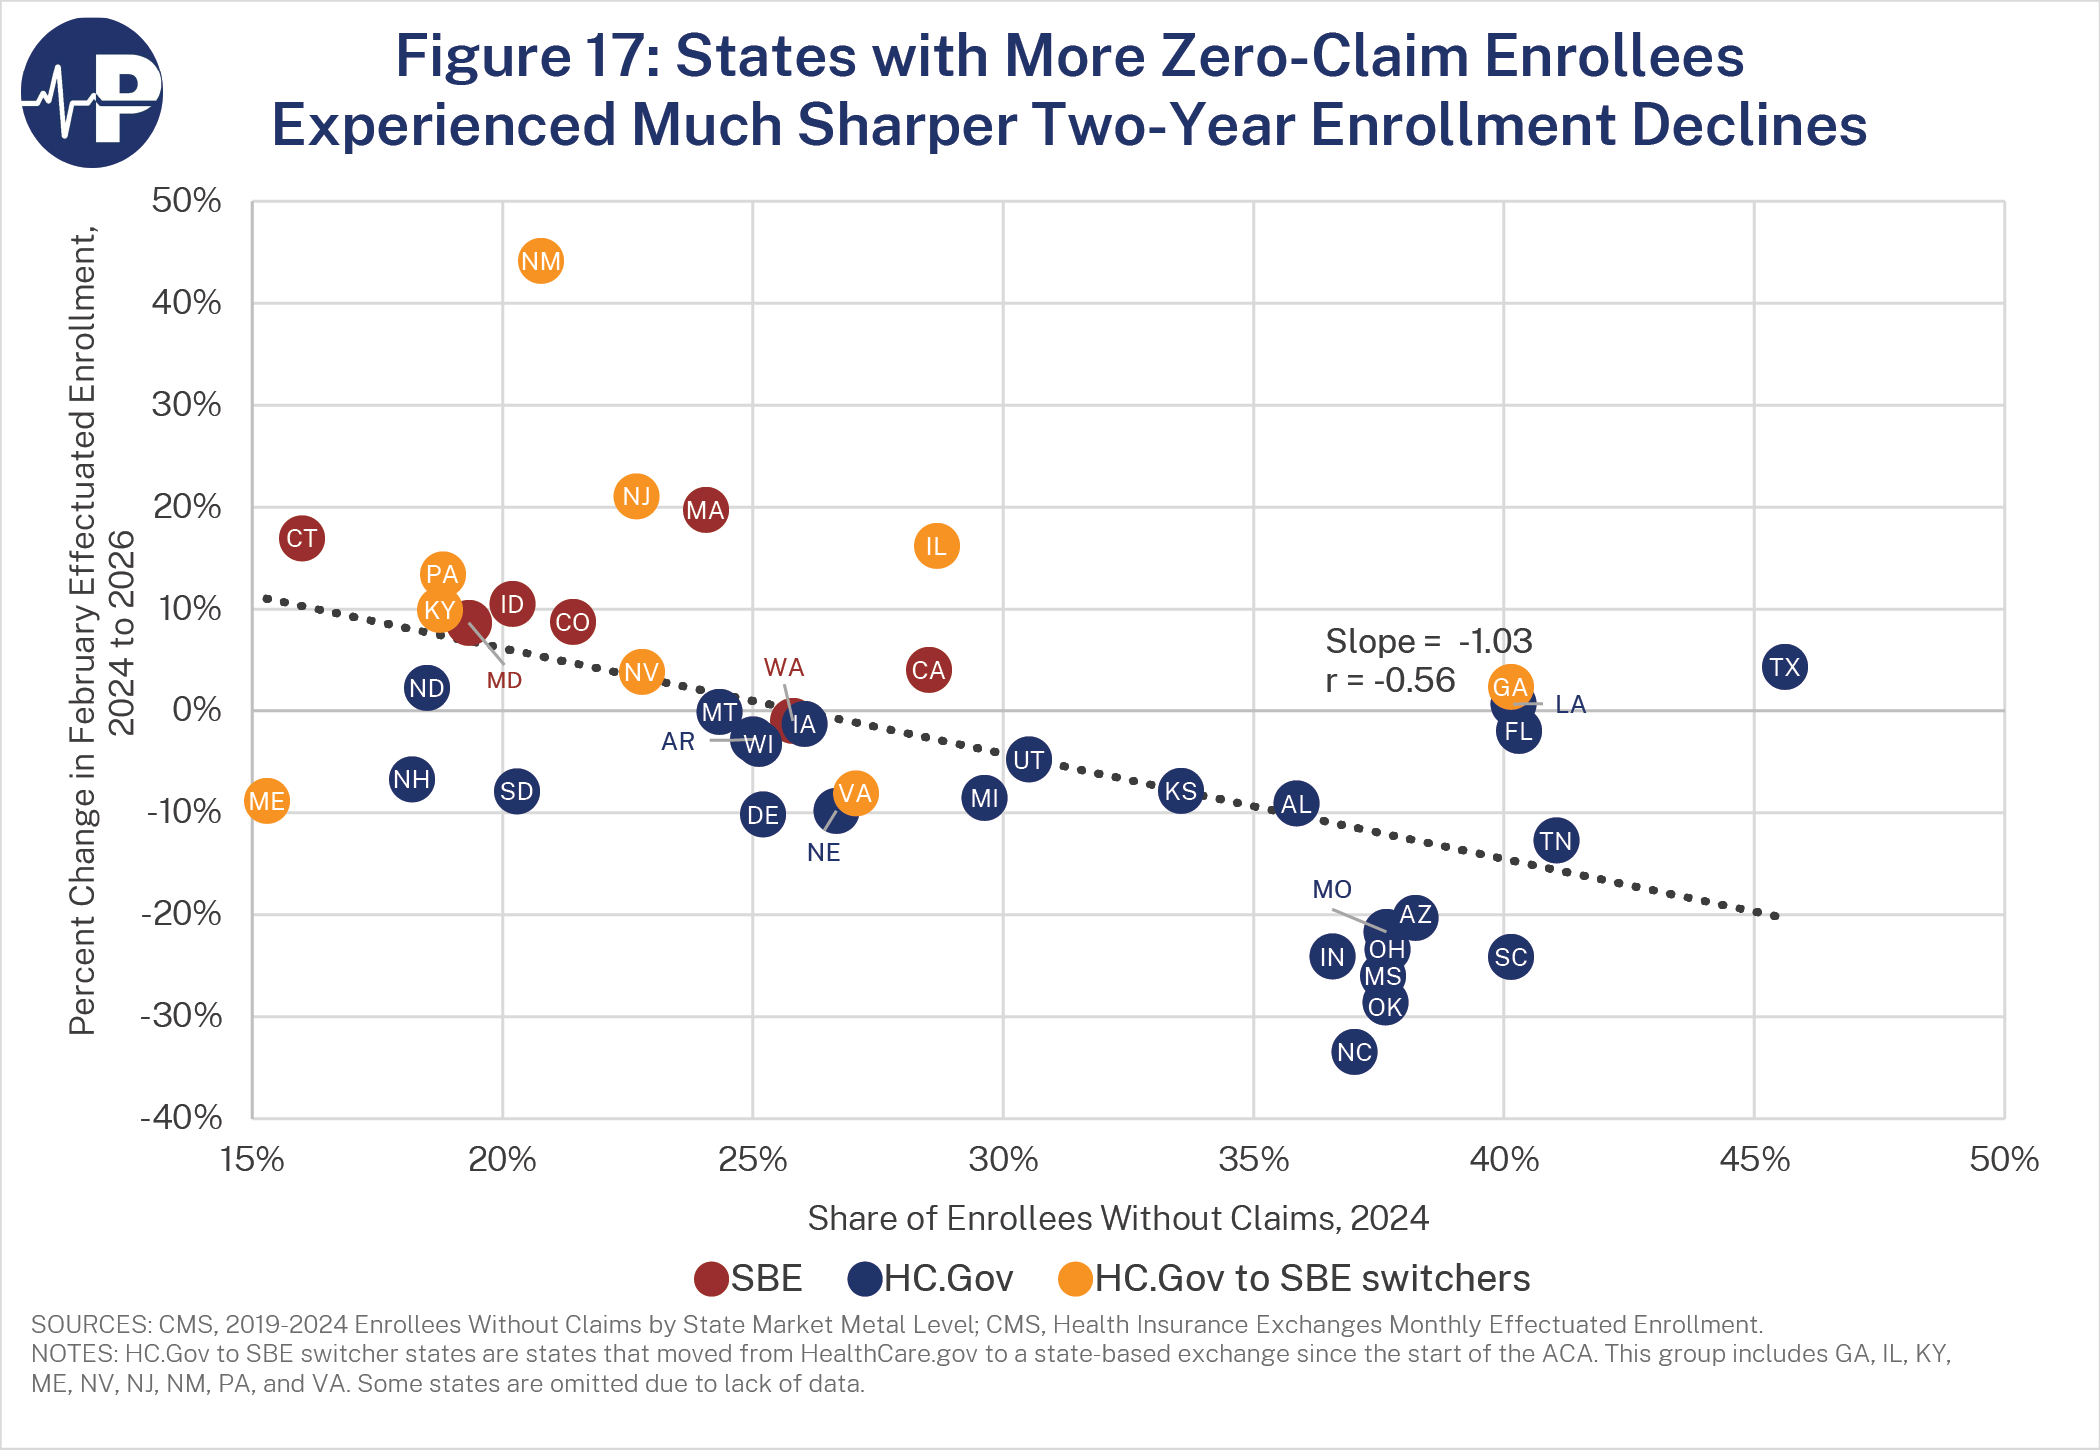
As Figure 17 shows, states with higher shares of individual-market enrollees who had no medical claims in 2024 generally experienced larger declines in effectuated enrollment between February 2024 and February 2026. The correlation was −0.56, and the fitted regression slope was approximately −1.03, indicating that each percentage-point increase in the zero-claim rate was associated with approximately a one-percentage-point greater decline in effectuated enrollment. States such as North Carolina, South Carolina, and Oklahoma, where zero-claim rates approached or exceeded 40 percent, experienced enrollment declines of roughly 25 to 35 percent. This pattern is consistent with the expiration of enhanced subsidies and program-integrity measures having a greater effect in states with more improper or phantom enrollment. Although the correlation does not establish causation, the relationship between unusually high zero-claim rates and subsequent enrollment declines provides additional evidence that the earlier enrollment surge included substantial improper and phantom enrollment.
Conclusion
The ACA exchanges have become an extraordinarily subsidized market characterized by rapidly rising premiums, high deductibles, narrow provider networks, and significant improper enrollment. The exchanges attracted far fewer enrollees than originally projected, and enrollment increased substantially only after Congress expanded subsidies during the pandemic. Those enhanced subsidies also created incentives for unauthorized and fictitious enrollments by making coverage free for millions of people. The unusually high concentration of enrollees reporting incomes between 100 and 150 percent of the FPL, the surge in enrollees without medical claims, and the relationship between zero-claim rates and subsequent enrollment declines all point to serious program-integrity problems.
The overall level of subsidization is particularly striking. In 2025, federal taxpayers financed 86 percent of premium revenue collected by insurers in HealthCare.gov states, up from roughly 77 percent before the pandemic. Even after the enhanced subsidies expired, most enrollees remain eligible for subsidies that cover the overwhelming share of their premiums. Meanwhile, ACA premiums have increased much faster than those for employer coverage, even as ACA plans generally have higher deductibles and narrower provider networks. The ACA exchanges increasingly resemble a government-financed coverage program rather than a competitive insurance market in which consumers bear a meaningful share of the cost. As the 2027 open enrollment period begins, policymakers should focus not simply on how many people enroll, but on whether coverage provides value, whether subsidies are properly targeted, and whether taxpayers are financing coverage for real and legally eligible people.
Footnotes
1↑ Brian Blase, Casey Mulligan, and Phil Kerpen, "The Falsehoods of Obamacare: A Dozen Broken Promises, Seven Million Canceled Plans, and Hundreds of Billions in Debt," Paragon Health Institute, October 2024, https://paragoninstitute.org/private-health/the-falsehoods-of-obamacare-a-dozen-broken-promises-seven-million-canceled-plans-and-hundreds-of-billion-in-debt/
2↑ The standard deviation measures how much benchmark premiums typically differ from the average benchmark premium across states. The coefficient of variation is the standard deviation divided by that average, expressed as a percentage. Because the coefficient of variation is a unitless measure that captures dispersion in the data relative to the average premium, it is useful for comparing how widely premiums vary across states in years when premium levels differ substantially.
3↑ Matt McGough et al., "What We Know So Far About 2026 ACA Marketplace Enrollment, Premiums, and Deductibles," KFF, May 19, 2026, https://www.kff.org/affordable-care-act/what-we-know-so-far-about-2026-aca-marketplace-enrollment-premiums-and-deductibles/
4↑ Brian Blase and John R. Graham, "Problems with ACA Subsidies Compounded by COVID Credits: Unfair to Americans with Employer-Based Insurance, Punish Work, and Incentivize Employers to Drop Coverage," Paragon Health Institute, November 2025, https://paragoninstitute.org/private-health/problems-with-aca-subsidies-compounded-by-covid-credits-unfair-to-americans-with-employer-based-insurance-punish-work-and-incentivize-employers-to-drop-coverage/
5↑ U.S. House of Representatives v. Burwell, 185 F. Supp. 3d 165 (D.D.C. 2016).
6↑ Daniel Cruz and Greg Fann, "It's Not Just the Prices: ACA Plans Have Declined in Quality Over the Past Decade," Paragon Health Institute, September 2024, https://paragoninstitute.org/private-health/its-not-just-the-prices-aca-plans-have-declined-in-quality-over-the-past-decade/
7↑ John A. Graves et al., "Breadth and Exclusivity of Hospital and Physician Networks in US Insurance Markets," JAMA Network Open 3, no. 12 (December 2020): e2029419, https://doi.org/10.1001/jamanetworkopen.2020.29419
8↑ Matthew Rae et al., "How Narrow or Broad Are ACA Marketplace Physician Networks?," KFF, August 26, 2024, https://www.kff.org/private-insurance/how-narrow-or-broad-are-aca-marketplace-physician-networks/
9↑ Rae et al., "How Narrow or Broad Are ACA Marketplace Physician Networks?"
10↑ Centers for Medicare & Medicaid Services, "Health Insurance Exchanges 2026 Open Enrollment Report," March 27, 2026, https://www.cms.gov/files/document/health-insurance-exchanges-2026-open-enrollment-report.pdf
11↑ Brian Blase et al., "The Greater Obamacare Enrollment Fraud," Paragon Health Institute, June 2025, https://paragoninstitute.org/private-health/the-greater-obamacare-enrollment-fraud/; Brian Blase and Drew Gonshorowski, "The Great Obamacare Enrollment Fraud," Paragon Health Institute, June 2024, https://paragoninstitute.org/private-health/the-great-obamacare-enrollment-fraud/
12↑ Centers for Medicare & Medicaid Services, "Enrollees Without Claims 2019?2024," August 8, 2025, https://www.cms.gov/marketplace/resources/forms-reports-other
Author


Acknowledgements
The authors are grateful to John R. Graham, Niklas Kleinworth, Liam Sigaud, and the Paragon team for their exceptional comments and work in review of the paper.