

Reforming Government. Empowering Patients.
Navigation
It’s Not Just the Prices
ACA Plans Have Declined in Quality Over the Past Decade

The Paper
Executive Summary
What We Did
This paper examines the value of individual market health insurance products in the Affordable Care Act (ACA) exchange from 2014 to 2023 and compares the value of these products to the larger employer-sponsored insurance (ESI) group market.
What We Found
While there are many features of health insurance products that consumers may consider when assessing value, this paper identifies three characteristics that define value and influence participation in products: the availability of provider networks with generous benefits, the cost-sharing structure that divides financial responsibility between insurance companies and enrollees, and the cost of premiums. The paper explores how the value of health insurance products declined across these characteristics and resulted in the ACA exchange offering lower quality plans over time when compared to ESI. The following points illustrate notable weaknesses in value across the three characteristics.
- Provider networks: The percentage of individual market consumers enrolled in plans with broad provider networks declined from 36 percent to 11 percent between 2014 and 2023. An increasing share of individual market enrollees are in Medicaid-managed-care-like plans.
- Cost-sharing: As overall premiums have risen, middle-income exchange enrollees with incomes above 200 percent of the federal poverty level were much more likely to choose a bronze plan in 2023 (54 percent) than they were a decade ago (33 percent).
- Premiums: Individual market premiums have increased more rapidly —50 percent more—than employer plan premiums over the past decade.
We attribute these decreases in the value of ACA plans to structural features of the ACA individual market framework. In particular, the ACA insurance rules caused premiums to increase and led insurers to offer narrower and more restrictive networks over time. The design of the ACA premium tax credits has also incentivized enrollees to select lower-quality plans. In addition, the ACA risk adjustment program is overcompensating insurers for lower-income enrollees who enroll in silver plans, causing significant price competition for these plans and a race to the bottom in plan quality. Lastly, a variance in state enforcement of ACA rating rules further distorts and complicates plan offerings and consumer selections.
What We Recommend
Recognition of the poor and declining consumer value of insurance options is a prerequisite to implementing changes that improve value for individual health insurance market consumers. The following recommendations would improve the individual market without adding to the cost of the program:
- Improve the accuracy of the ACA risk adjustment program by adding income-based risk factors.
- Congressionally appropriate cost-sharing reduction subsidies and require insurers to set prices for metal tiers based on actuarial value.
- Expand employers’ ability to offer individual coverage health reimbursement arrangements.
Why This Matters
While the ACA has resulted in lower quality product offerings to date, this should not be considered an inherent feature of a federally regulated health insurance framework but instead as a natural consequence of the current blend of the ACA regulatory environment, the premium subsidy structure, flaws with the risk adjustment program, and uneven regulatory enforcement. In all health insurance markets, there is some incentive to buy less generous coverage and save on premiums while absorbing higher cost-sharing exposure, but this incentive is uniquely strong in the individual ACA market with premiums proportionally inflated for all plans with flat-dollar subsidies. The proposed opportunities for reform will create a better-functioning individual market with stronger offerings to consumers and more efficient government subsidies.
Introduction
Like other forms of insurance, health insurance is in part a financial services product, one that allows individuals to reduce the cost of unforeseen sickness and accidents by paying premiums to insurance companies to cover a large portion of this risk.1 In general terms, the value of insurance products is reflective of the benefits provided relative to the underlying cost.
A value assessment of health insurance products is perhaps more complicated than other insurance protection: It has more layers than risk mitigation financial transactions and is based on the unique subjective needs and often personal desires of individuals and families procuring health coverage.2 While there are many features of health insurance products that consumers may factor in when determining value, three familiar characteristics3 influence decisions to purchase health insurance and the selection of products and plan designs. These three features are easily understood through the following questions:
- Provider networks: Which doctors and hospitals are covered with the most generous benefits?
- Cost-sharing structure: How is financial responsibility for medical services split between insurance companies and enrollees?
- Premiums: How much does the insurance product cost?
The provider network and cost-sharing structure of health insurance products directly impact the resulting premiums. Some medical providers are generally willing to agree to lower in-network payment rates if provider networks are narrow and insurance consumers are steered to their facilities or offices. Conversely, access to a broad network of medical providers generally involves higher payment rates for medical services and accordingly higher insurance premiums. Richer benefit designs that lower cost sharing for consumers (e.g., low deductibles and copays) also result in higher premiums. Higher premiums are not necessarily unattractive or indicative of poor value, as they may be the direct result of richer benefits and broader networks, both of which are key factors when consumers assess value. The overall value of health insurance products is best summarized by an assessment of medical providers in the products’ network, the benefits provided net of cost sharing and the premium cost.
This paper examines the value of individual market health insurance products in the first 10 years (2014-2023) of the Affordable Care Act (ACA)4 exchanges. It then compares the ACA value to the much larger employer-sponsored insurance (ESI) group market and concludes by offering insights into what changes could be made to improve the value of individual health insurance products offered in the current regulatory environment.
The major findings of this research include the following:
- The ACA regulatory framework and related stakeholder responses have led to predominantly lower quality benefit options and plan selections than those available to individual health insurance market consumers.
- The value of ACA individual market product selection has diminished over time.
- From 2014 to 2023, the percentage of individual market consumers enrolled in broader network products declined from 36 percent to 11 percent.
- In 2014, 33 percent of individual market middle-income consumers—those not receiving cost-sharing reduction (CSR5) benefits—were enrolled in the lowest metal tier (bronze) compared to 54 percent of consumers in 2023.
- From 2014 to 2023, the average unsubsidized premium has increased by 62 percent compared to 40 percent for ESI coverage.
- Multiple structural items of the ACA individual market regulatory framework have contributed to this dynamic.
- The ACA imposed regulations on the individual market that increased insurance premiums broadly. This has made it more difficult for plans to offer coverage options at prices consumers perceive to be of high value, a dynamic that is exacerbated for more generous plans.
- Premium tax credits (PTCs) that assist certain enrollees to purchase coverage are calculated as a fixed-dollar-amount voucher, the amount of which is calculated from a specific benchmark plan (second-lowest-cost silver) premium. This creates an economic incentive for subsidized enrollees to select plans that are of equal or lower price than the benchmark plan. The enhanced subsidies under the American Rescue Plan Act (ARPA) and the Inflation Reduction Act (IRA) have increased the impact of this dynamic, as more enrollees are impacted by the PTC subsidy structure.
- The risk adjustment program has significantly overcompensated insurers for price-sensitive consumers earning less than 200 percent of the federal poverty level (FPL). These enrollees are incentivized to select lower-cost silver plans.
- Varying focus and levels of state enforcement of ACA rating rules have further complicated and distorted plan offerings and consumer selections.
While the ACA has resulted in lower quality product offerings to date, this should not be considered an inherent feature of a federally regulated health insurance framework but instead as a natural consequence of the current blend of the ACA regulatory environment, the premium subsidy structure, flaws with the risk adjustment program, and uneven regulatory enforcement. The following recommendations would improve plan quality without adding to the cost of the overall program:
- Improve the accuracy of the risk adjustment program by adding income-based risk factors.
- Appropriate CSRs and enforce single-risk-pool rules, which would end “silver-loading,” align premiums with coverage generosity, and incentivize carriers to offer better value products.
- Expand employers’ ability to offer individual coverage health reimbursement arrangements (ICHRAs), which would improve the risk pool6 and encourage better product offerings from carriers.
PROVIDER NETWORK OFFERINGS AND SELECTIONS
The ACA largely standardized the benefits offered by health insurers so that consumers’ selection of covered services (e.g., maternity) is rarely a distinguishing factor in plan selection.7 ACA product features are generally a twofold consideration: which providers are covered and at what cost-sharing level.
Network Breadth
Access to providers through an insurance contract is dictated by the network that is offered. Broadly speaking, the generosity of networks can be measured in terms of type and breadth. The type of network ranges from a health maintenance organization (HMO), which is generally more restrictive in terms of which providers are covered, to a preferred provider organization (PPO), which allows access to all providers but incentivizes using the preferred in-network providers. The breadth of the network is usually differentiated between the number of physicians or medical groups that are in-network but also by which facilities are included.
Figure 1 maps the market share by type of network from 2014 to 2023,8 illustrating that individual market enrollment has shifted toward plans that include fewer providers and facilities in their networks. In 2014, 50 percent of individual market consumers were in PPO and point-of-service (POS) plans. By 2023, that percentage had declined to 17 percent. In 2023, 83 percent of enrollees were in HMOs or exclusive provider organizations (EPOs).

The difference between types of health plans (carriers) is not as obvious as the network type differentials, but it can be equally important in terms of the value consumers receive from health plans. As background, most Americans in the private health insurance market receive ESI. The framers of the ACA intended to not disrupt the relatively well-functioning employer market, which provides coverage to approximately 160 million Americans. ESI is therefore a meaningful benchmark to determine which health plans are considered standard or high quality in each state.
Health Plan Offerings
In this paper we categorize Blue Cross Blue Shield plans (Blues); national carriers (United, Cigna, Aetna, Humana, and Kaiser); and large regional health plans with more than 10 percent market share in the employer fully insured markets as more generous health plan offerings. Less generous health plan offerings include health plans that primarily operate as Medicaid-managed care organizations (MCOs, such as Molina, Centene, CareSource, etc.) and other small regional health plans that do not have a significant presence in ESI. Blues and other typical ESI plans generally offer broader networks9 with higher-quality participating providers, and Medicaid MCO plans offer narrower networks. The individual market plans offered by the Blues, however, often have narrower networks than Blues employer-sponsored health plans do.
Figure 2 shows that 58 percent of individual market consumers were in Blues products in 2014. In 2023, this percentage had fallen to 36 percent. About 42 percent of individual market consumers are in Medicaid MCO-like plans or other small health insurer plans that are not typically sold in the employer market—up from 25 percent in 2014. The share of other types of plans has stayed relatively constant.

To assess the value of product offerings in the ACA markets as selected by consumers, we categorized network type and health plan type combinations into three levels of generosity. Table 1 displays these categorizations, followed by Figure 3, which shows the percentage of consumers in each generosity category from 2014 to 2023. In 2014, 36 percent of consumers were in high generosity products, and 18 percent were in low generosity products. By 2023, only 11 percent of individual market consumers were in high generosity products, and 38 percent were now in low generosity products. In both years, about half of consumers were in mid-generosity products.


Comparison to Group Market10
The ESI market has a much greater percentage of members enrolled in PPO plans than the individual market does. Table 2 displays an estimated market share comparison between plan types in the ACA individual market and the employer market for 2023.

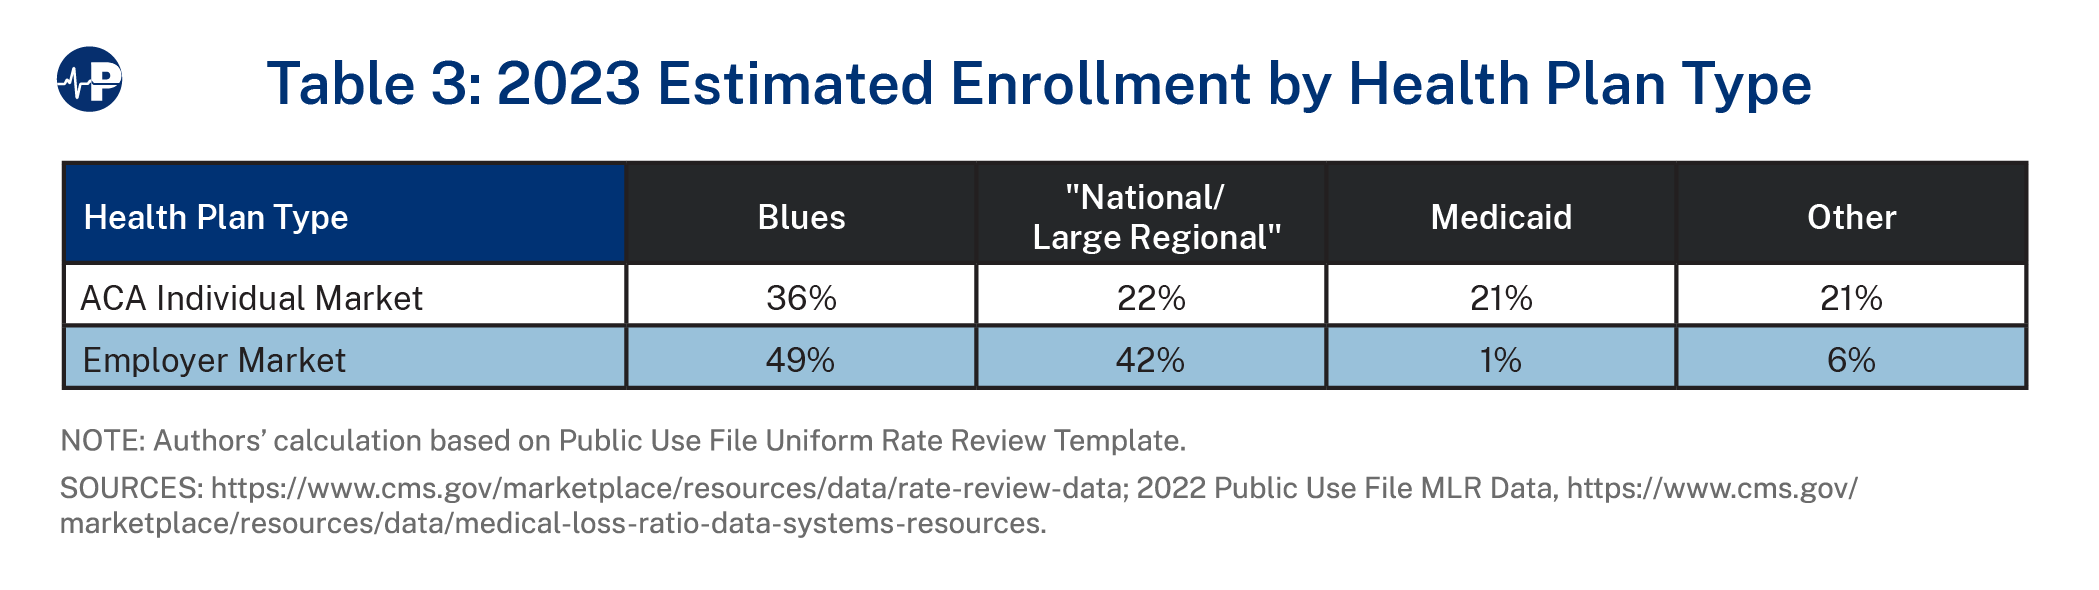
As shown in Table 3,11 the employer market also has a much greater percentage of members enrolled in Blues, national, or large regional health plans (91 percent) than the individual market does (58 percent).
COST-SHARING STRUCTURE
The second area of value assessment is consumer-selected plan design. This is often categorized by “metal level” signifying the actuarial value (AV) of the product—that is, the expected average percentage of claims that will be covered by a plan given its cost-sharing parameters (generally, deductible, coinsurance, and copayments). The ACA architects had sought to create a transparent and standardized approach to characterize benefit value across different plan designs by placing plan designs into metal levels, with bronze plans having the lowest AV (60 percent), followed by silver (70 percent), gold (80 percent), and platinum (90 percent).
Figure 4 displays the selection of metal tiers by non-CSR consumers over time. CSR enrollees were removed from this comparison as they are not price sensitive between metal level premiums as they must choose silver plans to receive CSR benefits. After 2017, bronze plans have been by far the most common plan chosen by these enrollees. The percentage of silver plan enrollees has decreased dramatically on a nationwide basis, while state variances are notable and discussed later in this paper.

Comparison to Group Market
In the employer market, 84 percent of employees have single-coverage deductibles that are less than $3,000,12 while 54 percent of non-CSR enrollees in the individual market are enrolled in bronze plans, which typically have single-coverage deductibles higher than $6,000. Including CSR enrollees, the average AV in the ACA individual market in 2023 is estimated to be 77 percent, compared to 85 percent for ESI.13 For non-CSR enrollees, the average AV in the individual market is much lower at 67 percent.
The last component of value assessment is the cost as measured in gross premiums. The average lowest-cost gross premiums nationwide by metal level are displayed in Figure 5. From 2014 to 2017, bronze and gold premiums increased at a higher rate than silver premiums as carriers reflected metal-level experience in premium rates and premium relationships deviated from coverage generosity. The defunding of CSRs in 2018 was expected to raise silver premiums above gold premiums, but significant silver plan price competition targeting CSR enrollees has kept gold plans priced relatively higher than silver in most states.14 In 2024, gold premiums are on average 104 percent of silver premiums.

Figure 6 shows the changes in the silver-to-bronze premium ratio and the gold-to-silver premium ratio over time. Specifically, it shows the impact of premium misalignment, which led to gold plans being priced much higher than silver plans and the gap between silver plan premiums and bronze plan premiums narrowing in 2017. It also shows the impact of “silver loading”15 in response to CSR defunding, which led to silver plans being priced much higher than bronze plans and the gap between gold plan premiums and silver plan premiums narrowing after 2017.

Figure 7 shows the average nationwide net premium (including subsidies) for a 40-year-old enrollee at 300 percent FPL. Because net premiums are largely a factor of the subsidy structure that caps enrollee contributions as a percentage of household income, these are relatively stable over time. The major changes witnessed from 2017 to 2018 and from 2021 to 2022 resulted from two distinct policy changes. The first was the decision to end CSR payments in 2017 and the natural response of insurers to “load” silver premiums to reflect the higher plan costs, which decreased the relative cost of bronze and gold plan premiums in 2018. The second was the change under ARPA (P.L. 117-2) that increased the PTCs by decreasing the percentage of income enrollees must pay in premiums.

Comparison to Group Market
The individual market has experienced drastic fluctuations in premium changes—first large rate increases from 2014 to 2018 then price reductions from 2019 to 2022—compared to relatively stable price increases for ESI. Not only did the decision to follow the law and cease making CSR payments boost subsidies, but the Trump administration pursued policies to reduce abuse of special enrollment periods and limit adverse selection. The early years of the ACA individual market were marked by significant under-pricing as enrollees had much more expensive medical conditions than expected. This initial under-pricing—plus insurers’ response to CSR defunding, the end of the risk corridor and reinsurance programs in 2017, and the potential elimination of the individual mandate penalty—resulted in extremely large rate increases from 2016 to 2018. Due in large part to a misunderstanding of the risk pool implications of President Trump’s administrative actions, premiums in 2018 reached excessive levels, with individual market plans characterized by relatively low medical loss ratios.16 After peaking in 2018, premiums steadily decreased through 2022. While 2014-2022 can be characterized by periods of mispricing and rate corrections, the ACA individual market has arrived at a period of stability. The risk pool is more balanced, with the dynamics of a market increasingly characterized by large subsidies.
Figure 8 shows the average lowest-cost gold premiums in the ACA individual market for a 40-year-old compared to the average ESI premiums for single coverage normalized for age, AV, and network offering. ESI premiums were taken from the 2023 KFF Employer Health Benefits Survey.17 Normalization assumed that the ESI premiums reflected an average age of 42 and an average AV of 85 percent.18 The lowest-cost ACA gold individual market plan is assumed to be a narrow network HMO plan, while HMO networks account for only 13 percent of ESI enrollment. To adjust for this, we discounted ESI premiums by a factor of 0.93 to go from average network offerings to average HMO offerings and applied an additional 0.90 factor to account for more narrow HMO offerings in the ACA versus broader HMO offerings in ESI coverage. While this normalization is an approximation that cannot fully create an equal comparison, it is a reasonable estimation of relative costs between markets that signifies that ACA individual market premiums are increasingly competitive relative to ESI premiums.

As shown in Figure 8, the lowest-cost individual market gold plan was significantly more expensive than ESI in 2017 and 2018, but from 2018 to 2022 gold plan premiums declined and in 2022 were priced below ESI plans. The presence of Medicaid-focused plans with lower provider reimbursements, the improved risk pool resulting from President Trump’s policy actions, and the growth in low-income enrollees with low utilization levels19 likely contribute to this new market dynamic. The relatively lower premiums in the individual market, as illustrated in Figure 8, demonstrate the increasing financial incentive for employers to achieve health care savings by shifting from defined benefit ESI plans to defined contribution arrangements through ICHRAs, which we will explore below.
STRUCTURAL ELEMENTS DRIVING DIMINISHING VALUE IN THE ACA MARKET
Over the past decade, the relative generosity of ACA plan selections has gone down, while ACA plan premiums have increased on average at a higher rate than ESI coverage has. By these primary measures, the value of ACA plans has declined.
This section highlights the structural elements driving this diminishing value of ACA options.
Regulatory Impact on Premiums
Starting in 2014, the ACA imposed major regulatory reforms on the individual market, most notably:
- guaranteed issue (insurers must offer coverage to all applicants during open enrollment),
- modified community rating (insurers cannot charge sicker applicants more than healthy applicants), and
- essential health benefit requirements.
The changes were rightly expected to significantly increase premiums. This was meant to be mitigated for certain segments of the population by subsidies in the law—the PTC and the CSR program—and with a tax penalty assessed on individuals designed to compel relatively healthy people to purchase coverage.
The Department of Health and Human Services (HHS) found that average gross premiums (not including subsidies) from 2013 to 2017 increased by 105 percent in the 39 states participating in the federally facilitated health insurance exchange.20 Another study found that even average annual net premiums increased by 12.1 percent when adjusting for inflation and counting the offsetting subsidies for eligible populations.21
In addition to the three aforementioned regulatory changes, the ACA imposed a “single risk pool,” which requires that premium differences among varying benefit designs reflect only the difference in benefits and not the specific characteristics, health status, or anticipated claims experience of enrollees who have selected particular plan designs or metal levels. Said another way, premium differentials among metal tiers should be proportionate to the differences in AV, and any price differences among network offerings should reflect only network contractual differentials and care management differences.
Because the ACA’s regulatory changes have resulted in premium increases across the board, the relative cost of more generous plans has increased even faster in absolute dollars, making the more generous plans less valuable to enrollees.
Consider a hypothetical enrollee who does not receive a subsidy, as illustrated in Table 4. In this example, premiums increase by 100 percent, roughly the increase in premiums HHS documented from 2013 to 2017. After the implementation of the ACA, the consumer would have to pay 33 percent more for the less generous plan than he would have paid previously for the more generous plan. On top of this, the price the consumer must pay to upgrade to the more generous plan (referred to in Table 4 as the “upgrade charge”) has also increased. Before the ACA premium regulations, the upgrade charge represented the additional value the customer perceived from the more generous plan. Therefore, after the implementation of the ACA, this customer would be forced to pay twice as much as the additional value he perceives from it.

Observed preferences of consumers in health insurance markets show that premiums are the strongest driver of plan selections, followed by other factors such as cost sharing and provider network breadth. It should therefore come as no surprise that these premium increases would lead to a higher percentage of consumers choosing less generous plans or perhaps forgoing coverage altogether.
ACA SUBSIDY STRUCTURE
Taxpayer-funded subsidies for insurance are meant to mitigate the impact of higher premiums in the ACA regulatory environment for lower- and lower-middle-income enrollees, yet the design of those subsidies reinforces the diminishing plan quality.
Premium Tax Credit (PTC)
For exchange enrollees in households with income between 138 and 400 percent FPL (100-400 percent FPL in states that did not adopt the ACA’s Medicaid expansion),22 the impact of any premium increase is mitigated by a cap on the amount those enrollees must contribute toward the premium of a benchmark plan. This benchmark plan is the second lowest-cost silver plan (70 percent AV) in a rating region. The difference between the cost of the benchmark plan and the cap on the contribution is sent from the federal government to the insurer offering the plan selected by the enrollee. If a PTC-eligible enrollee picks a plan with a premium higher than that benchmark plan, the cost of the upgrade is borne by the enrollee instead of the taxpayer.
Table 5 illustrates the same scenario of premium increases as discussed in Table 4 but with a potential enrollee who is eligible for a subsidy. The PTC actually decreases the price of the less generous plan relative to the pre-ACA environment. However, because the subsidy is tied to a less generous plan, the net impact of the ACA is to increase the relative cost of a more generous plan—even for people who receive subsidies.

Because lower-income consumers are particularly price sensitive—and even more so in this elevated premium environment—there is a very large incentive for plans to be at the benchmark premium or lower. There is no consideration of the generosity of networks in the benchmark calculation, which makes plans highly incentivized to offer silver plans with as restrictive networks as possible. This increases the likelihood that the benchmark plan will have a narrow network. While some silver plans may have broader networks, this competitive structure makes it unlikely that a broader network plan will serve as a benchmark plan for a region.
Increasing Share of Enrollment Is Reliant on Subsidies
The subsidy structure might have a limited impact on plan offerings if there were a robust market for unsubsidized customers, but the elevated premium environment has made almost everyone purchasing plans in the individual market reliant on the PTC. As noted in our previous paper, “Shortcomings of the ACA Exchanges,” a growing portion of enrollment in the individual market relies on subsidies.23 In 2013, before the implementation of the major ACA reforms, the individual market was completely unsubsidized. As illustrated in Table 6, upon implementation of the ACA, 57 percent of ACA individual market enrollees were receiving subsidies in the first year (although many individual market enrollees did not have ACA coverage that first year as they had noncompliant plans). In 2020—the last full year before more Americans became eligible due to the lifting of the income cap—72 percent were receiving subsidies.

There are multiple reasons for increased reliance on subsidies. One is that the increase in premiums over time relative to income has effectively made more people eligible because there is a greater chance the benchmark premium amount will exceed the amount of income a person must contribute. Second, as the cost of coverage increases irrespective of the additional value that plans offer to prospective enrollees, fewer people ineligible for subsidies are willing to pay their own money to sign up for coverage. Finally, policy changes such as the ARPA and IRA subsidy expansion have increased the number of people eligible for subsidies and made zero-premium plans available. These plans induce enrollment even from people who perceive that they will receive virtually no benefit from the coverage. Regardless of the specific reasons, more people becoming dependent on PTCs also drive more people to buy the benchmark plan or lower.
RISK ADJUSTMENT PROGRAM
The ACA’s risk adjustment program is intended to make plans indifferent to the health status of their enrollees by compensating plans for enrollees with higher predicted medical risk with transfers from enrollees with lower predicted medical risk.24 In essence, risk adjustment is a zero-sum payment mechanism intended to transfer money from plans with healthier enrollees to plans with sicker enrollees.
Due to the zero-sum nature of the program, carriers are incentivized to alter premiums and product offerings to target populations that are favored by the risk adjustment program. As shown by the Centers for Medicare and Medicaid Services (CMS), the risk adjustment program currently significantly overcompensates (by close to 30 percent)25 for consumers earning less than 200 percent FPL, rendering those enrollees predictably more profitable for health insurers.26 CMS’s risk adjustment formula currently rewards carriers for insuring these enrollees through a consistent presumption of higher-than-actual utilization. In 2023, the CSR population making under 200 percent FPL accounted for more than 50 percent of all federal exchange consumers. The combination of the significant overcompensation from the risk adjustment program and the large proportion of enrollees being overcompensated makes the risk adjustment program bias a primary reason for the declining value of ACA individual market product offerings.
The decline in product offerings is due to the subsidy dynamics of the ACA. The CSR program entitles enrollees between 100 percent and 200 percent FPL to much lower cost sharing if they enroll in silver plans,27 as they receive access to platinum-level benefits coverage through silver plans with generous CSR benefits. Due to their lower incomes, these consumers are often the most price-sensitive. Because they are a significant portion of the market and the risk adjustment program makes them disproportionately profitable, plans covet these enrollees. This dynamic has further incentivized insurers to offer lower-priced, narrow network plans and has led to carriers “aggressively under-pricing” silver plans—and consequently overpricing other plans, rendering them unattractive.28
Added Complication of CSR Defunding
In October 2017, the Trump administration stopped compensating insurers for providing cost-sharing reductions through the CSR program, citing the fact that Congress never appropriated funds for this purpose and that two federal courts ruled that there was not a valid appropriation for the CSR program. However, the absence of a congressional appropriation did not eliminate insurers’ legal obligation to provide lower cost-sharing to eligible enrollees. In response to CSR defunding, most states allowed or directed health insurers to increase silver plan premiums to cover the CSR expense under the legal theory that in the absence of specific appropriation to cover the CSR expenses, those expenses now reflect a higher AV.
With CSRs defunded, silver premiums now reflect platinum-level benefits for the CSR population between 100 percent and 200 percent FPL. On average, 91 percent of on-exchange silver enrollees are CSR eligible with platinum benefits (i.e., enrollees with income below 200 percent FPL), leaving 9 percent having traditional silver-level benefits. This mix results in the average AV equaling 88 percent (91 percent of enrollees x 90 percent AV + 9 percent of enrollees x 70 percent AV). If premiums reflected the ACA single-risk-pool rules and actuarial principles, then gold premiums (80 percent AV) would be lower than silver premiums (88 percent AV).
Reality has been more complicated. Since 2018 there has been a trend of states that have gold premiums below silver premiums.29 However, the aforementioned risk adjustment imbalance has created incentives for carriers to underprice silver plans and overprice gold plans to attract CSR-eligible enrollees for which they receive excessive risk adjustment payments. For instance, before CSR defunding, gold plans were, on average, 32 percent more expensive than silver. (A 20 percent price differential would have been more in line with actuarial principles.) This overpricing of gold plans varied by state, with some states having very large premium differentials between silver and gold plans and gold premiums remaining higher than silver premiums in most states even after “silver-loading.”
Notably, the bifurcation of states that have gold premiums below silver premiums highlights how price-sensitive consumers are in the individual market. For enrollees who do not have CSR benefits,30 Figure 9 shows enrollees’ selection difference between states where gold premiums are lower than silver premiums and states where the reverse is true. In states where gold premiums are below silver premiums, 43 percent of enrollees select gold plans compared to 13 percent in other states.

Figure 10 shows a full breakdown of states, the relationship between gold-to-silver-premium ratios, and the percentage of non-CSR enrollees who selected gold plans. Figure 10 clearly shows that far fewer enrollees select gold plans in states where gold plan premiums are above silver plan premiums. The percentage of enrollees selecting gold plans is unsurprisingly high in New Mexico, Texas, and Wyoming because of following single-risk-pool guidelines.31

Opportunities for Improvement
Many prominent proposals to improve the quality of plans available in the individual market have been narrowly aimed at increasing subsidy levels at additional costs to federal taxpayers. An example is S. 8, introduced by Senator Jeanne Shaheen (D-NH), which would simply change the subsidy benchmark to a gold level from the present silver level and increase the generosity of and eligibility for the CSR program. Then-candidate Joe Biden similarly endorsed using a gold-level benchmark for the PTC during his presidential campaign.32 Such an approach would substantially increase federal spending while not fixing the many root causes that lead to the proliferation of low-value plans.33
There are more targeted and efficient ways to improve plan value.
Improving Risk Adjustment Accuracy
To improve product market offerings, it is necessary to reorient the incentives and improve the equity of the federal risk adjustment program. Right now,34 risk adjustment favors the insurers that attract enrollees who receive CSR benefits. These consumers accounted for more than 40 percent of 2023 ACA enrollment (and nearly 50 percent of enrollment in 2024).35 This dynamic leads to overpricing of non-silver products, because risk adjustment results in unjustified transfers from those plans or simply carriers not offering these products so that they can better compete for the profitable enrollment segment. We have two suggestions to improve risk adjustment:
- Create income-based factors to account for the lower utilization of health care services by lower-income individuals.36 For the risk adjustment program to achieve its intended goal, its methodology must capture cost differences among plans that are not reflected in allowable rating factors. The current methodology captures only demographic information (such as age and sex) and recorded health conditions.
- Treat CSR enrollees as platinum enrollees rather than silver enrollees by running their experience through the platinum condition factors and platinum premium factors of the risk adjustment program. This would better reflect plan liability as the platinum AV (90 percent) is closer than the silver AV (70 percent) to the AV of plan variants (87 percent and 94 percent) chosen by CSR enrollees. CMS intended to propose this change in 201737 but never implemented it (although CMS revisited it in 2021).38
Funding CSRs and Enforcing the Single Risk Pool
The defunding of CSRs produced several adverse policy results. First, it led to silver loading, which significantly increased silver-level premiums for people who do not qualify for the PTC to purchase coverage.39 Second, ICHRA affordability is linked to the lowest-cost silver plan, silver loading has made it more difficult for employers to offer affordable coverage. Second, and more consequentially, silver loading led to much higher PTCs than Congress intended, because the PTCs limit the amount of household income an individual must pay for a benchmark plan. In essence, CSR defunding turned the ACA from a program with two distinct subsidies—one to limit premium payments for enrollees below 400 percent FPL and one for significantly reducing cost sharing for enrollees below 200 percent FPL—into a program with an oversized premium subsidy to cover much more expensive premiums.
CSR defunding has also led to a situation where the average AV of silver plans significantly exceeds the AV of gold plans—a further distortion40 in the market.41 In some states that have enforced the single risk pool (requiring that premiums reflect AVs), gold plan premiums are now priced below silver plan premiums, as one would expect given the response of insurers to “load” the additional plan liability of CSRs onto silver plans. While this has effectively made more generous gold-level plans more affordable for PTC-eligible enrollees, it has also substantially increased federal spending and badly distorts the value proposition for those without subsidy eligibility who in effect no longer have access to appropriately priced on-exchange silver-level plans.
To improve the efficiency of the ACA, significantly reduce premiums, and eliminate unnecessary confusion related to rating practices,42 Congress should appropriate CSRs and enforce the single-risk-pool requirement. Appropriating CSRs would mean that the cost-sharing assistance is more directly targeted to those most in need. The silver plan premiums would decline as insurers would no longer need higher PTCs to offset the cost of their CSR obligations or offset the higher costs of misaligned premiums if the single-risk-pool requirement is enforced.43 The lower-cost silver plans would restore these plans as viable options for unsubsidized enrollees, give employers greater opportunities to offer affordable ICHRAs and lower overall subsidization of the market. Moreover, it would help end the regulatory confusion44 that currently exists across states with respect to enforcement of the single-risk pool requirement, encouraging the normalization of plan offerings across the country.
The Potential of ICHRAs
With the enhanced subsidies, the individual market now has more than 20 million enrollees. The ESI market remains about eight times larger. As more employers turn to reducing costs and getting out of managing health care decisions for their employees, ICHRAs—where employers give defined amounts to their employees to shop for individual market coverage—have the potential to be market-changing. The issues described in this paper, particularly the lack of PPO plans and the risk adjustment challenges, present significant barriers to the ICHRA-defined contribution model being adopted by employers.
Improving risk adjustment and eliminating disincentives to offer product and plan offerings at reasonable prices would be more attractive for both employers and carriers. From the carrier perspective, profit margins tend to be higher in the individual market given the lower minimum loss ratio requirements, lower commission levels due to the exchanges, and increasingly stable risk pools.45 The risk pools would be further stabilized if more employers funded defined contribution models.
ICHRAs should be particularly attractive to small and medium-sized businesses. The individual market has lower premiums than the ACA small group market in many geographic areas. This is true in part because the product quality (in terms of the health plan type and network type offerings) is worse in the individual market than in the small group market. However, the risk pools have stabilized in the individual market—in large part because of an over subsidization of plan premiums that have led many people who receive low value from the plans and expect low medical claims to enroll—and premiums in most of the country are now favorable relative to the small group market.
In 28 states, individual market normalized average premiums46 are cheaper than in the small group market. These 28 states account for 76 percent of individual market nationwide enrollment as seen in Table 7. In most of the country, individual market premiums are thus lower than small group premiums largely because they have tighter provider networks that pay providers less. In blue states, individual market premiums are lower than small group premiums—and at least 20 percent lower in dark blue states. In orange states, individual market premiums exceed small group premiums. The trend of individual market premiums becoming increasingly competitive in comparison to the small group market can be seen in Figure 11—which shows 28 favorable states as of 2022—compared to Figure 12, which shows only 11 favorable states in 2018.


This trend will likely continue as small and mid-size employers begin to realize and take advantage of increasingly price-competitive products on the individual market. Employers are increasingly adopting ICHRAs,47 which will result in more employees in the individual market, likely improving the risk pool and creating a virtuous cycle of downward pressure on premiums attracting even more low-risk employer groups. This should begin to influence the type of products offered on the exchanges, as insurers cater to the preferences of a larger population whose expectations are for options that resemble ESI and have preferences that are not distorted by the structure of the PTC.
Conclusion
The regulatory dynamics of the ACA brought changes to the three primary components of value in individual health insurance markets: It lessened the number of providers in networks, increased premium amounts, and increased cost-sharing amounts. All these effects lowered the value of plan offerings. Large subsidies for many enrollees, however, have mitigated the premium and cost-sharing increases, and nearly half of exchange enrollees now qualify for plans with zero out-of-pocket premiums and very low amounts of cost-sharing. As we found in our previous work, the ACA did not meaningfully increase the number of Americans with private health insurance48 but rather impacted financial incentives and changed the characteristics of the U.S. population that was insured. With the background knowledge of minimal coverage impact, the intent of this paper was not to compare pre-ACA and ACA insurance coverage levels but to assess the consumer value of ACA coverage over time and relative to traditional insurance products.
In the ACA regulatory environment, insurers must charge most consumers more than actuarially fair premiums prior to offsetting subsidies. This necessitates a similar inflation in the price differential between products of lower and higher generosity.
Recognition of the poor and declining consumer value is a prerequisite to implementing changes that would improve the value proposition of individual health insurance market consumers—either within the ACA environment or under a more efficient regulatory structure.49 Improving the risk adjustment methodology, appropriating CSRs, enforcing the ACA’s single-risk-pool guidelines, and building on ICHRAs would amount to a much more efficient approach to improving the individual market than perpetuating the expanded PTCs50 contained in the IRA. As promoted, the expanded PTCs in the IRA were an extension of a temporary change to respond to the COVID-19 pandemic, not a long-term policy solution for any identified problem. ACA-related policy prescriptions involving taxpayer-funded subsidies should reflect solutions to identified market problems, not seemingly convenient carryovers of a temporary response to a pandemic. Recognition of a robust value assessment of ACA markets, coupled with more strategic policymaking, would better serve health care consumers while providing better value for taxpayers.
Footnotes
1↑ Another significant component of health insurance is prepayment—with tax-preferred dollars—of medical expenses.
2↑ As other forms of insurance are sometimes tangentially used for non-insurance purposes (e.g., life insurance for tax-deferred investing), health insurance is often used to prepay health care expenses with pre-tax dollars.
3↑ Covered benefits are another health insurance value feature. It is outside the scope of this paper, as covered benefits in ACA markets are generally homogeneous.
4↑ Pub. L. No. 111-148 and Pub. L. No. 111-152.
5↑ Throughout the paper we categorize CSR enrollees as those receiving 87 percent or 94 percent AV variant plan designs, which are available for people in households making less than 200 percent of the federal poverty level. CSR enrollees receiving 73 percent AV variant plans were considered to have additional benefits that were immaterial for purposes of the report.
6↑ Hixme Insurance Solutions, “Health Market Impact of Employer Migration to the Individual Market,” May 8, 2017, https://axenehp.com/wp-content/uploads/2019/05/Hixme-Legislative-Report-5-8-Final.pdf
7↑ Essential health benefits that all plans in the individual market must cover now include (1) ambulatory patient services; (2) emergency services; (3) hospitalization; (4) maternity and newborn care; (5) mental health and substance use disorder services; (6) prescription drugs; (7) rehabilitative and habilitative services and devices; (8) laboratory services; (9) preventive and wellness services; and (10) pediatric services, including oral and vision care. Department of Health and Human Services, “What Marketplace Health Insurance Plans Cover,” https://www.healthcare.gov/coverage/what-marketplace-plans-cover/
8↑ Enrollment calculations in this paper are based on the authors’ calculations using the Unified Rate Review data public use files available at https://www.cms.gov/marketplace/resources/data/rate-review-data
9↑ KFF, “How Narrow or Broad Are ACA Marketplace Physician Networks?”, Figure 12: https://www.kff.org/private-insurance/report/how-narrow-or-broad-are-aca-marketplace-physician-networks/
10↑ A high-deductible health plan is a separate network type in the KFF survey. These enrollees are excluded from the calculation in Exhibit 5. See Gary Claxton et al., “Employer Health Benefits: 2023 Annual Survey,” KFF, 2023, https://files.kff.org/attachment/Employer-Health-Benefits-Survey-2023-Annual-Survey.pdf
11↑ Categorizations for the employer market used results from medical loss ratio public use files available at https://www.cms.gov/marketplace/resources/data/medical-loss-ratio-data-systems-resources
12↑ Claxton et al., “Employer Health Benefits,” Figure 7.12.
13↑ Matthew Rae, Rebecca Copeland, and Cynthia Cox, “Tracking the Rise in Premium Contributions and Cost-Sharing for Families with Large Employer Coverage,” Peterson-KFF Health System Tracker, August 14, 2019, https://www.healthsystemtracker.org/brief/tracking-the-rise-in-premium-contributions-and-cost-sharing-for-families-with-large-employer-coverage/. In 2024, there was a substantial growth in the percentage of enrollees claiming income less than 150 percent FPL to qualify for 94 percent AV plans. Thus, the average AV of individual market plans likely increased significantly from 2023 to 2024.
14↑ Congressional Budget Office, “The Effects of Terminating Payments for Cost-Sharing Reductions,” August 2017, https://www.cbo.gov/system/files/115th-congress-2017-2018/reports/53009-costsharingreductions.pdf
15↑ Throughout this paper, silver loading refers to “increases in premiums of qualified health plans (QHPs) on account of the cessation of federal funding for cost-sharing reduction (CSR) payment to issuers [that] have elected to distribute the CSR load on silver level plans [and] make a plan level adjustment based on actuarial value and cost-sharing design of the plan.” See Samara Lorenz, Director, Oversight Group, Centers for Medicare and Medicaid Services (CMS), “Offering of Plans That Are Not QHPs Without CSR ‘Loading,’” August 3, 2018, https://www.cms.gov/CCIIO/Resources/Regulations-and-Guidance/Downloads/Offering-plans-not-QHPs-without-CSR-loading.pdf
16↑ KFF, “Data Note: 2020 Medical Loss Ratio Rebates,” April 17, 2020, https://www.kff.org/report-section/data-note-2020-medical-loss-ratio-rebates-data-note/
17↑ KFF, “Premiums and Worker Contributions Among Workers Covered by Employer-Sponsored Coverage, 1999-2023,” October 18, 2023, https://www.kff.org/interactive/premiums-and-worker-contributions-among-workers-covered-by-employer-sponsored-coverage/
18↑ Average AV previously cited through footnote 13. Average employee age taken from 2022 Bureau of Labor Statistics report available at https://www.bls.gov/cps/cpsaat18b.htm
19↑ Actuaries have noted CMS’s recognition of “low observed utilization levels for individuals enrolled in the silver income-based CSR plan variations.” See Jason Karcher, Chair, Individual and Small Group Markets Committee, American Academy of Actuaries, “Proposed Notice of Benefit and Payment Parameters for 2025,” letter to CMS, January 8, 2024, https://www.actuary.org/sites/default/files/2024-01/health-comment-2025-NBPP.pdf
20↑ HHS, “Individual Market Premium Changes: 2013-2017,” May 23, 2017, https://aspe.hhs.gov/sites/default/files/migrated_legacy_files//174771/IndividualMarketPremiumChanges.pdf
21↑ Anna L. Goldman et al., “Out-of-Pocket Spending and Premium Contributions After Implementation of the Affordable Care Act,” JAMA Internal Medicine 178, no. 3 (March 2018), https://www.ncbi.nlm.nih.gov/pmc/articles/PMC5885918/
22↑ Until 2026, while the temporary enhancements created by ARPA are in place and the upper eligibility limit of 400 percent FPL is removed.
23↑ Daniel Cruz and Greg Fann, “The Shortcomings of the ACA Exchanges: Far Less Enrollment at a Much Higher Cost,” Paragon Health Institute, September 2023, https://paragoninstitute.org/private-health/shortcomings-of-the-aca-exchanges/
24↑ Greg Fann, “Restoring the Indifference Ideal: If It’s Not Adjusting for ‘Risk,’ It’s Not ‘Risk Adjustment,’” Society of Actuaries, June 2022, https://www.soa.org/sections/health/health-newsletter/2022/june/hw-2022-06-fann/
25↑ CMS, “HHS-Operated Risk Adjustment Technical Paper on Possible Model Changes,” October 26, 2021, https://www.cms.gov/files/document/2021-ra-technical-paper.pdf. Table A.4 shows that the current risk adjustment model matches paid claims when running CSR members with 87 percent and 94 percent AV through the silver 70 percent AV factors. This result implies that the model overcompensates for these members by close to 30 percent (90 percent AV divided by 70 percent AV).
26↑ “In 2016, a leading actuarial firm reported that risk adjustment payments significantly exceeded CSR claims, so CSR members generated revenue far above their actual costs. The actuaries concluded, ‘CSRs are Key to Success.’ The risk adjustment formula assumed that lower cost-sharing would increase utilization for low-income CSR consumers above levels in lower-AV silver coverage, ignoring income’s impact cutting health care use. Carriers soon began aggressively underpricing silver, the obvious strategy for attracting profitable CSR consumers, whose low incomes make them sensitive to small premium differences” (Stan Dorn and Timothy Jost, “ACA Metal-Tier Mispricing: Improving Affordability by Solving an Actuarial Mystery,” Health Affairs Forefront, January 27, 2023, https://www.healthaffairs.org/content/forefront/aca-metal-tier-mispricing-improving-affordability-solving-actuarial-mystery).
27↑ An enrollee with income between 100 percent and 150 percent FPL who selects a silver plan is entitled to a 94 percent AV plan, and an enrollee with income between 150 percent and 200 percent FPL who selects a silver plan is entitled to an 87 percent AV plan. An enrollee with income between 200 percent and 250 percent FPL who selects a silver plan is entitled to a 73 percent AV plan, but that AV is not near platinum level.
28↑ Dorn and Jost, “ACA Metal-Tier Mispricing.”
29↑ Daniel Cruz, “3rd Annual ACA Consumer Value State Rankings,” Axene Health Partners, https://axenehp.com/3rd-annual-aca-consumer-value-state-rankings/
30↑ Enrollees who select silver plans and have income between 200 percent and 250 percent FPL have a nominal 3 percent CSR benefit and are not included as part of the CSR population in this paper. In our experience, their enrollment patterns are similar to silver enrollees who are ineligible for CSR benefits.
31↑ Stan Dorn, “How New Mexico Dramatically Reduced Marketplace Deductibles at Zero Cost to the State,” Health Affairs Forefront, July 20, 2022, https://www.healthaffairs.org/content/forefront/new-mexico-dramatically-reduced-marketplace-deductibles-zero-cost-state; Greg Fann, “The Fruits of Objective Actuarial Communication,” The Actuary, February 2023, https://www.theactuarymagazine.org/the-fruits-of-objective-actuarial-communication/; Greg Fann, “Actuaries versus Experts: Lost Sheep Astray on Route ACA,” Axene Health Partners, https://axenehp.com/actuaries-versus-experts-lost-sheep-astray-route-aca/.
32↑ Cynthia Cox et al., “Affordability in the ACA Marketplace Under a Proposal Like Joe Biden's Health Plan,” KFF, September 28, 2020, https://www.kff.org/affordable-care-act/issue-brief/affordability-in-the-aca-marketplace-under-a-proposal-like-joe-bidens-health-plan/
33↑ Silver plan premiums could be higher than gold plan premiums as early as 2025. See Figure 5.
34↑ At the time this paper was published, HHS was projecting no related material regulation changes for plan year 2025. The proposed rule indicated, “We also propose to maintain the current CSR adjustment factors for silver plan variant enrollees (70 percent, 73 percent, 87 percent, and 94 percent AV plan variants) for the 2025 benefit year and beyond, unless changed through notice-and-comment rulemaking.”
35↑ Brian Blase, Theo Merkel, and Drew Gonshorowski, “In 2024, Over Half of Federal Exchange Enrollees Have Income Below 150% of the Federal Poverty Level,” Paragon Health Institute, https://paragoninstitute.org/paragon-pic/in-2024-over-half-of-exchange-enrollees-have-income-below-150-of-the-federal-poverty-level/
36↑ “All else equal, people with less income use fewer services. As explained by the American Academy of Actuaries, ‘In general, lower-income individuals have … a significantly higher threshold for determining when a service is sufficiently valuable to be utilized. As such, we would generally anticipate much lower utilization among low-income enrollees’” (Dorn and Jost, “ACA Metal-Tier Mispricing”).
37↑ CMS, “Information on Risk Adjustment Methodology and Rate Filing Deadlines,” August 10, 2017, https://regtap.cms.gov/uploads/library/QHP_FAQ_5CR_081117.pdf
38↑ CMS, “HHS-Operated Risk Adjustment.”
39↑ These concerns are mitigated by CMS “encouraging states to allow Exchange issuers to offer individual market plans that do not include this load, and that will only be available outside the Exchange” (Lorenz, “Offering of Plans That Are Not QHPs”).
40↑ The only question at an award-winning Society of Actuaries Health Meeting presentation in 2022 was related to customer confusion as a result of single risk compliance in a silver loading environment. See the footage at https://cdn-files.soa.org/pd/2022_health_meeting/mtg20221801/pd_2022_06_health_meeting_session_4b.mp4 at the 58:08 mark.
41↑ As described earlier, the AV of silver plans has risen to nearly 88 percent on average.
42↑ Kevin Dyke, Chair, Health Actuarial (B) Task Force, National Association of Insurance Commissioners (NAIC), “Cost Sharing Reduction (CSR) Referral to the Health Actuarial (B) Task Force Made at the 2023 Summer National Meeting,” memorandum to Anita G. Fox, Chair, Health Insurance and Managed Care (B) Committee, June 3, 2024, https://view.officeapps.live.com/op/view.aspx?src=https%3A%2F%2Fcontent.naic.org%2Fsites%2Fdefault%2Ffiles%2Fcall_materials%2FHATF%2520CSR%2520Memo%2520B%2520Committee_Final_20240603.docx&wdOrigin=BROWSELINK
43↑ Matthew Fiedler, “The Case for Replacing ‘Silver Loading,’” Brookings Institution, May 20 2021, https://www.brookings.edu/articles/the-case-for-replacing-silver-loading/. Figure 1 in this paper illustrates the misalignment of premiums from 2014 to 2017 resulting from weak single-risk-pool enforcement and the offsetting impact of silver loading beginning in 2018.
44↑ In March 2023, Kevin Dyke, current chair of the NAIC Health Actuarial (B) Task Force, said that “it continues to be a challenge for state insurance regulators to determine whether an insurer’s CSR loading methodology is actuarially sound and in keeping with the single-risk pool requirements.” NAIC, Health Actuarial (B) Task Force, 2023 Summer National Meeting, August 7, 2023, https://content.naic.org/sites/default/files/national_meeting/Materials_HATF%20_%202023%20Summer%20NM.pdf
45↑ Jared Ortaliza et al., “Health Insurer Financial Performance in 2023,” KFF, July 2, 2024, https://www.kff.org/medicare/issue-brief/health-insurer-financial-performance/
46↑ Average premiums in the individual and small group from the source for Figure 11 were normalized to 60 percent AV and 40-year-old average age. Individual market AVs were further adjusted to account for the impact of CSR enrollees receiving platinum-level benefits.
47↑ Rebecca Pifer, “Centene Tries to Quell Concerns of ACA Overhaul During Investor Day,” Healthcare Dive, December 13, 2023, https://www.healthcaredive.com/news/centene-investor-day-aca-growth-ichra-2024-election/702295/
48↑ Post-ACA policy changes and strengthened regulatory enforcement led to an increase in the number of Americans with private market insurance. Greg Fann and Daniel Cruz, “The Obamacare Exchanges Fall Short,” National Review, September 23, 2023, https://www.nationalreview.com/2023/09/the-obamacare-exchanges-fall-short/
49↑ Cruz and Fann, “The Shortcomings of the ACA Exchanges.”
50↑ The expanded PTCs were intended as a temporary emergency response to the COVID-19 pandemic.
Related Research

Authors


Acknowledgements
The authors are grateful to the Paragon team, and to Charles Miller, Peter Nelson, Theo Merkel, and Brian Blase for their exceptional comments and work in review of the paper.