Reforming Government, Empowering Patients
Navigation
The Shortcomings of the ACA Exchanges
Far Less Enrollment at a Much Higher Cost
The Paper
This paper analyzes the effectiveness of the ACA’s restructuring of the individual health insurance market, focusing on its impact on coverage access and reducing the uninsured rate amidst ongoing public confusion and political debate.
Executive Summary
What this policy brief covers
The Patient Protection and Affordable Care Act (ACA) restructured the individual health insurance market into federally regulated exchanges with large subsidies linked to both premiums and household income. Despite the ACA being one of the preeminent issues debated in the political arena for more than a decade, there is still much public confusion around the impact of the major changes – particularly those applying to the individual market. This paper cuts through the political rhetoric to assess the effectiveness of the ACA individual market policies to increase access to coverage and reduce the uninsured rate.
What We Found
The ACA individual market policies have produced far less enrollment at a much higher unit cost than projected. Federal spending on the ACA exchanges, totaling $60 billion in 2021, resulted in an increase of 1.6 million Americans covered under private insurance. Overall, employer coverage dropped by 1.3 million enrollees, and non-group coverage increased by 2.9 million enrollees. The cost to taxpayers has been $36,798 per additional private insurance enrollee and $20,739 per additional non-group enrollee, which is more than triple CBO’s original projections of $10,538 and $6,850, respectively.
These amounts reflect the impact of several ACA policy changes since 2014 that increased federal spending and exchange enrollment but are particularly inefficient.
- Stopping cost-sharing reduction payments led insurers to raise silver plan premiums, resulting in an increase of federal subsidies that increased enrollment at a cost of $16,928 per additional subsidized enrollee.
- The American Rescue Plan Act (ARPA) reduced income-based premium contributions for subsidized enrollees and expanded subsidy eligibility. As a result, federal subsidies increased by $8,712 per additional subsidized enrollee.
- Some state regulators have directed insurers to adjust premium relationships to align with the ACA’s single risk pool requirement, resulting in higher silver premiums, higher subsidies (available to enrollees regardless of metal tier plan), and lower net premiums for other metal level plans. These actions have varied across states and are evolving.
While ACA advocates focused on the private market reforms when selling the legislation to the public, the vast majority of individuals who gained coverage following the implementation of the law have done so through Medicaid. Of the 19 million additional Americans with health coverage after the ACA was implemented, 17.4 million were covered under the newly eligible Medicaid expansion group.
Why it Matters
The enhanced federal subsidies created by the ARPA, and extended by the Inflation Reduction Act, are set to expire after 2025. This will provide an opportunity for Congress to evaluate the effectiveness of the ACA’s private market policies in light of the implementation of the original law and the subsequent changes. Evidence thus far suggests public resources could be expended in much better ways.
THE SHORTCOMINGS OF THE ACA EXCHANGES: FAR LESS ENROLLMENT AT A MUCH HIGHER COST
The passage of the Patient Protection and Affordable Care Act (ACA) in 2010 represented one of the most significant changes to federal health policy since the Social Security Amendments of 1965, which established the Medicare and Medicaid programs. The principal goal of the multifaceted law was to reduce the number of uninsured Americans. The primary barrier to insurance coverage was presumed to be cost, and the intent of the law was to appropriate financial resources to provide coverage incentives for lower-income individuals.
The means of accomplishing this goal were two-fold: (1) enhanced federal funding for states to expand eligibility for Medicaid and (2) restructuring the individual market into federally regulated exchanges with large subsidies linked to both premiums and household income. While coverage was roughly anticipated to increase by equal numbers in each program, the individual market received far more promotion and public attention.1 The addition of shared responsibility provisions, sometimes referred to as mandates, were included in the law as individual and employer tax penalties and were regarded to be effective ways to promote coverage.
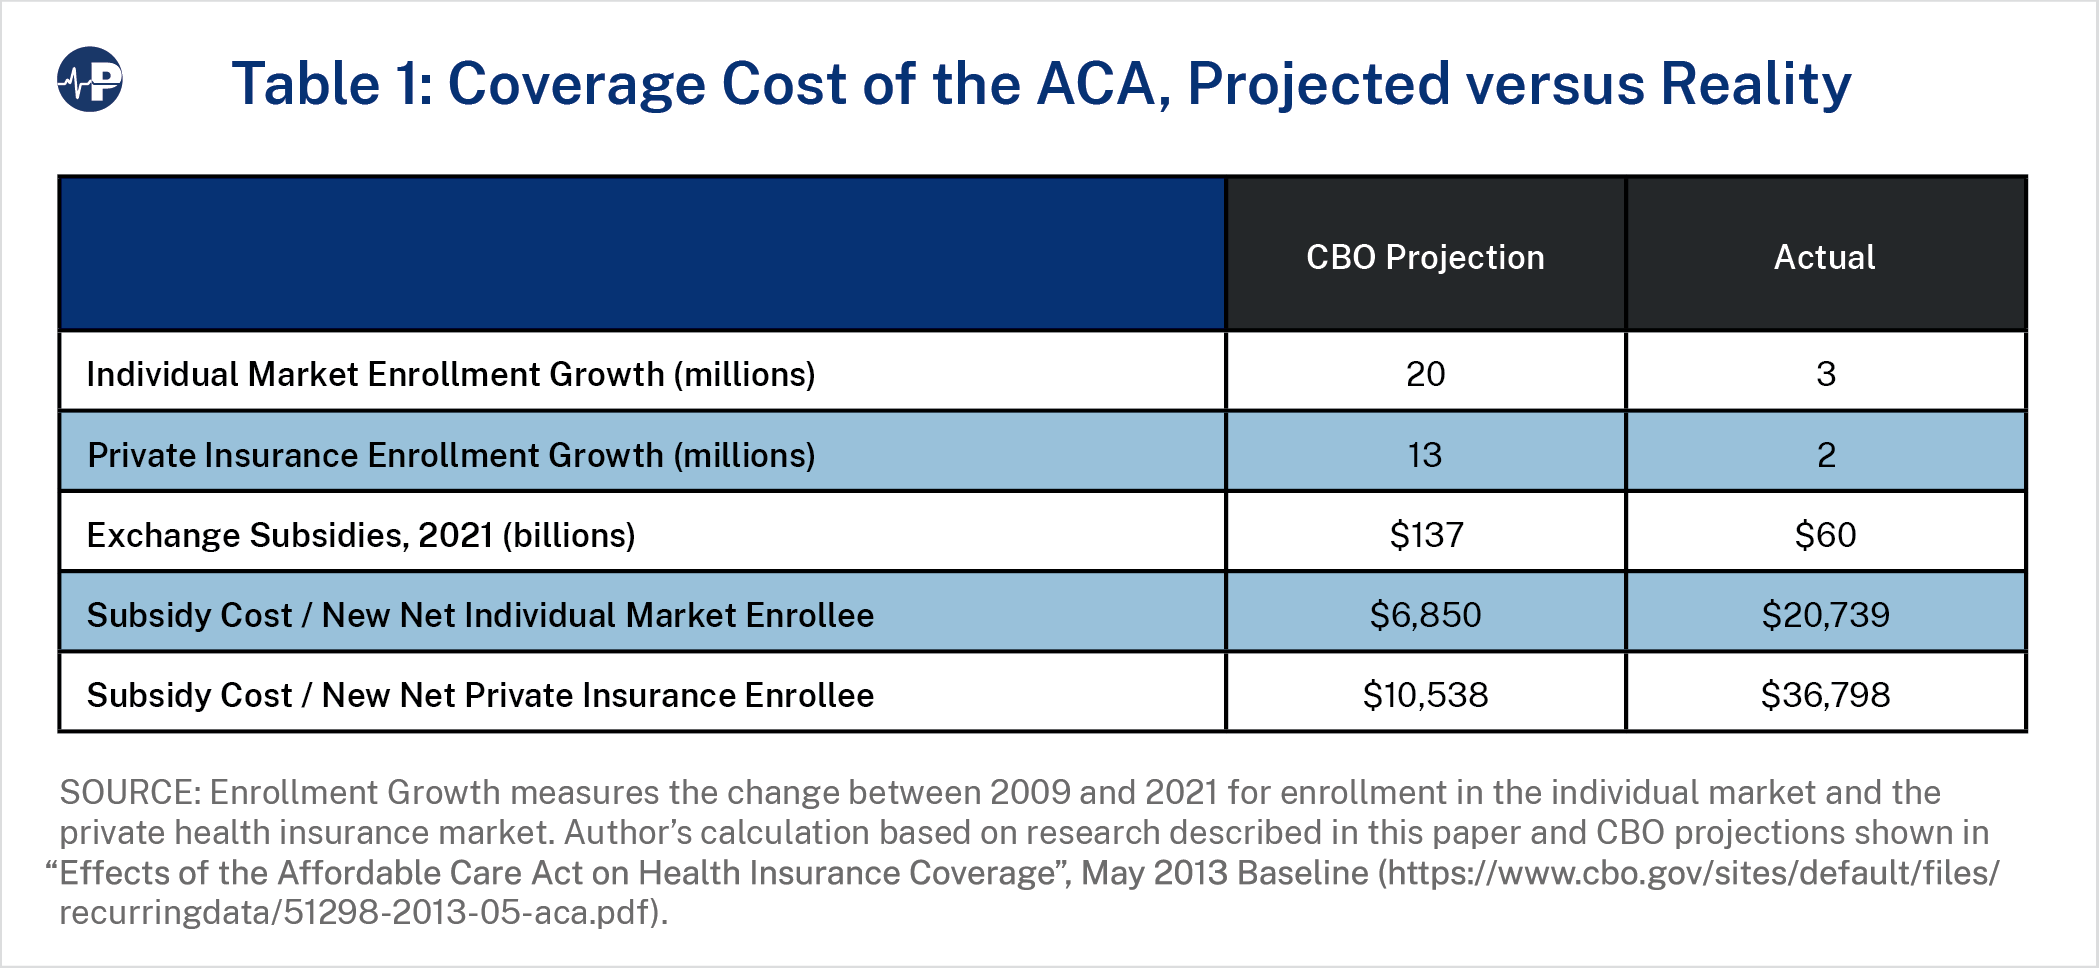
This paper reviews the efficiency of the ACA individual market policies to increase access to affordable coverage and the impact on the uninsured rate.2 Health coverage policy efficiency is defined in terms of the increase in overall coverage relative to the taxpayer cost of achieving that increase. While ACA enrollment figures have been reported—and sometimes singularly celebrated—on growth alone without regard to underlying cost, assessments of efficiency have been lacking and have resulted in a poor understanding of policy efficacy. Table 1 compares the projections from the Congressional Budget Office (CBO) made in 2013 for enrollment and subsidy amounts in 2021 with actual enrollment and subsidies in that year, including calculations of the subsidy cost per new net individual market enrollee and new net private insurance enrollee.
The major findings of this research include:
- By 2021, enrollment in private insurance3 was nearly equal to pre-ACA levels. Of the 19 million additional Americans with health coverage after the ACA was implemented, over 17.4 million were covered under the newly eligible Medicaid expansion group. Federal spending on the ACA exchanges4 resulted in a total increase of 1.6 million Americans covered under private insurance relative to baseline projections from 2009.By comparison, the CBO had projected a health coverage increase of approximately 25 million Americans, evenly split between the new ACA exchanges and the expansion of Medicaid.
- ACA exchange spending of $60 billion5 in 2021 cost taxpayers $36,798 per additional private insurance enrollee ($20,739 per additional nongroup enrollee), more than triple CBO’s original projections of $10,538 and $6,850, respectively. Overall, employer coverage dropped by 1.3 million, and non-group coverage increased by 2.9 million.
- Various ACA policy changes since 2014 have led to an increase in federal spending and increased exchange enrollment. While these enhancements have increased average subsidies by more than 45 percent, individual market enrollment remains at half of original policy expectations. The three primary policy changes take different forms:
- Administrative policy: The federal government’s cessation of reimbursing insurers for cost-sharing reduction (CSR) payments led insurers to raise silver premiums to reflect the resulting higher actuarial value6 of silver plans.7 While reversing the impact of premium misalignment,8 CSR defunding results were also inefficient ($16,928 per additional subsidized enrollee).
- Federal legislation: The American Rescue Plan Act (ARPA) reduced required income-based premium contributions for subsidized enrollees and expanded the population eligible for subsidies. This increased federal subsidies by $8,712 per additional subsidized enrollee.
- Regulatory enforcement: State regulators have taken compliance action to adjust insurance premium relationships to align with the ACA’s single risk pool requirement, resulting in higher silver premiums, higher subsidies (available to enrollees regardless of metal tier plan), and lower net premiums for other metal levels. For example, New Mexico implemented “premium alignment” rules in 2022,9 and Texas followed suit in 2023.10 As state regulatory enforcement efforts have generally been recent in nature, they are not separately itemized in our historical analysis, and such state regulatory actions continue.11 Policymakers should be cognizant of the inherent longer-term enrollment and cost implications resulting from additional state enforcement of premium alignment rules.
ACA-INDUCED COVERAGE CHANGES
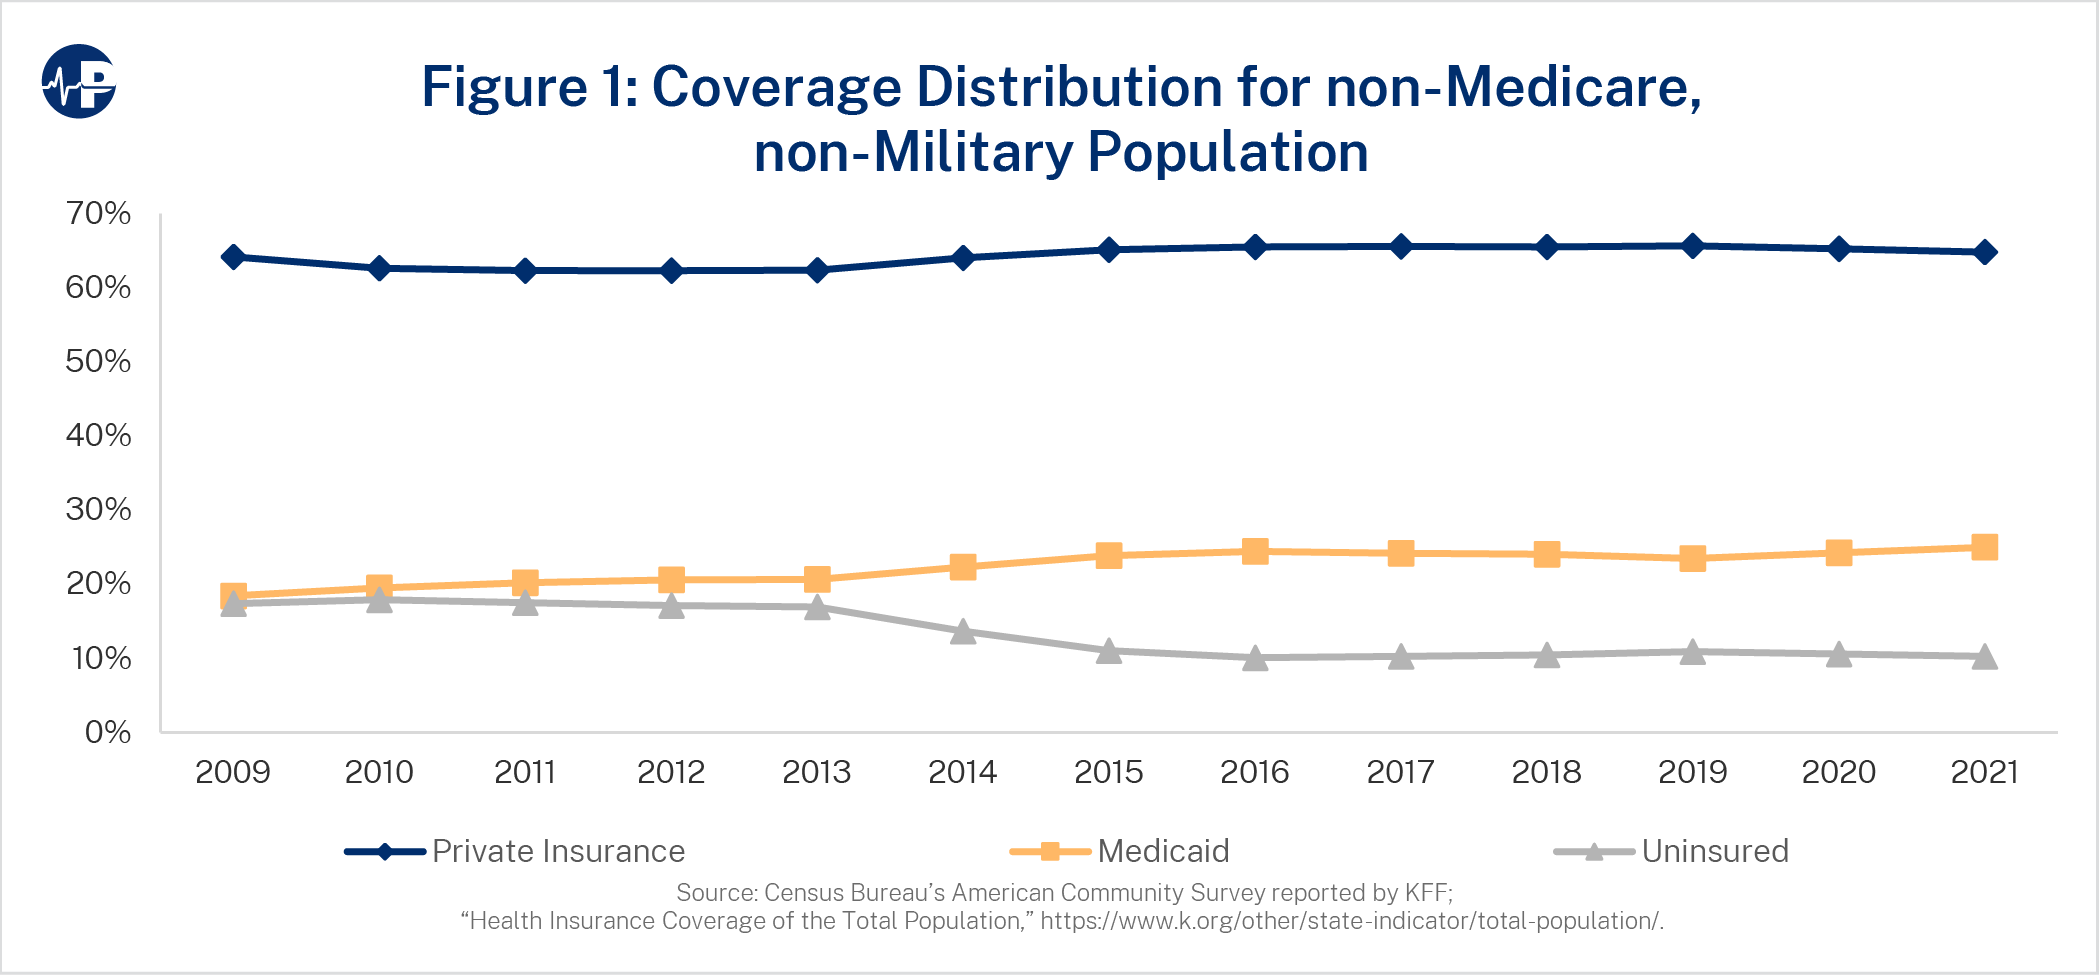
Figure 1 displays the annual distribution of Americans by private insurance coverage, Medicaid coverage, and no coverage (uninsured). Notably, 67 percent of the uninsured population had access to subsidized coverage in 2019, and another 13 percent were not lawfully present.12 Private insurance subscribers are generally enrolled in employer-sponsored benefit plans, including self-insured groups, the individual ACA exchanges, and other self-reported non-group coverage. Enrollment figures are tabulated from the Census Bureau’s American Community Survey reported by KFF. Medicare beneficiaries and enrollees in the Military Health System are excluded from the analyzed population.
The ACA helped reduce the uninsured proportion of the analyzed population from 17.4 percent to 10.2 percent. As Figure 1 shows, this change is primarily due to Medicaid expansion, as Medicaid coverage increased from 18.4 percent in 2009 to 25.0 percent in 2021, equating to roughly 90 percent of the reduction in the uninsured rate.13 The proportion of nonelderly, non-military Americans covered under private insurance hovered around 64 percent during this period. Figure 2 displays the annual distribution at a more granular level than Figure 1.
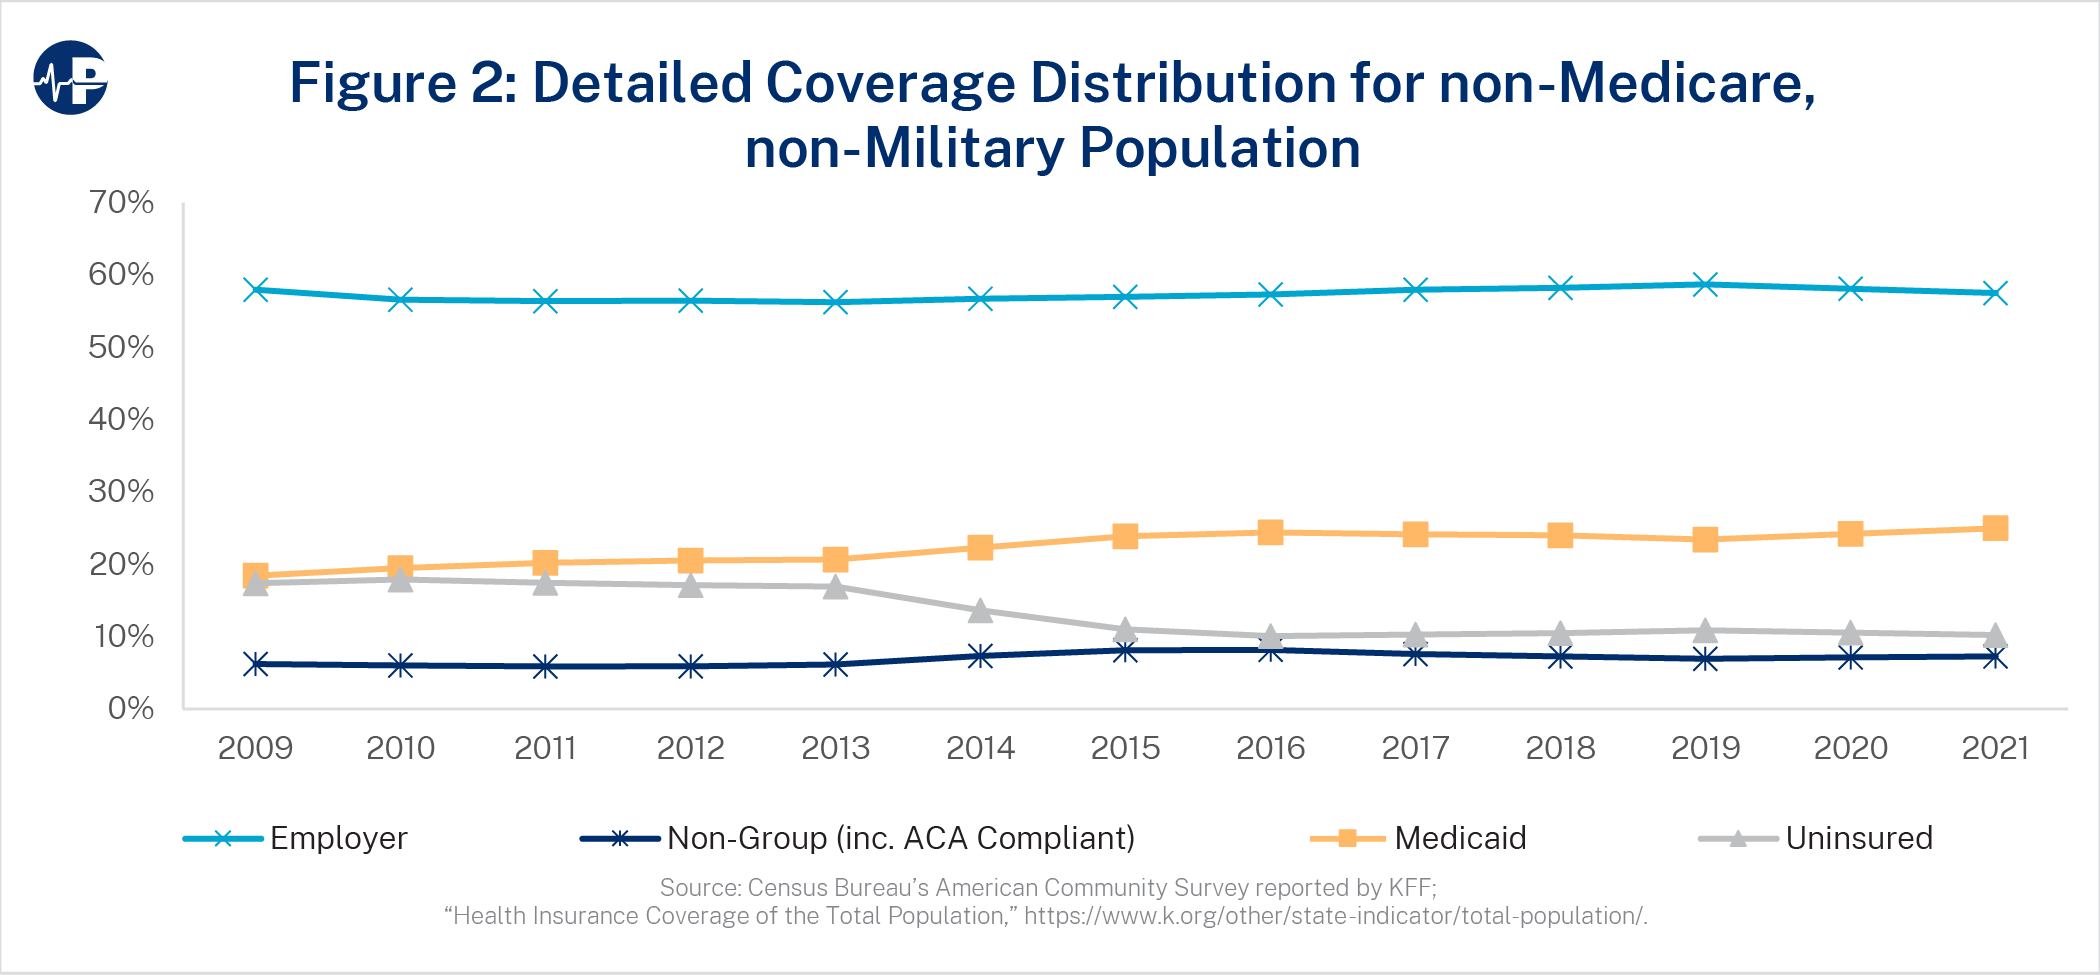
The stagnation in the proportion of Americans enrolled in private insurance is due to individual market gains being partially offset by a reduction in employer-sponsored coverage from 58.0 percent in 2009 to 57.5 percent in 2021. Individual market coverage increased from 6.2 percent to 7.3 percent in this period. By 2021, an estimated 17.4 million14 Americans were covered under the newly eligible Medicaid expansion group, and 10 million exchange enrollees received federal subsidies through non-group coverage. In total, by 2021, 10.1 percent of the analyzed population received direct access to the federal funding created by the ACA.
THE EFFICIENCY OF ACA SPENDING
As referenced, policy efficiency is defined in terms of the increase in overall coverage resulting from applicable policy relative to the cost borne by taxpayers. The starting point for assessing the ACA’s impact is 2009, the year before the ACA passed. Enrollment changes are measured by comparing actual enrollment levels to baseline levels, which were determined by multiplying the pre-ACA (2009) distribution percentages from Figure 1 and each year’s total analyzed population. Figure 3 displays the enrollment changes for non-group, employer coverage, Medicaid, and total coverage resulting from ACA implementation.
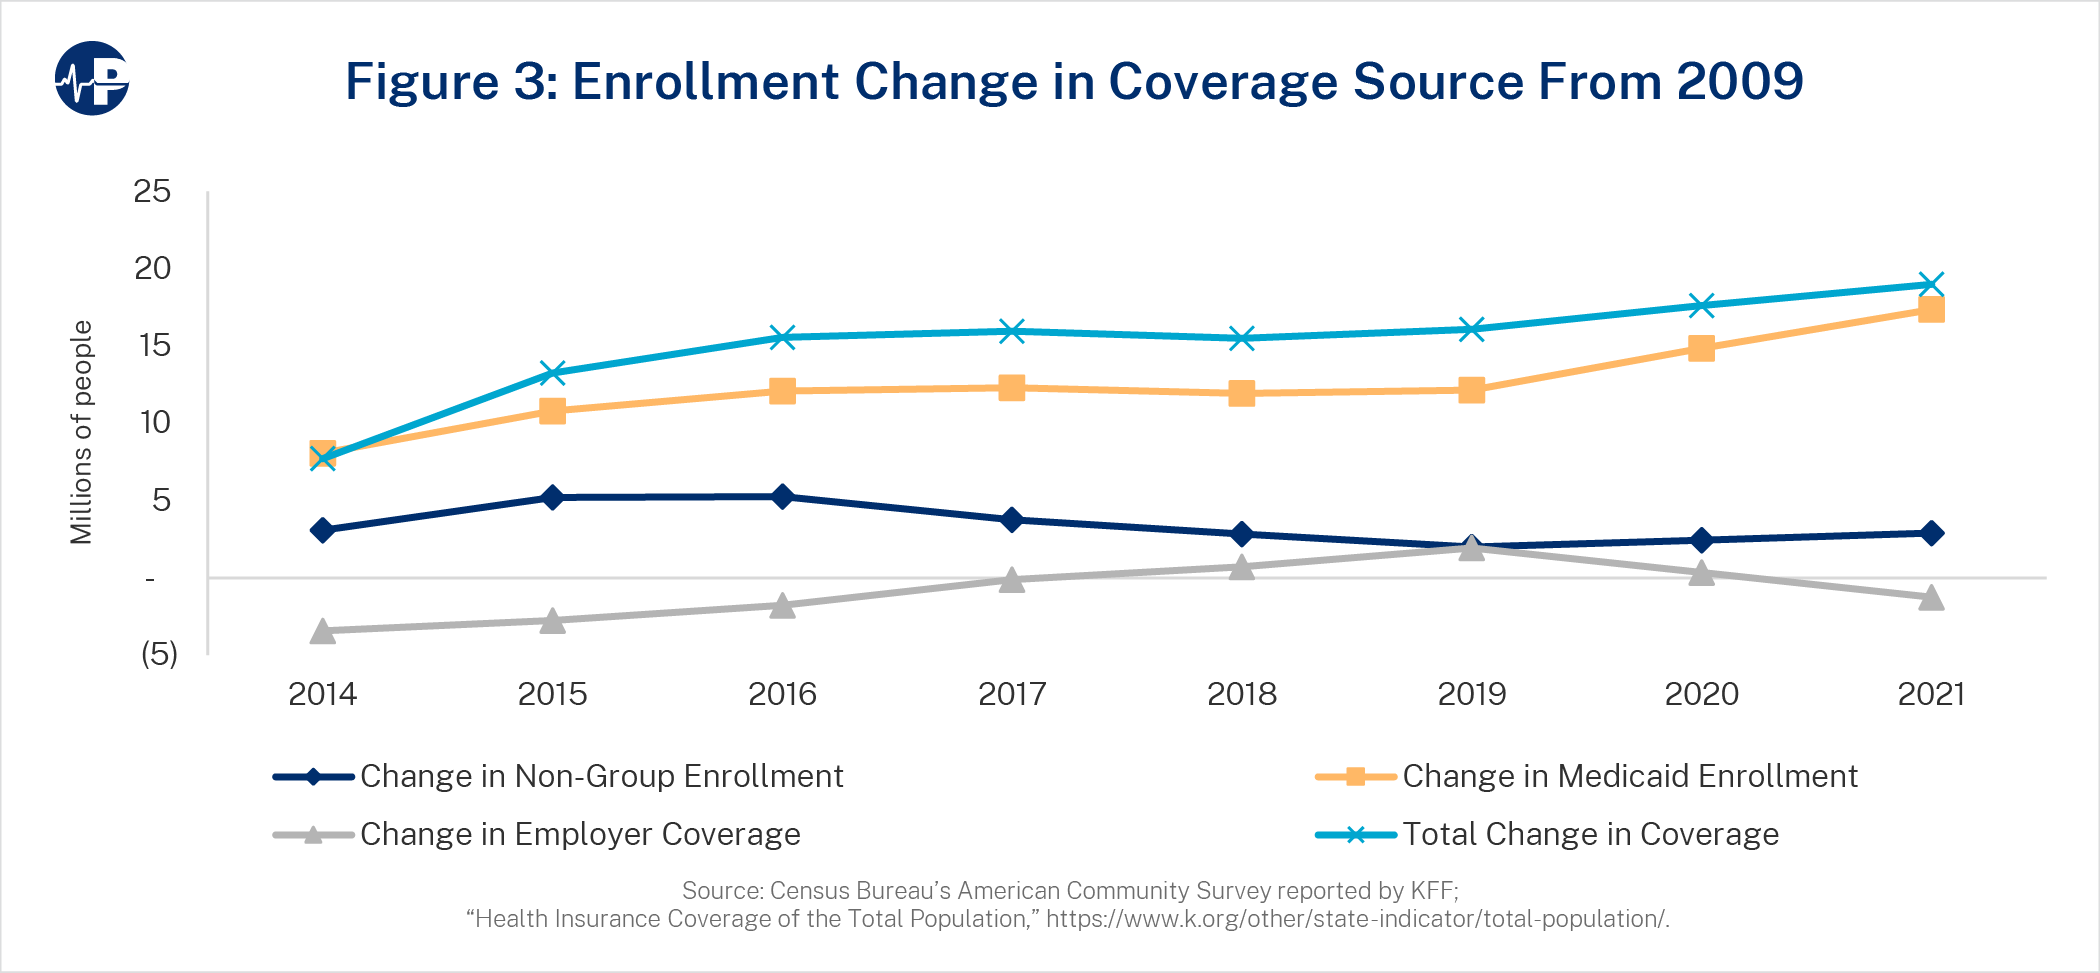
By 2021, the total change in enrollment from a pre-ACA environment was nearly equal to the change in Medicaid enrollment. For private insurance, the non-group enrollment increase was muted somewhat by the decrease in employer coverage. While non-group coverage has increased for lower income individuals and families, middle to higher income families received minimal, if any, financial assistance, bore the weight of the heavily regulated and higher premium environment, and were provided limited access to cheaper, non-ACA insurance solutions. All of this led to a much lower-than-expected increase in total non-group coverage.
According to the most recent (2022) KFF Employer Health Benefit Survey, small employers (3-199 employees) are increasingly not offering health benefits to their employees, with 51 percent offering coverage in 2022, down from 69 percent in 2010.15 The cost of insurance is cited as employers’ primary reason for not offering coverage. Many of the ACA provisions—including benefit minimums, essential health benefit requirements, and the small group market single risk pool—have driven costs higher for these employers.
Table 2 compares the actual results with the original CBO estimates for the federal spending amount for each additional private insurance enrollee and each additional non-group enrollee.
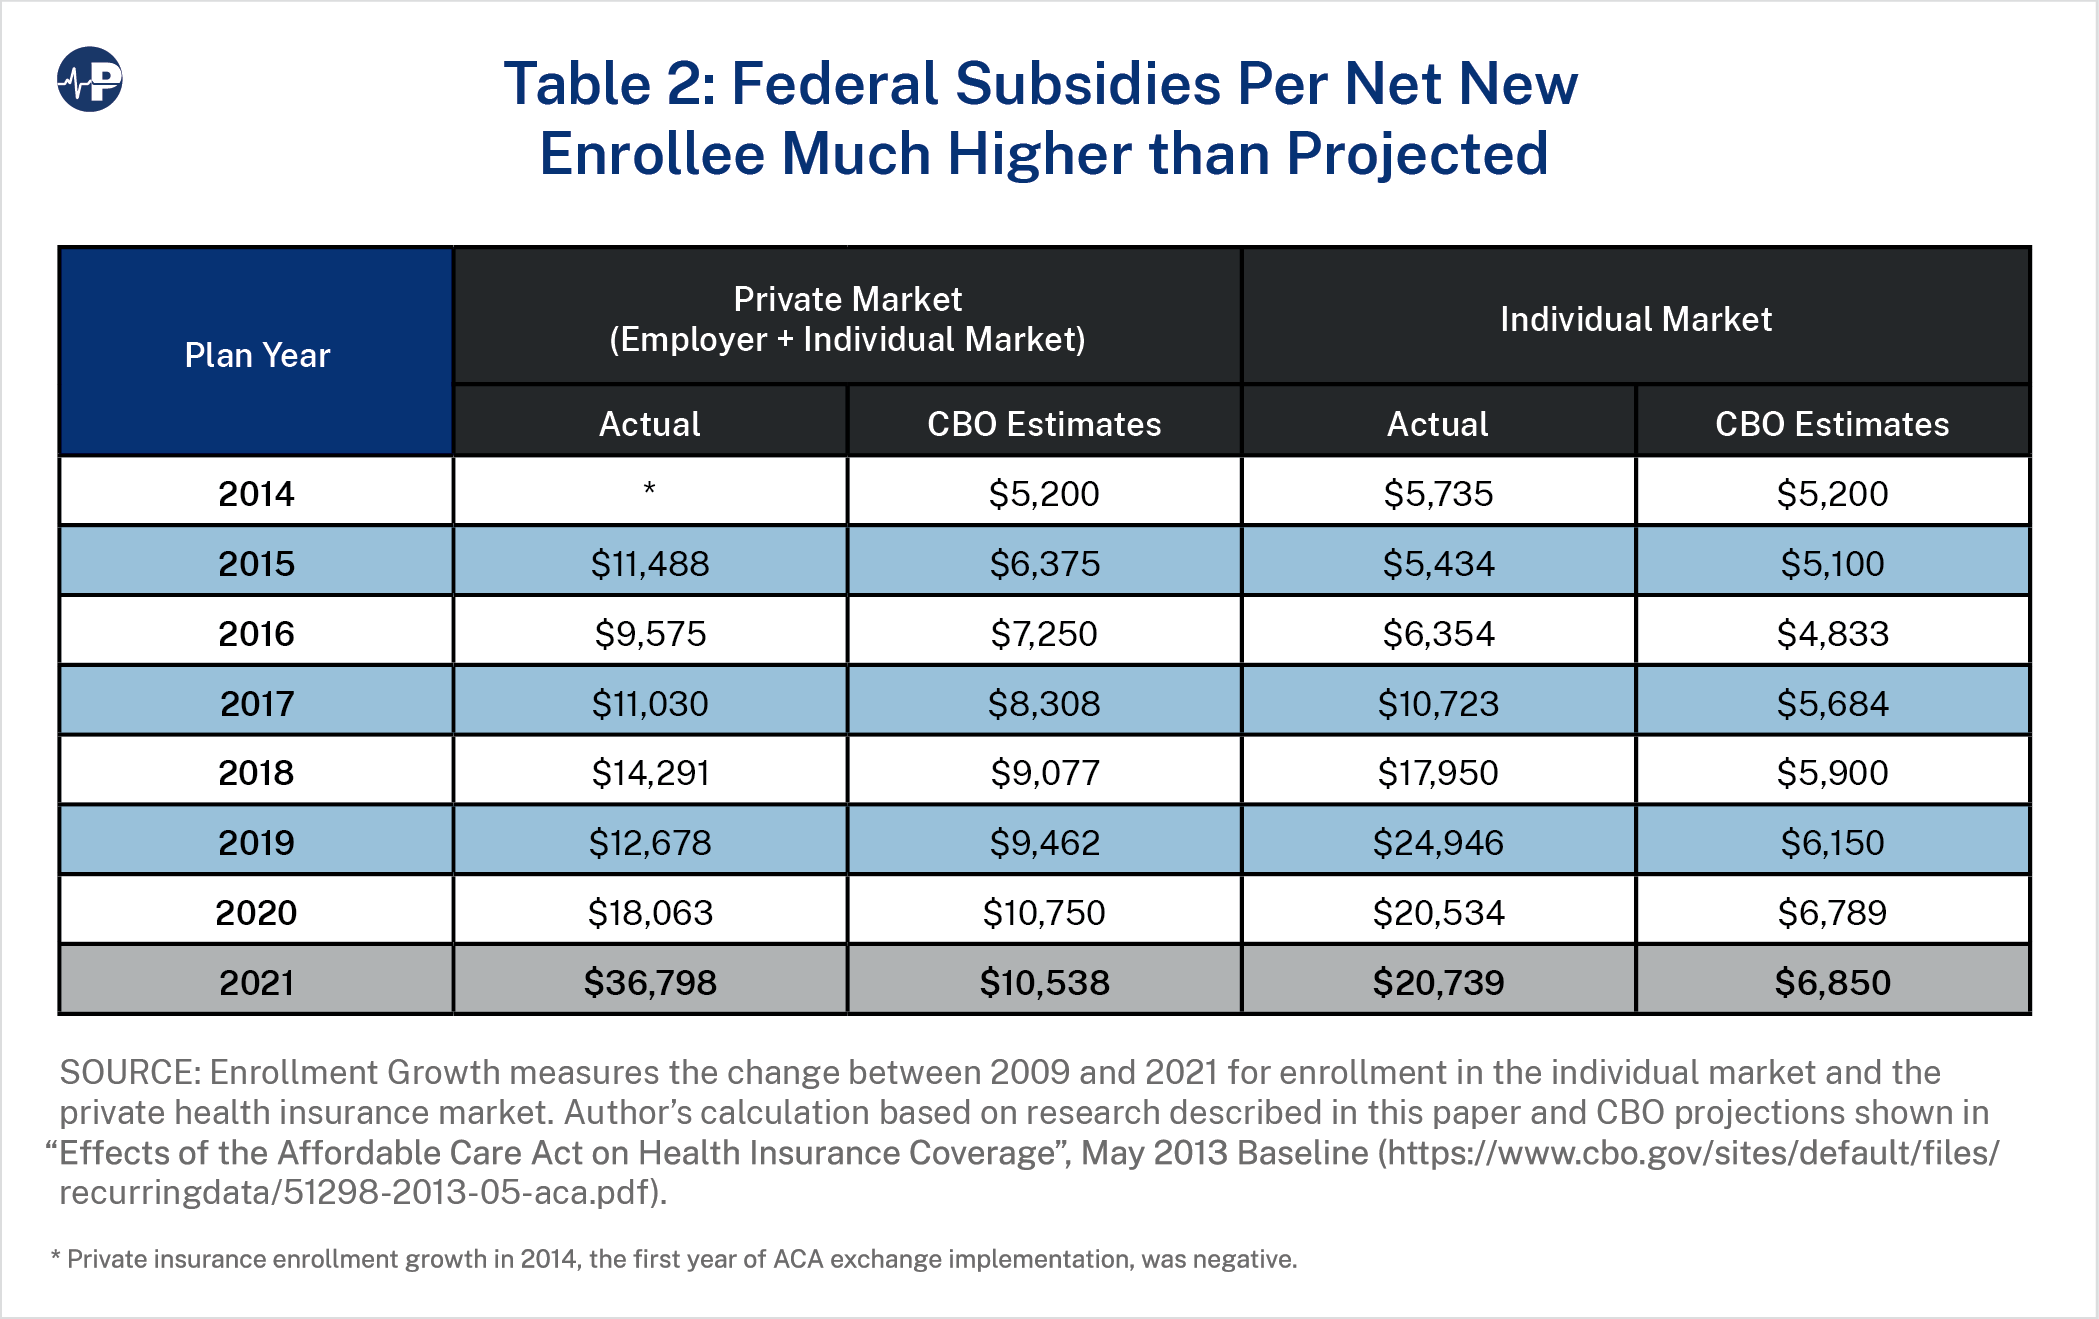
As private insurance coverage has declined since the COVID-19 pandemic, federal taxpayers are spending $36,798 for each additional private insurance enrollee. Isolating the individual market, the ACA exchanges have cost federal taxpayers $20,739 for each additional individual market enrollee. Respective CBO estimates are $10,538 and $6,850, as displayed in Table 2.
The individual market, dominated by the ACA exchanges, is more expensive and heavily regulated compared to its previous version. The ACA introduced a subsidy structure based on income and prices, leading to various value propositions for consumers at different income levels. The “benchmark plan”—the second-lowest-cost silver plan in each county—determines how much individuals personally contribute, with the contribution also based on a sliding-scale percentage of income. Subsidies cover most or all the premium for those with incomes below 200 percent of FPL and smaller portions for those with higher incomes. This financial structure has created complex and inefficient dynamics, where most subsidized consumers pay less as overall premiums increase16 and younger consumers can pay more for coverage than older consumers at the same income level.17
The ACA has effectively fostered a “winners and losers” demographic shift where the individual market exchanges attract a different group of people rather than serve as an impetus for covering more people.18 Pro-ACA stakeholders echoed these sentiments in 2017 when President Trump selected Tom Price to lead the Department of Health and Human Services. Christine Eibner, an economist with the RAND Corporation, confirmed that rolling back ACA rules “increases the overall number of people with coverage.”19 Sarah Kliff, now a health policy journalist at the New York Times, acknowledged at Vox that “this worries some [ACA] supporters, who say the goal of insurance reform isn’t just expanding coverage—it’s expanding coverage for people who really need health care.”20 As a result of ACA dynamics, many Americans with chronic medical conditions, low-income individuals and families, and older consumers received more affordable coverage, while healthy, higher-income, and younger consumers were disadvantaged with higher costs than they had before the ACA.
To understand the disparities in perceived consumer value, we analyzed enrollment shifts from 2014 to 2022 between ACA coverage and other non-group coverage at various income levels. Figure 4 displays the historical enrollment.

Americans receiving income-based subsidy support (incomes below 400 percent of FPL) rose from 4.9 million ACA enrollees in 2014 to 11.5 million enrollees in 2022. Meanwhile, enrollment of those without income-based subsidy support (above 400 percent and other non-group enrollees with alternative coverage) decreased from 14.8 million in 2014 to 9.1 million in 2022.21 Rising premiums in the ACA and efforts to limit affordable coverage outside of the ACA have resulted in reduced enrollment for Americans not receiving ACA subsidies. Paradoxically, rising ACA premiums increase subsidies and lead to enrollment increases for individuals and families under 400 percent FPL.22 Illustrating this dynamic, the average lowest cost gold net premiums by FPL categories are shown in Figure 5.
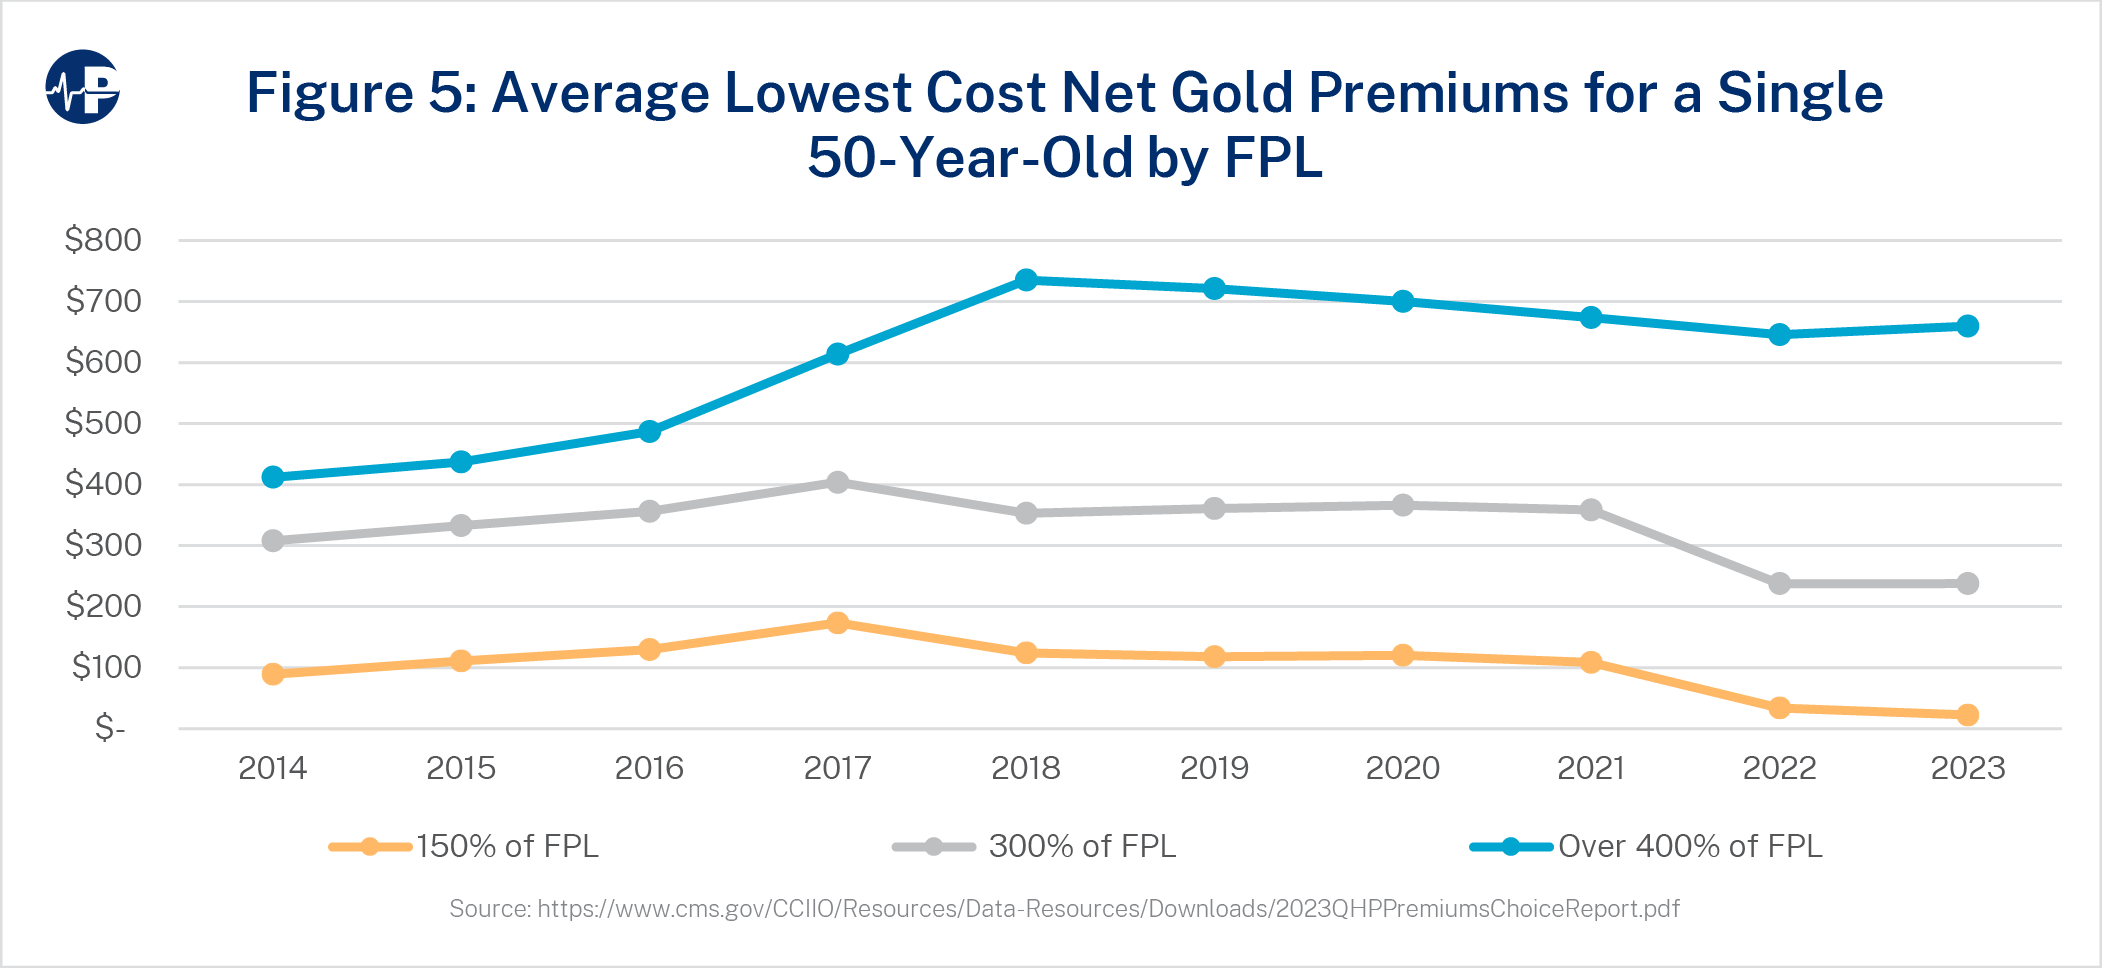
Through 2021, net premiums for the lowest cost gold plans remain relatively unimpacted by changes in gross premiums for those earning under 400 percent FPL, meaning that gross premium increases did not materially translate to net premium increases. Meanwhile, for those earning above 400 percent FPL, without subsidy eligibility, average costs have risen dramatically since 2014. From 2016 to 2018, premiums rose 61 percent while enrollment dropped 38 percent. Net premium cost remains the primary indicator of enrollment, as subsidized enrollees generally benefit from increased gross premiums and the unsubsidized are harmed by premium increases.
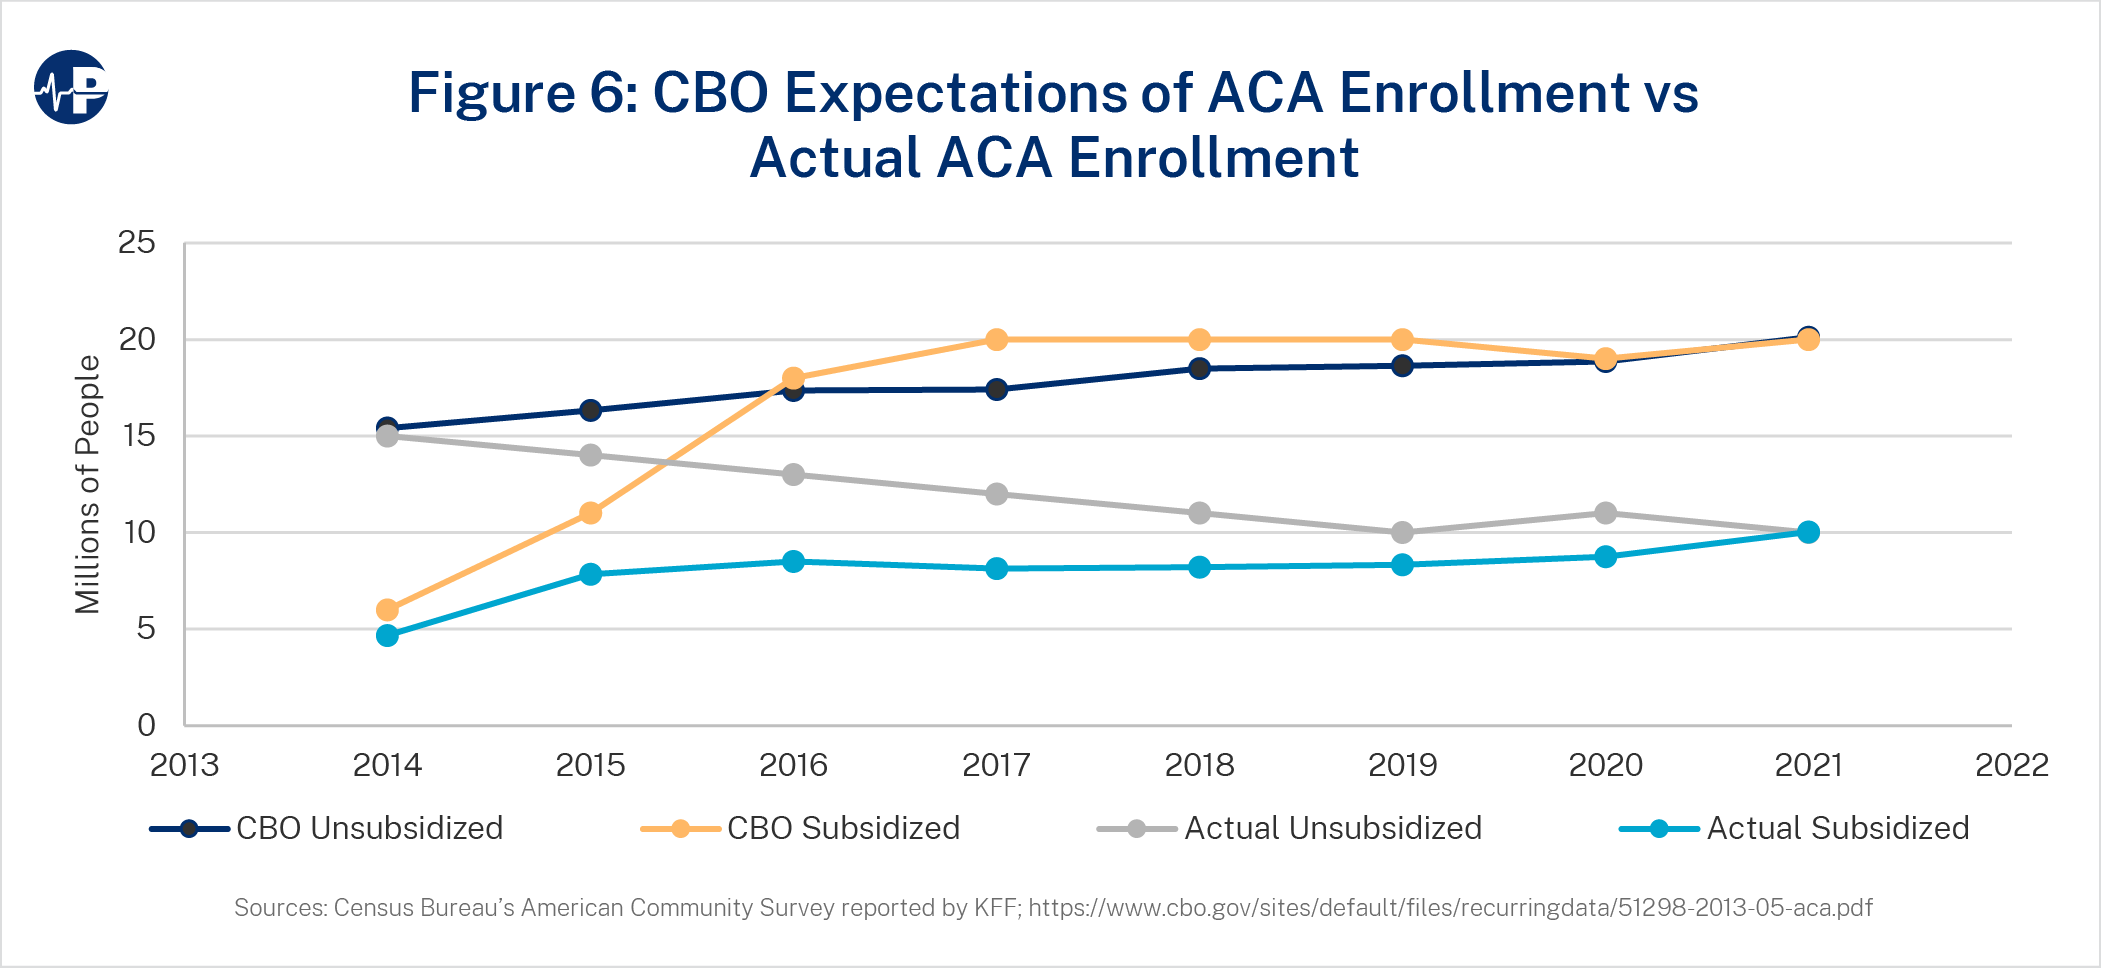
As of 2021, the individual health insurance market included fewer than 20 million people, while the CBO had projected 40 million Americans in the individual market by that year.23 High premiums and poor coverage value for the unsubsidized population is likely why unsubsidized coverage is just half of expectations. Despite increases in federal subsidies relative to the initial ACA subsidy design, subsidized enrollment is also half of original expectations. Figure 6 displays actual enrollment levels and original expectations broken out by subsidized versus unsubsidized enrollees with unsubsidized enrollment, including non-ACA coverage, and grandfathered and transitional plans.
ACA SUBSIDY INCREASES
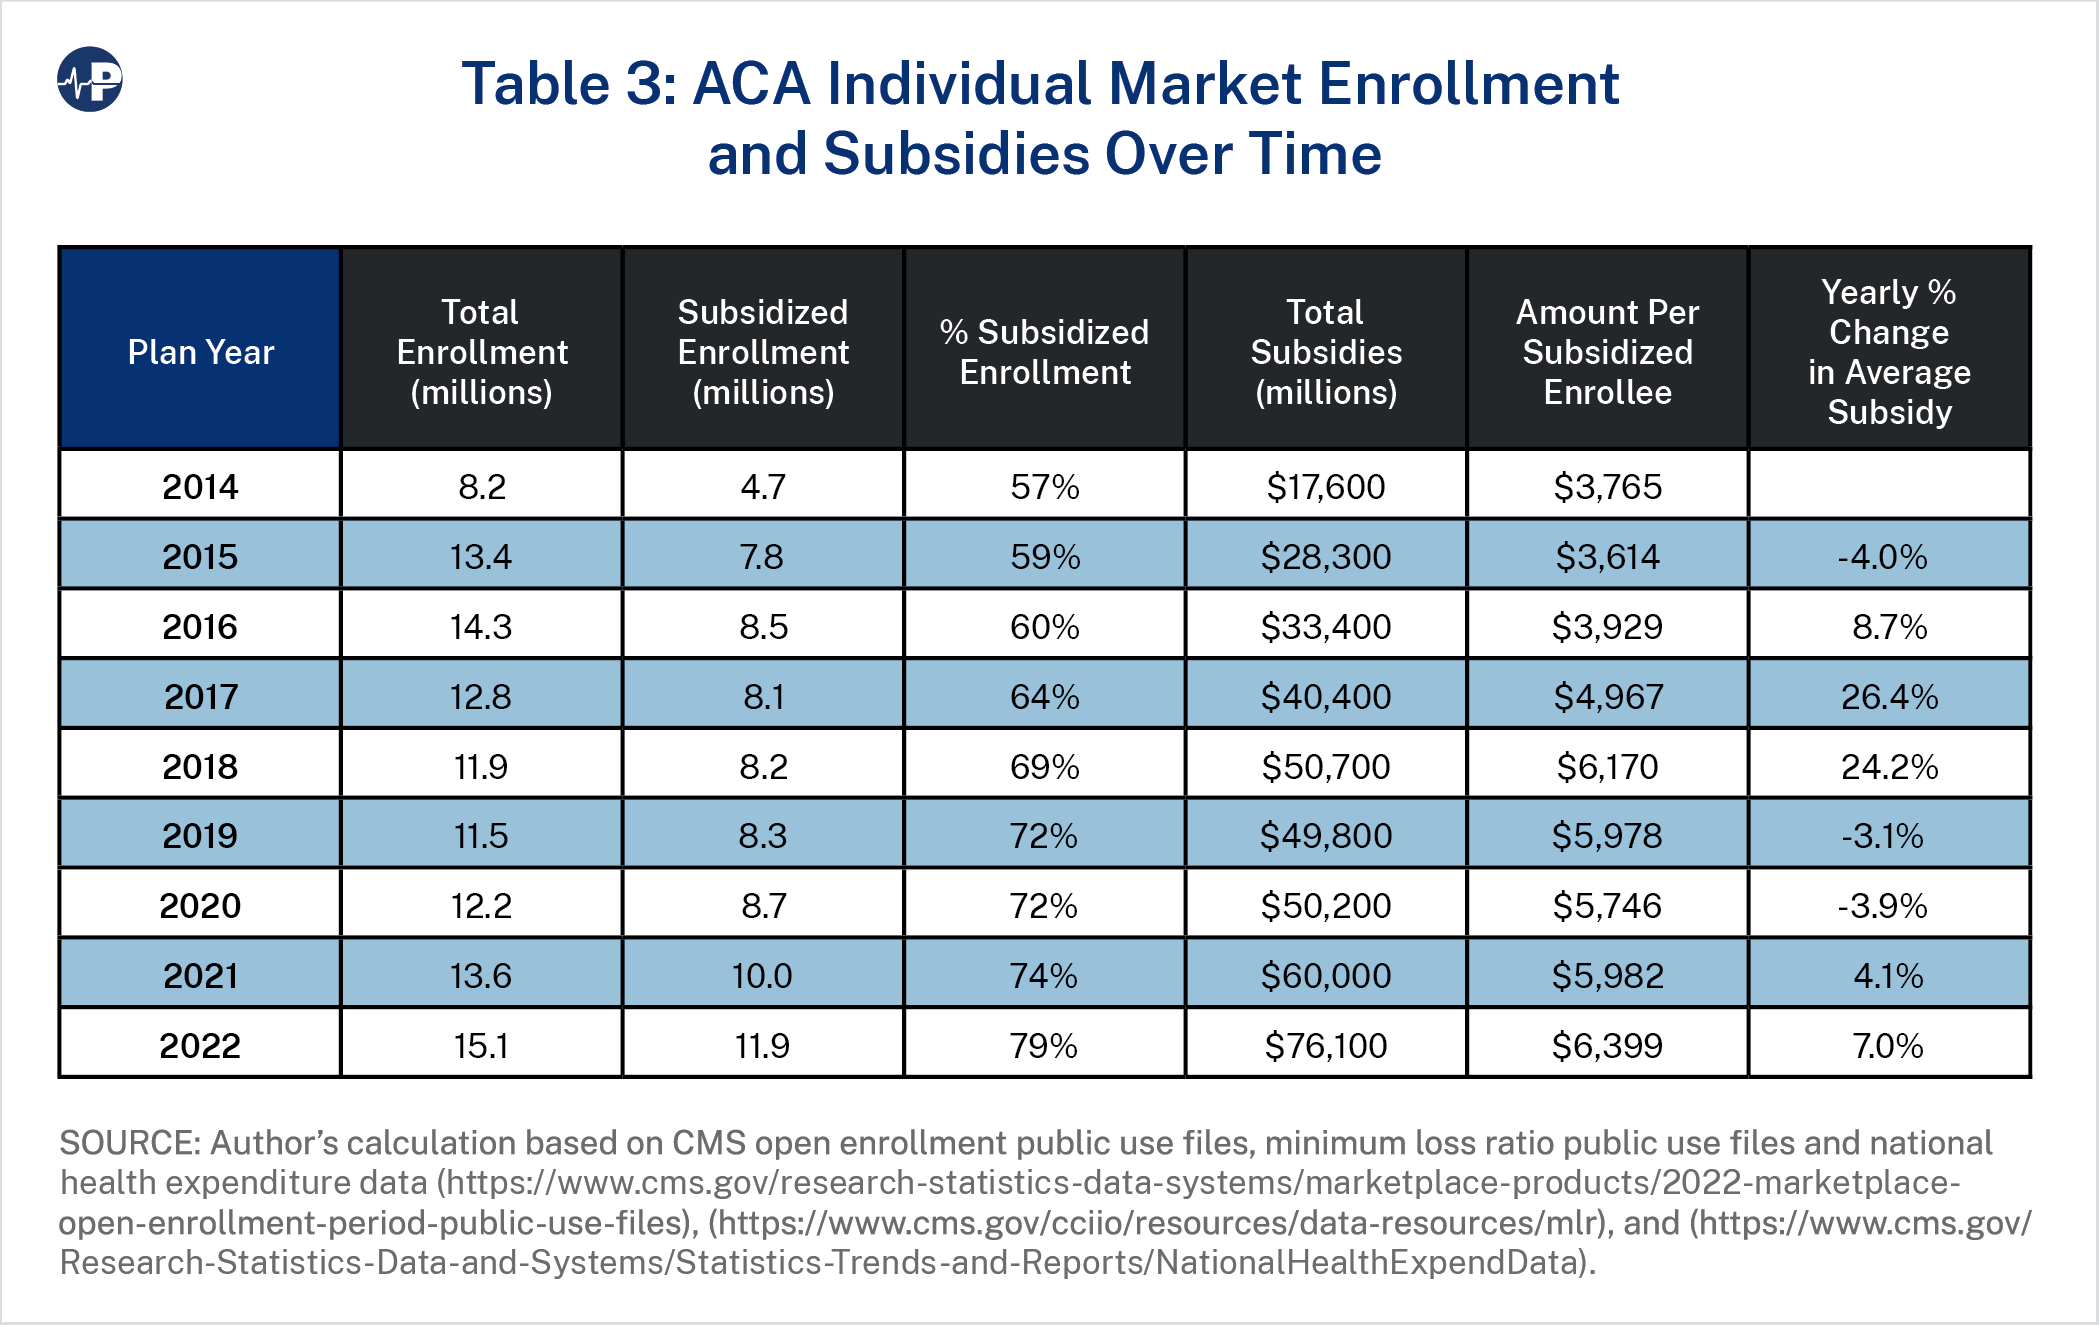
The impact of CSR defunding and enhanced subsidization through the ARPA increased per-enrollee taxpayer funding far beyond the original intent of the ACA. While total enrollment generally increases when subsidies are increased, additional federal spending has had diminishing returns. While the CBO projected that the individual market would have approximately 40 million members by 2021, total enrollment is about 19.8 million people despite an approximate 45 percent increase in average subsidies due to policy actions post-ACA implementation.
Meanwhile, unsubsidized middle- and upper-class families are forced to pay the full cost of plans and have limited options outside of the individual ACA market, resulting in minimal overall non-group enrollment gains due to the ACA. Table 3 displays the total ACA market enrollment,24 the amount of federal spending, and the changes in spending per subsidized enrollee over time.
Figures 7, 8, and 9 display the history of premium subsidization levels for a 50-year-old
average consumer earning 300 percent FPL (Figure 7), 150 percent FPL (Figure 8) and 500
percent FPL (Figure 9). The three major changes in subsidy levels include (1) large increases in premiums reflecting price corrections in initially underpriced markets in 2017,25 (2) higher
silver actuarial values resulting from the defunding of CSRs in 2018, and (3) the enhancement
of premium subsidies under ARPA in 2021. To quantify the policy implications of CSR
defunding and ARPA-enhanced subsidies, three scenarios were measured.
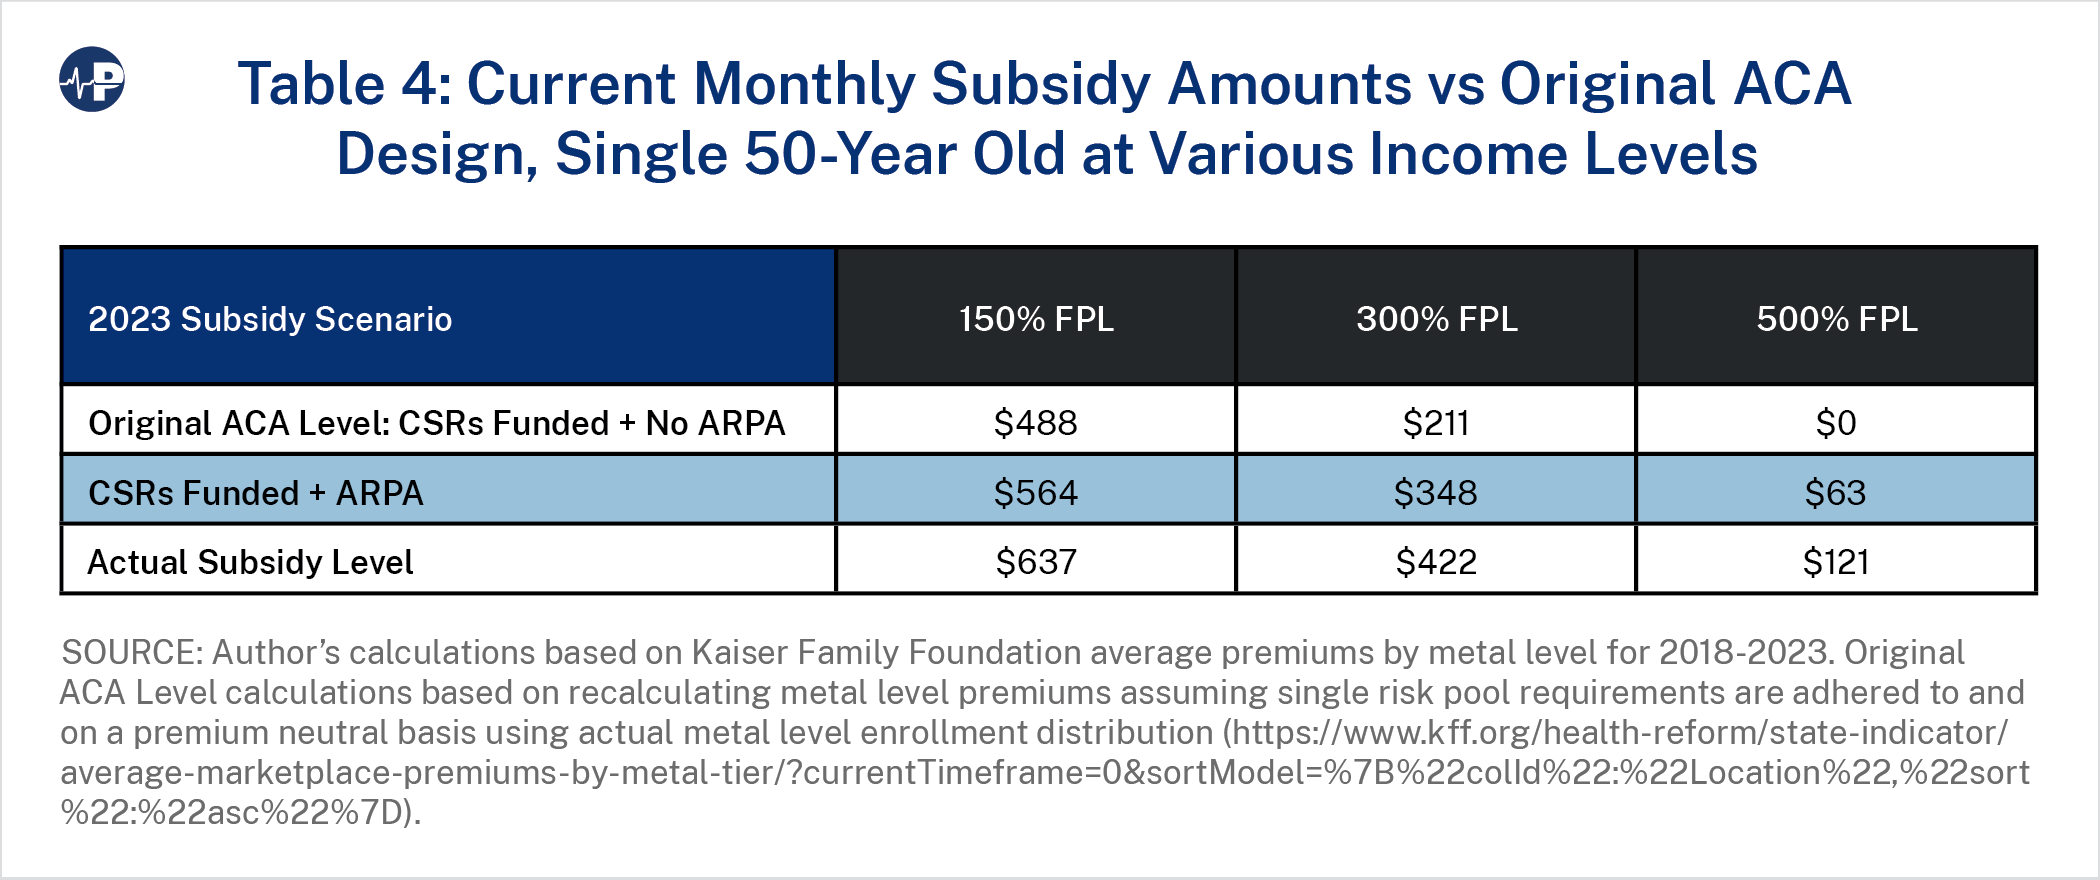
- Original ACA Level: CSRs Funded + No ARPA: This reflects the amount of per-member-per-month subsidies that would have existed throughout time if CSRs were funded and there were no ARPA-enhanced subsidies.
- CSRs Funded + ARPA: This reflects the amount of per-member-per-month subsidies, including ARPA-enhanced subsidy amount, that would have existed throughout time if CSRs were funded.
- Actual Subsidy Level with ARPA and without CSR Funding.
Figures 7-9 illustrate the large increases in per-member subsidization and demonstrate how the increase in subsidies varies significantly among income levels. For lower income levels, the impact of CSR defunding and ARPA-enhanced subsidies is roughly the same, while for higher-income consumers, the impact of ARPA-enhanced subsidies is greater than the impact of CSR defunding. The differences in impact are related to the income-based, price-linked nature of subsidy calculations and the variation in proportion of subsidy levels to gross premiums at different income levels. On the federal exchanges in 2022, approximately 58 percent of subsidized enrollees received CSR benefits.26
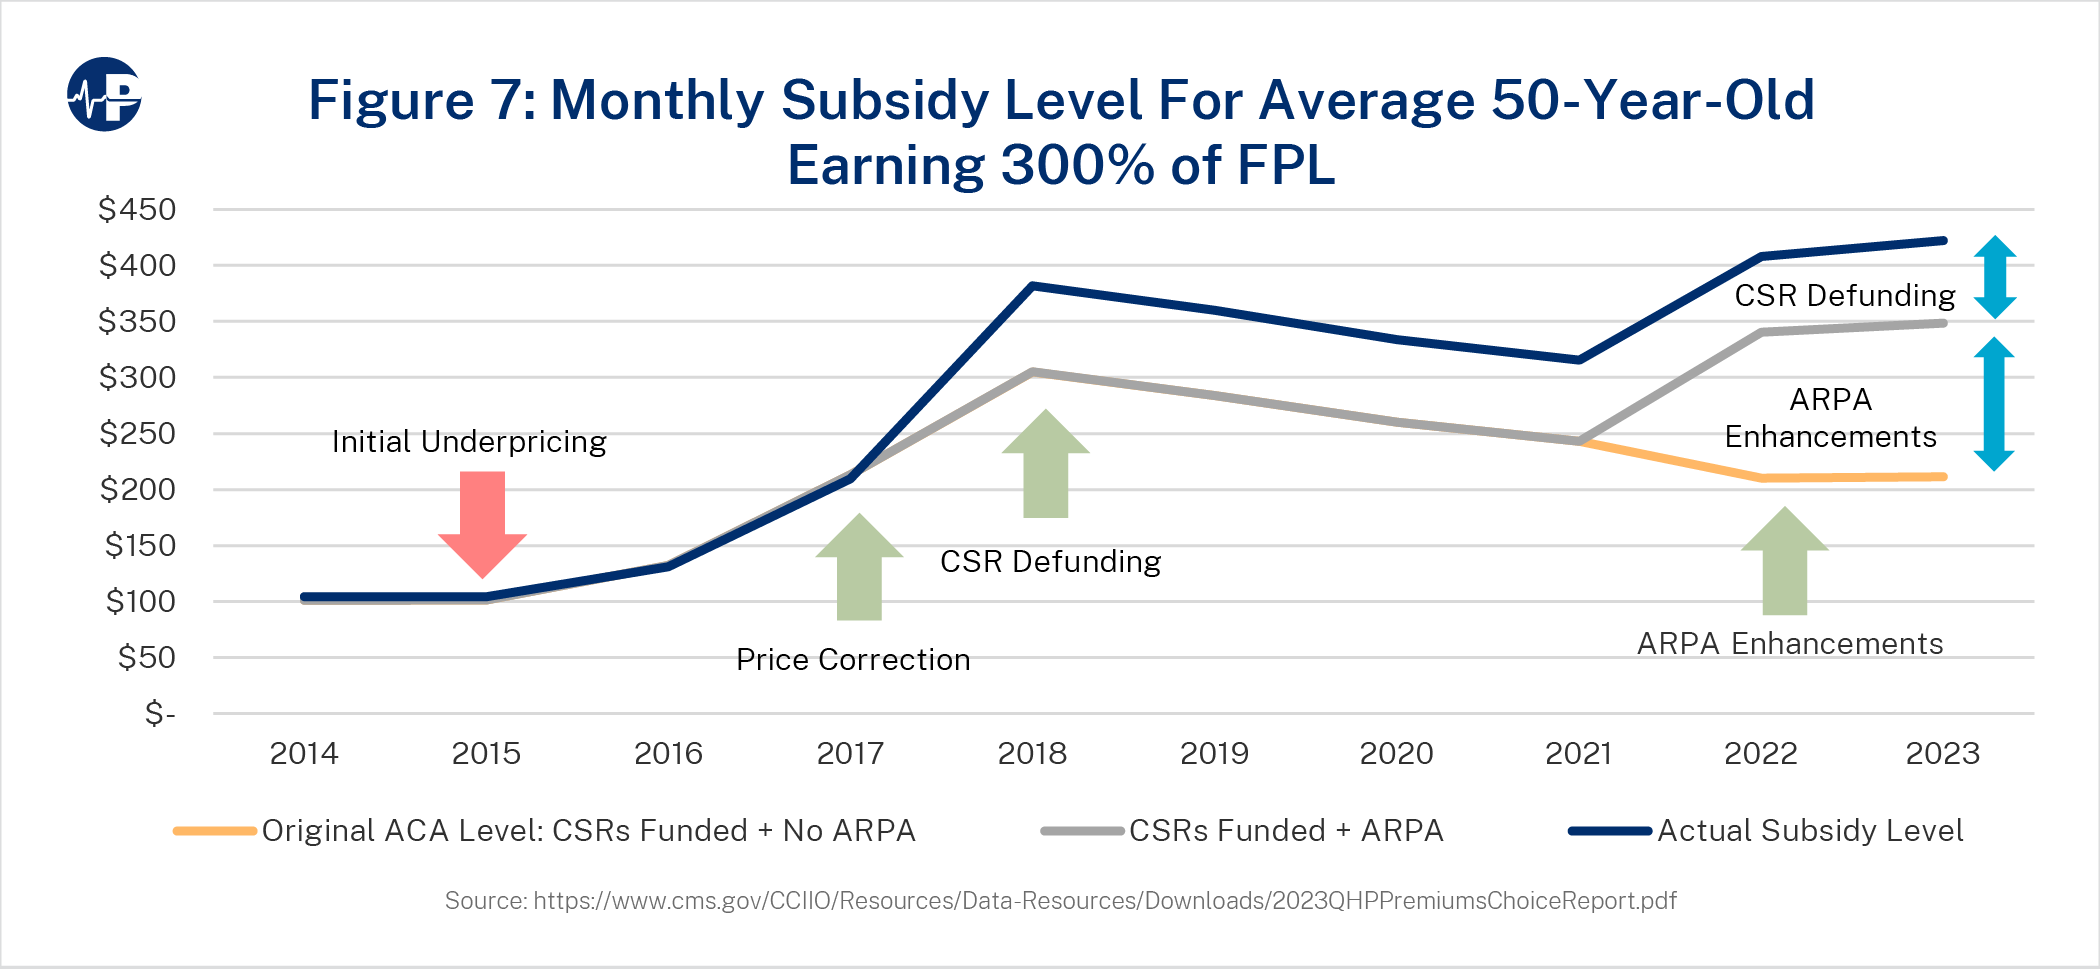
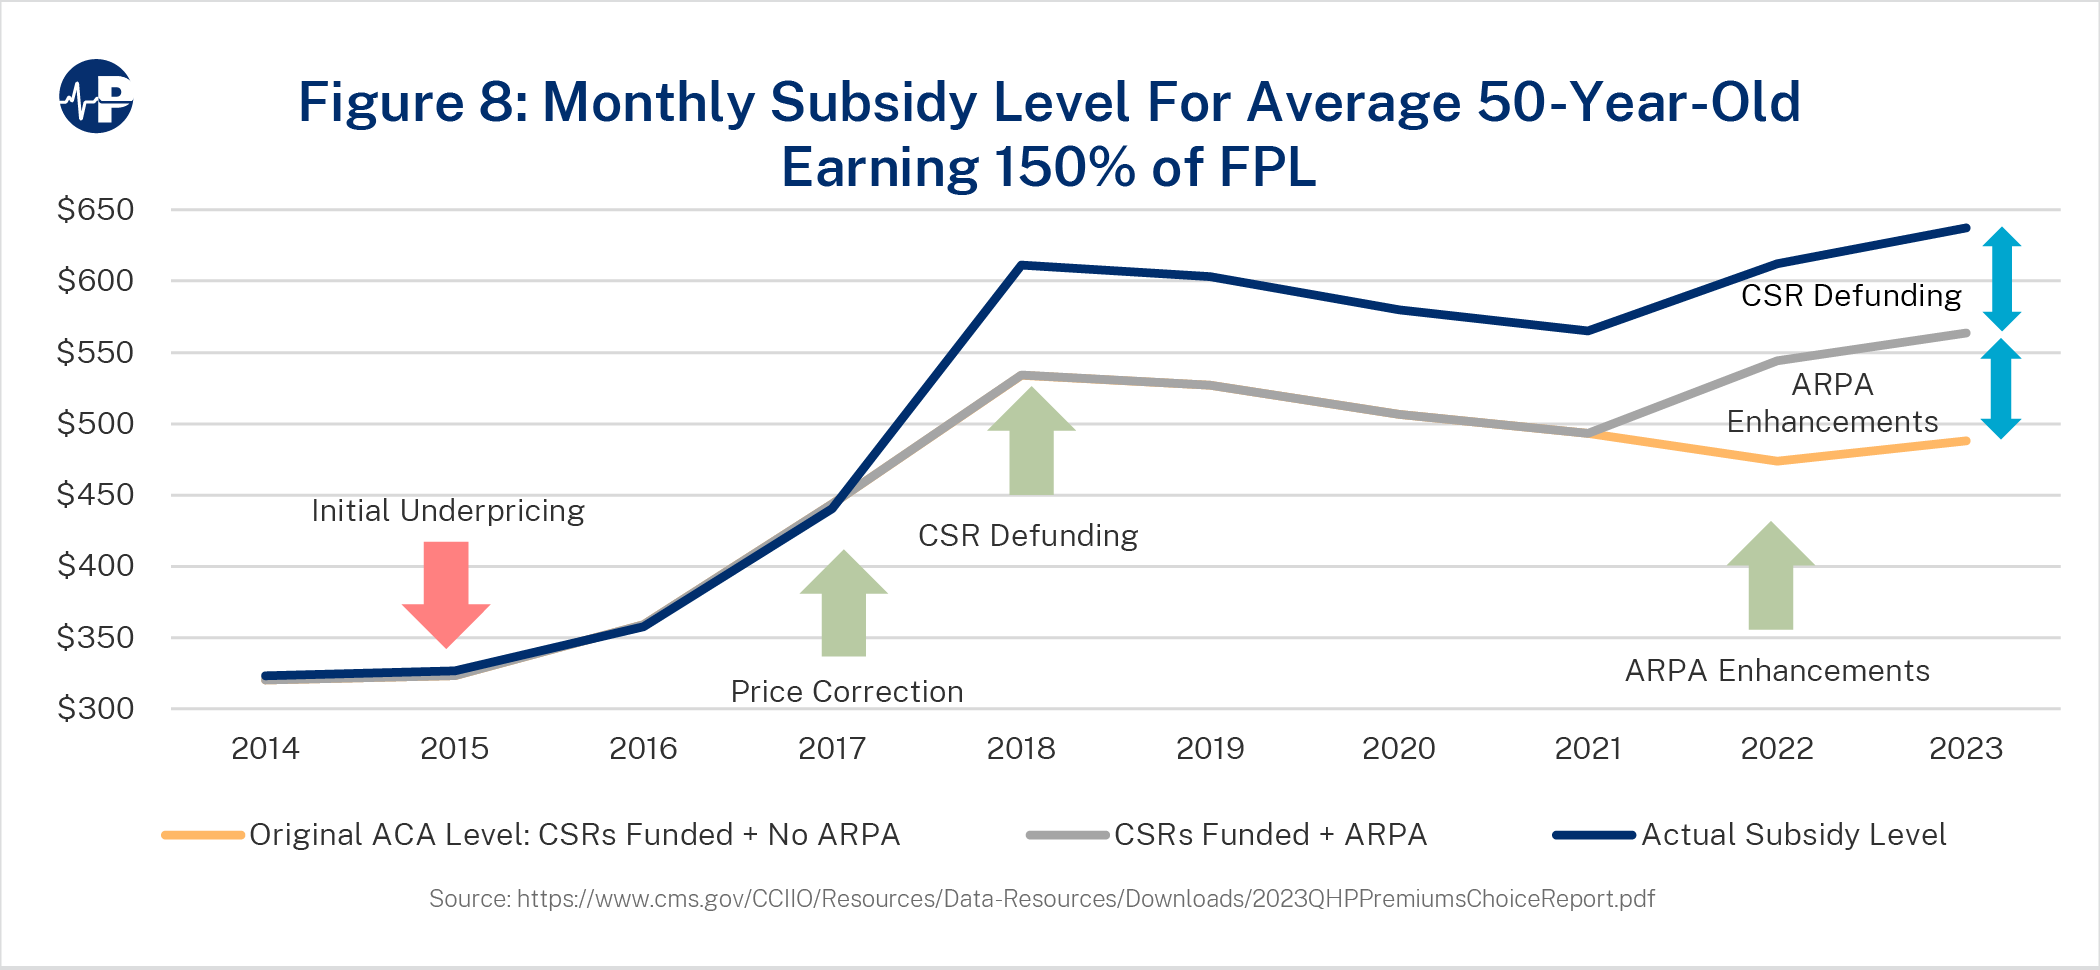
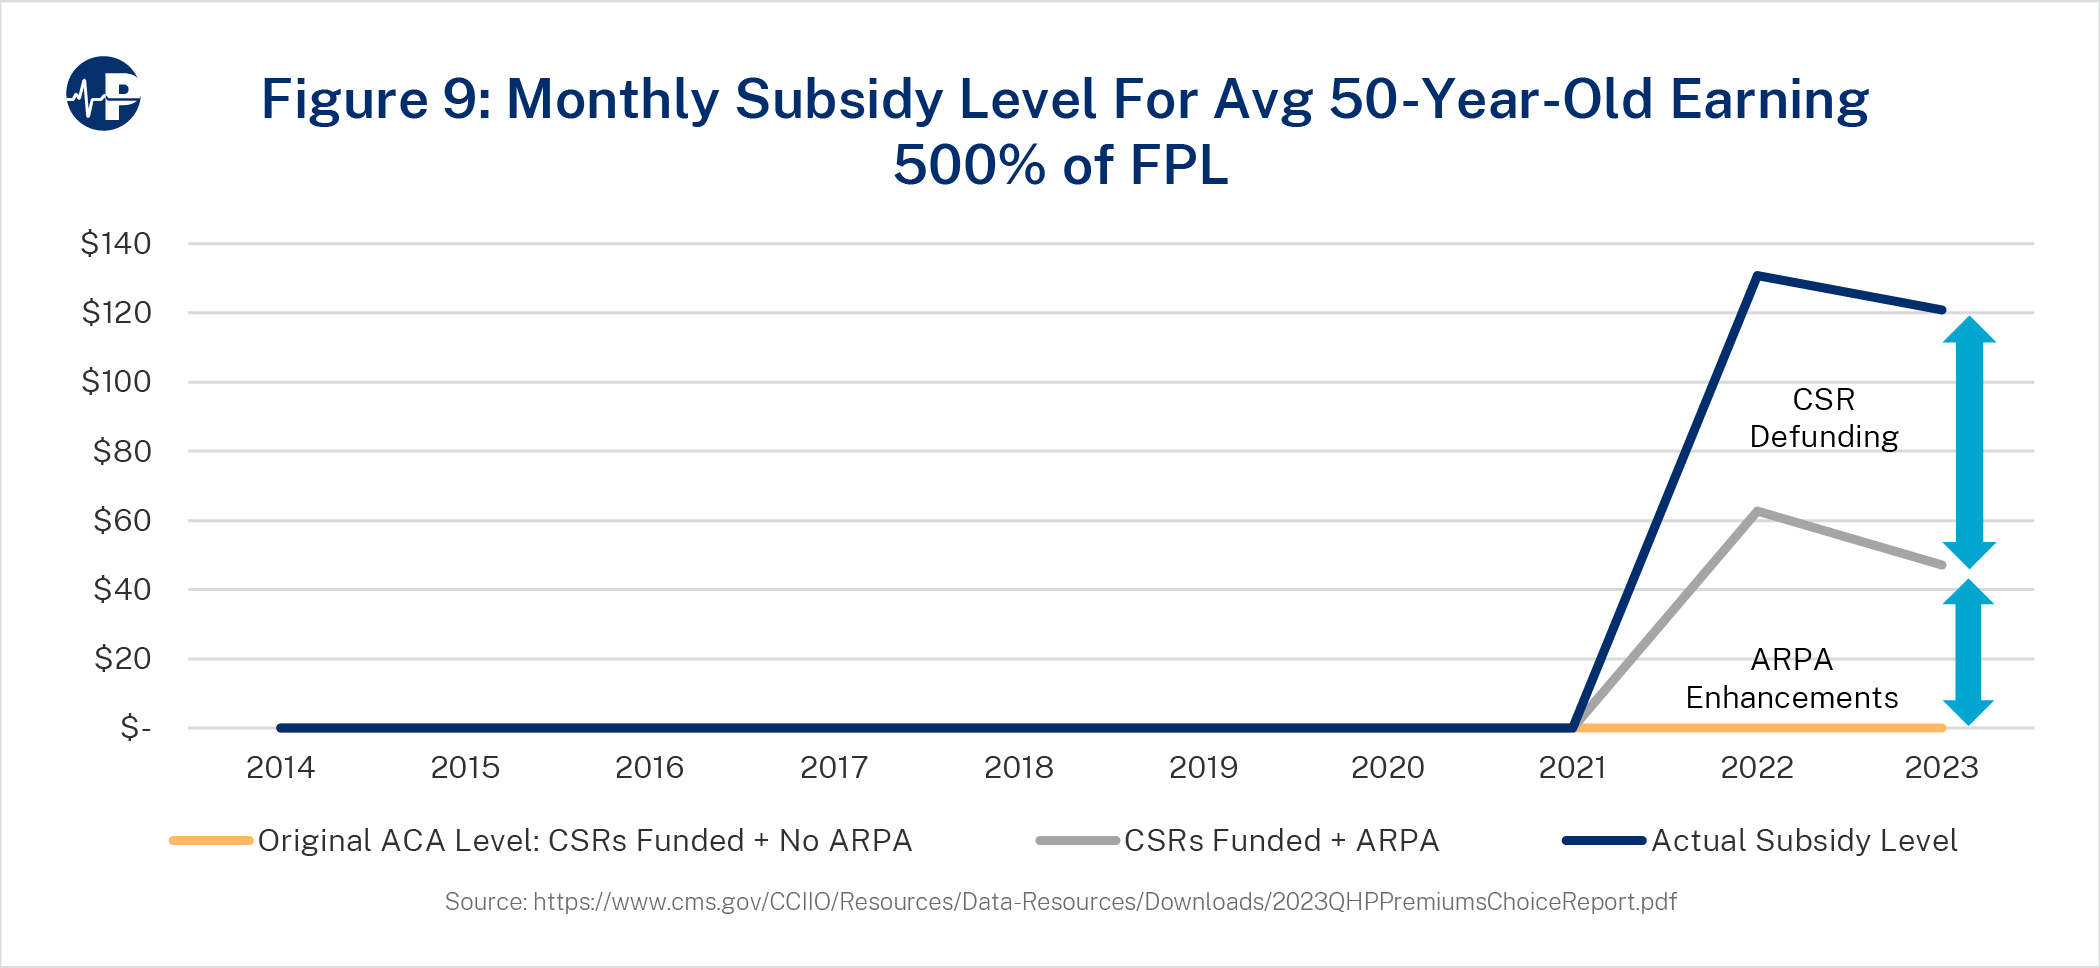
Figure 7 shows the value of the amount of the ACA subsidy over time, accounting for specific policy changes. The bottom line is the baseline projection, which reflects subsidy levels without post-ACA expansions. The baseline subsidy organically grew with high premium increases in 2017. In 2018, the policy impact of CSR defunding, combined with continued premium increases, significantly increased subsidy levels. The subsidy level increased from about $200 to almost $400 in 2018, almost evenly split between the CSR defunding impact and organic premium growth. The environment of insurers exiting markets and premiums increasing reversed with CSR defunding. From 2019 to 2022, benchmark premiums declined, and insurer participation grew each year.27 In 2023, the baseline subsidy is $211, and it increased by $137 for ARPA enhancements to arrive at $348. The CSR defunding impact is $74, and the total subsidy is $422—exactly twice the level of original ACA policy. Figures 8 and 9 show similar dynamics for a 50-year-old at 150 percent FPL and 500 percent FPL, with Figure 9 reflecting the ARPA expansion of subsidies beyond 400 percent FPL.
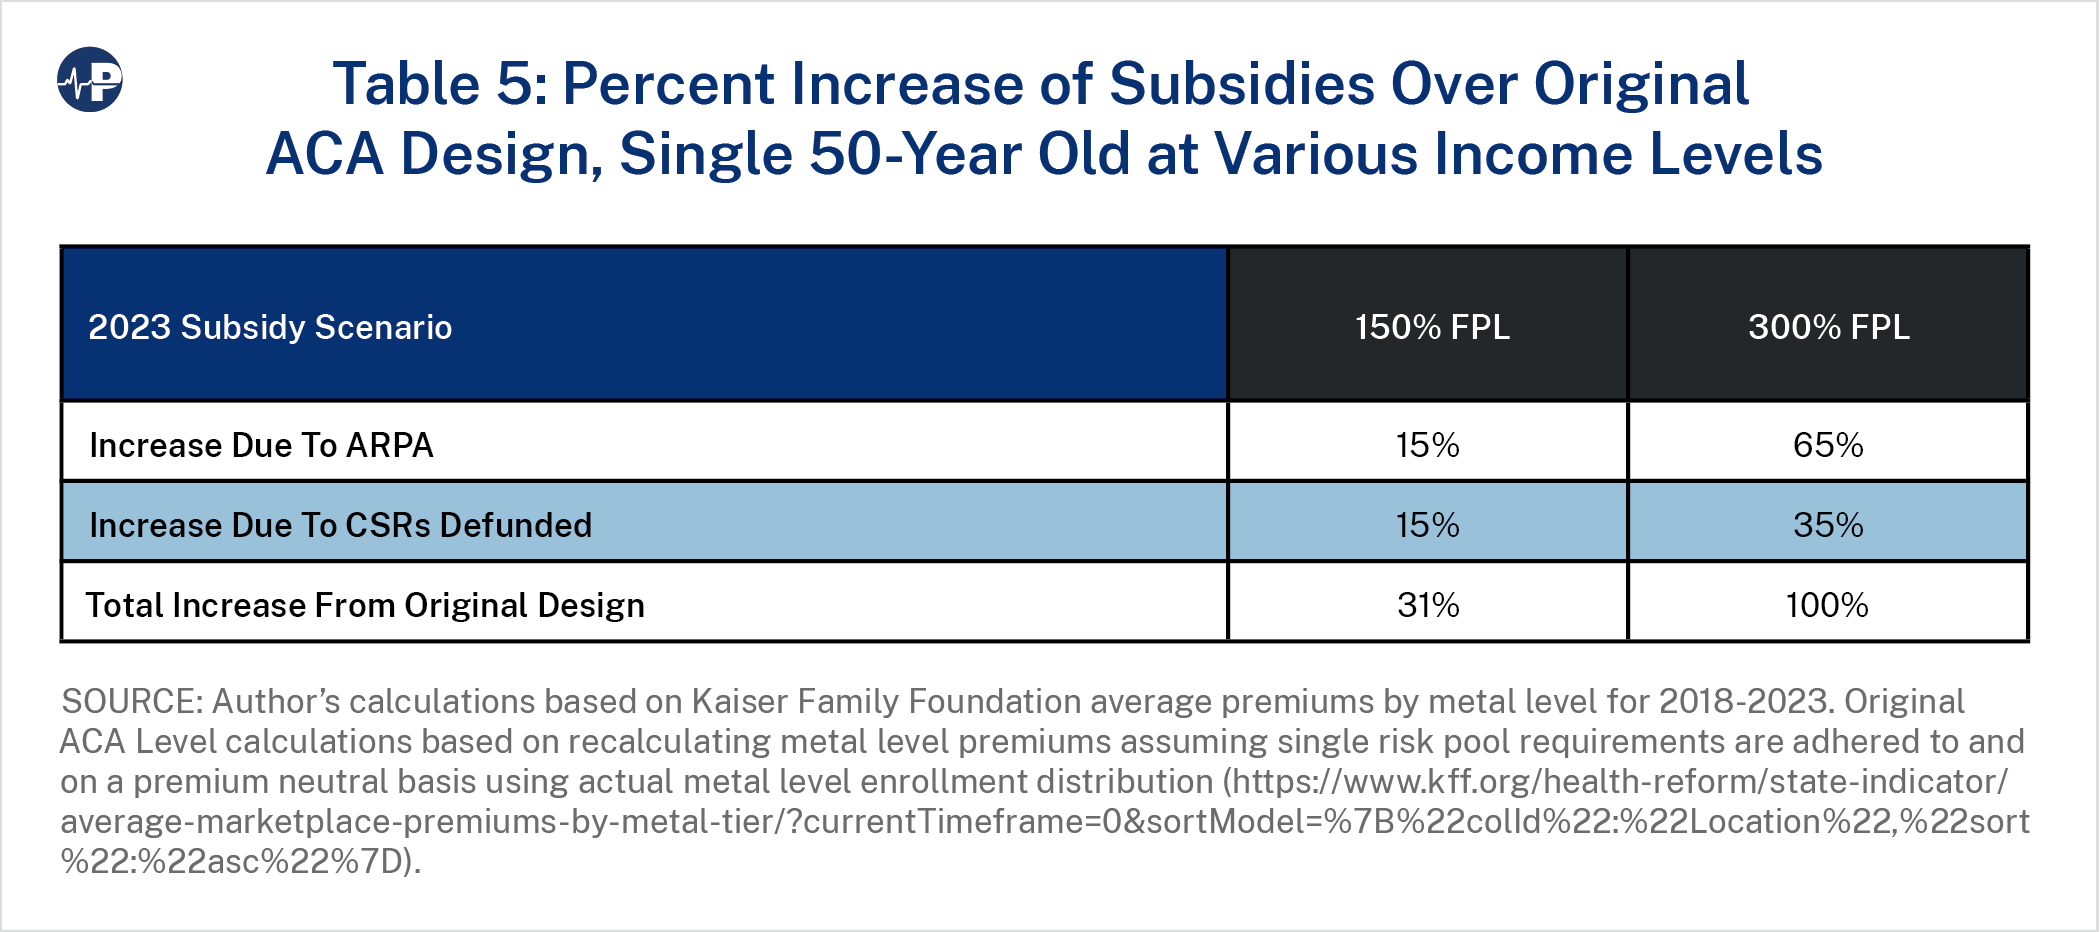
Tables 4 and 5 display the 2023 subsidy levels and the percentage change over the original ACA design, respectively. The ARPA impact varies significantly between an individual earning 150 percent FPL and an individual earning 300 percent FPL with ARPA providing much greater benefit to the individual at the higher income level.
POLICY CHANGES IMPACT
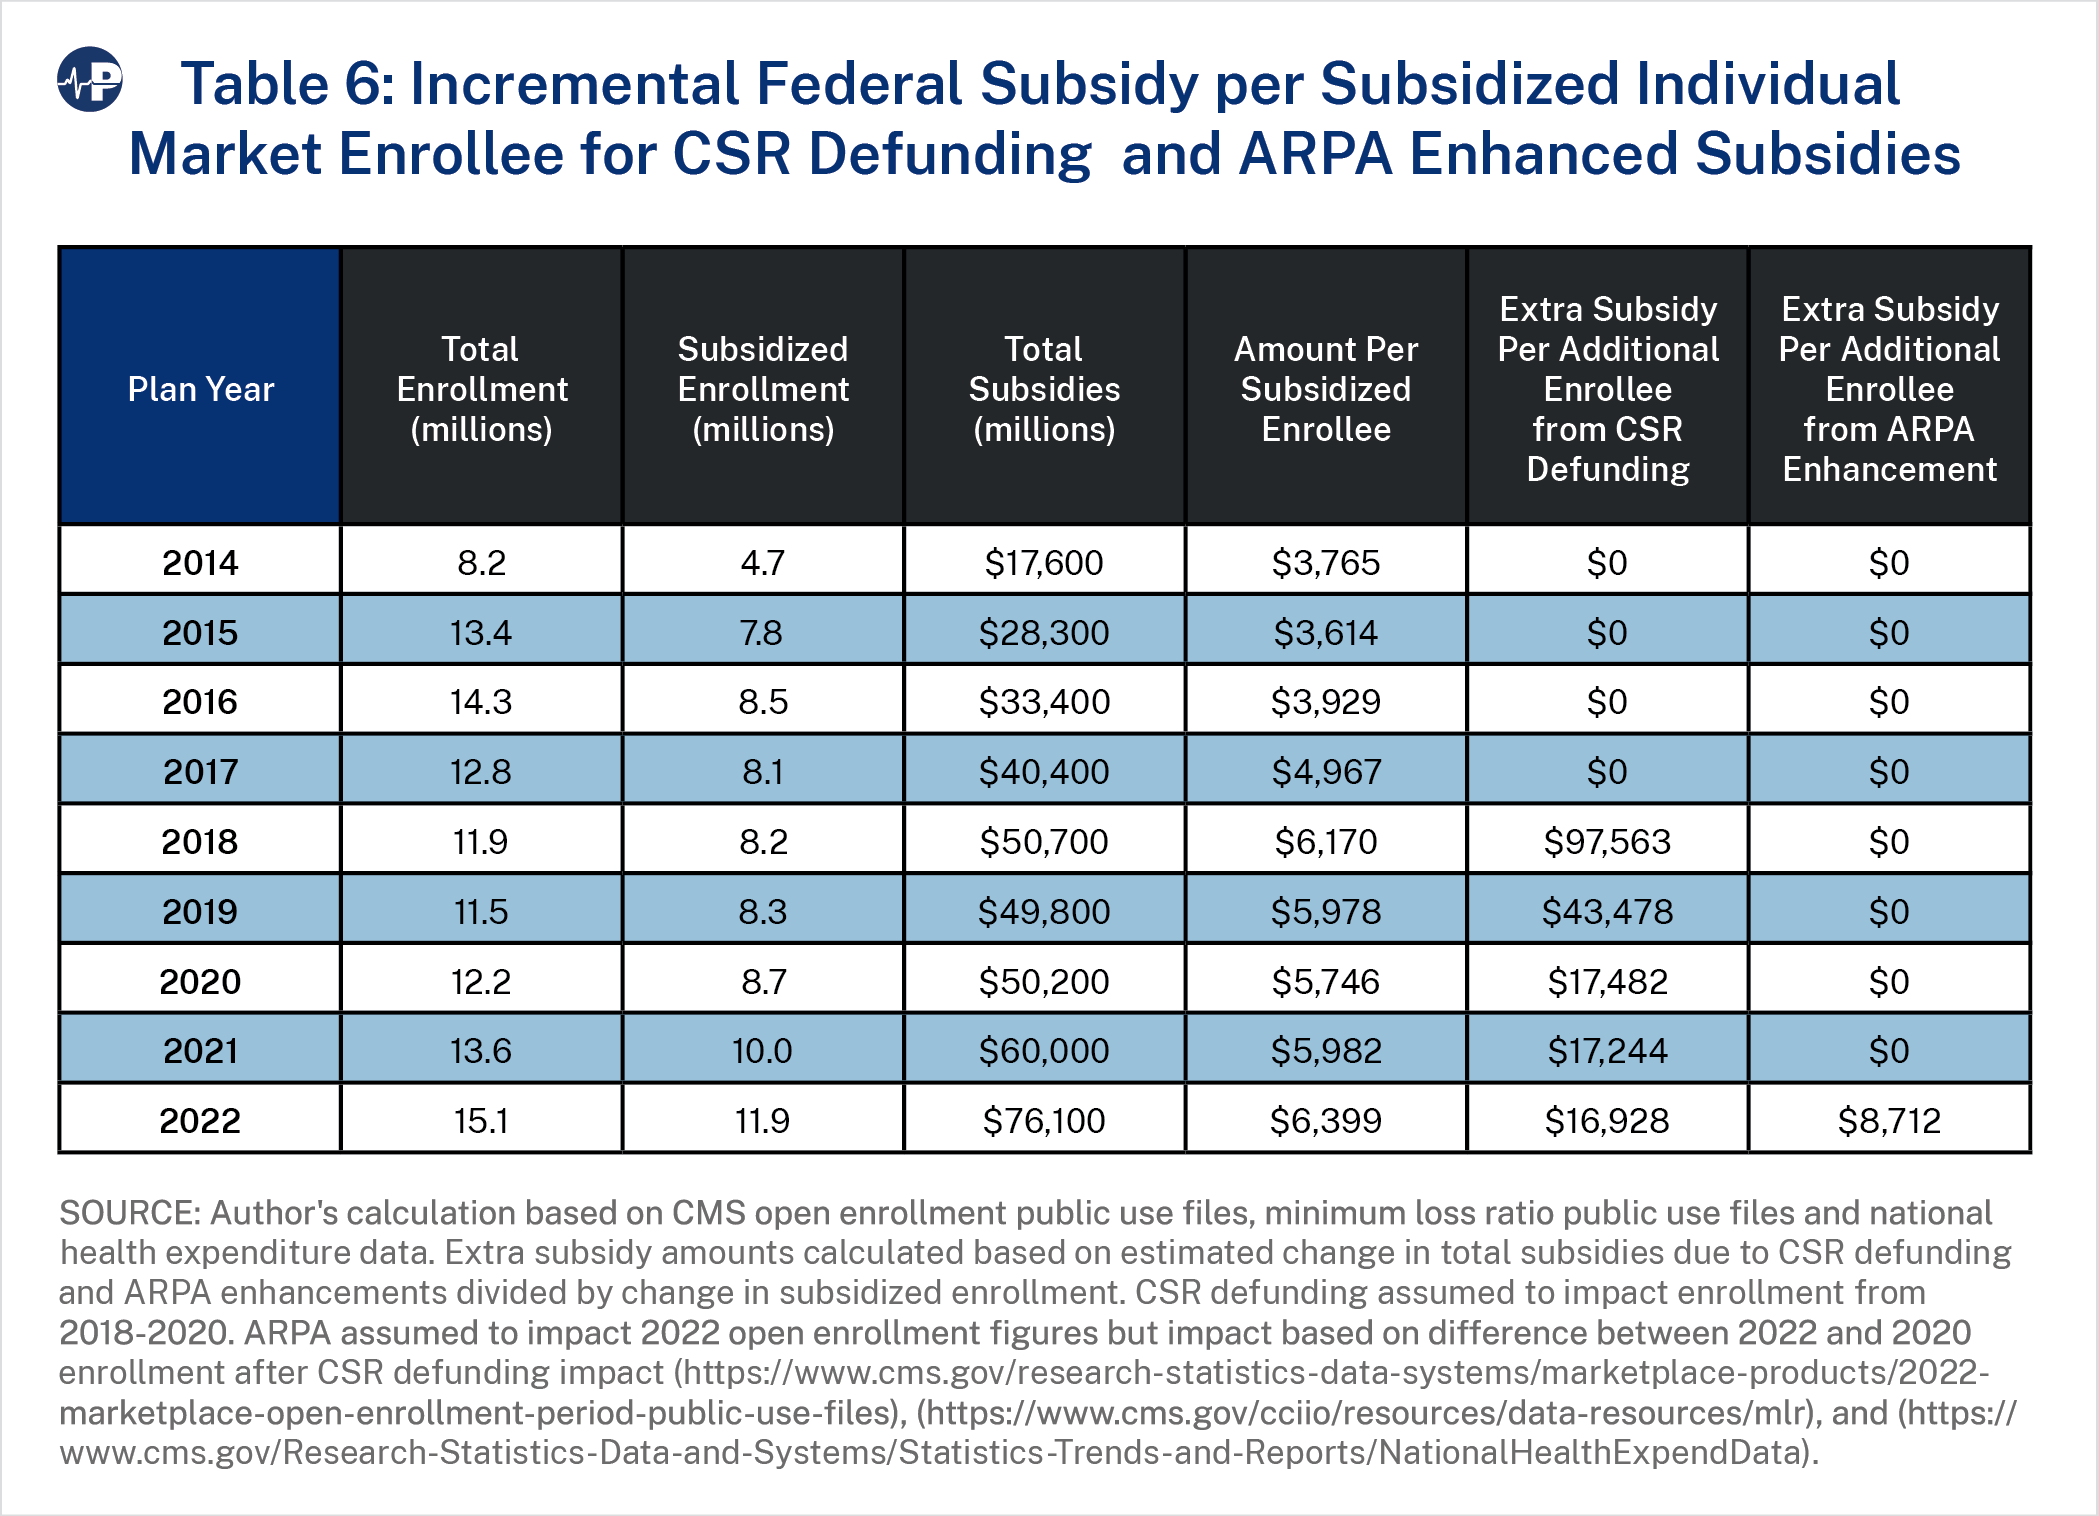
We analyzed the impact of policy changes that had a material impact on federal subsidies by measuring the increase in subsidized enrollment relative to the increase in federal spending due to applicable policies. Table 6 shows the incremental federal spending per subsidized enrollee between the CSR defunding response and the ARPA-enhanced subsidies. The table measures the increase in total federal spending (accounting for expected changes in spending without the policy change) divided by the increase in subsidized enrollment during the time period of each policy change. Subsidized enrollment was measured to compare the two policies, as total enrollment (subsidized and unsubsidized) would be difficult to compare given the decrease in total enrollment from 2017 to 2020. The federal government spent $35.7 billion more in 2022 than in 2017 to enroll just 2.3 million additional people in the ACA
individual market.
- The CSR defunding impact results from the change in metal level premium relationships after the federal government stopped reimbursing insurers for CSR payments. The silver and gold tiers were developed to provide an actuarial value28 of 70 percent for silver plans and 80 percent for gold plans. Low-income enrollees who select silver plans are eligible for enhanced benefits (or reduced cost-sharing, i.e., CSRs), with the AV for silver increased to 94 percent for enrollees under 150 percent of FPL, 87 percent for 150-200 percent FPL, and 73 percent for 200-250 percent FPL. Because this benefit enhancement was funded by the federal government, insurers priced silver plans at 70 percent actuarial value to reflect their true liability. After CSR payments were defunded in October 2017, insurers responded by raising silver premiums to account for their new financial responsibility of a higher actuarial value. The general impact of this dynamic is that silver plan premiums rise, as do premium subsidies since they are calibrated to the second lowest-cost silver plan. As silver plan premiums increase while other metal level premiums do not, consumers have lower net premiums, as gross premiums do not rise but premium subsidies do.
- By 2020, the response to CSR defunding, which some call “silver loading,”29 helped increase ACA-subsidized enrollment by 500,000 people while costing an additional $10.5 billion (2017 levels of subsidization are assumed to equate to $39.7 billion by 2020 given inflation and expected premium changes).
- By 2022, we estimate that the federal government expended $16,928 per additional subsidized enrollees due to the CSR defunding response.
- By 2022, we estimate that the ARPA-enhanced subsidies helped increase subsidized enrollment by 3.2 million enrollees by spending an additional $25.9 billion. (We assumed that 2020 levels of subsidization would have equated to $48.6 billion by 2022 given inflation and expected premium changes.) For 2022, we estimate that the federal government spent $8,712 per additional subsidized enrollees due to the ARPA-enhanced subsidies.
- Both policy changes increased the average taxpayer cost per subsidized enrollee. Before implementation, Blase projected that 75 percent of the ARPA subsidy spending would flow “to people who have coverage and largely replaces private spending with government spending.”30
- ARPA subsidy enhancements were significantly less inefficient than the defunding of CSRs, partially because ARPA decreased minimum contribution percentages to 0 percent for the population under 150 percent FPL, marginally increasing premium subsidies while incentivizing enrollment with free coverage. Prior research indicates that “the availability of zero-dollar premium plans in the ACA Marketplace had a strong effect on potential enrollees’ decisions to become insured, particularly in the case of lower-income enrollees.”31
REGULATORY ENFORCEMENT IMPACT
A cornerstone of the so-called ACA consumer protections was the single risk pool requirement, which broadly meant that consumers would receive “community rates” that would not vary based on their health status. On a logistical level, the single-risk pool requirement does not allow health insurers to segment enrollees by risk or vary plan premiums based on the unique characteristics of the expected enrollment in each plan. This meant that differences in prices between plans and metal levels would strictly reflect the benefit differences of the plans and not the characteristics of the expected enrollees in each plan. 32
These rules disallowing risk segmentation have significance for consumers, as their net premiums are the difference between the premiums for the plans they select and the subsidies they receive, which are based on the benchmark plans. It is well documented that “premium misalignment” violations of the single risk pool are widespread and have resulted in higher consumer net premiums and lower federal spending.33
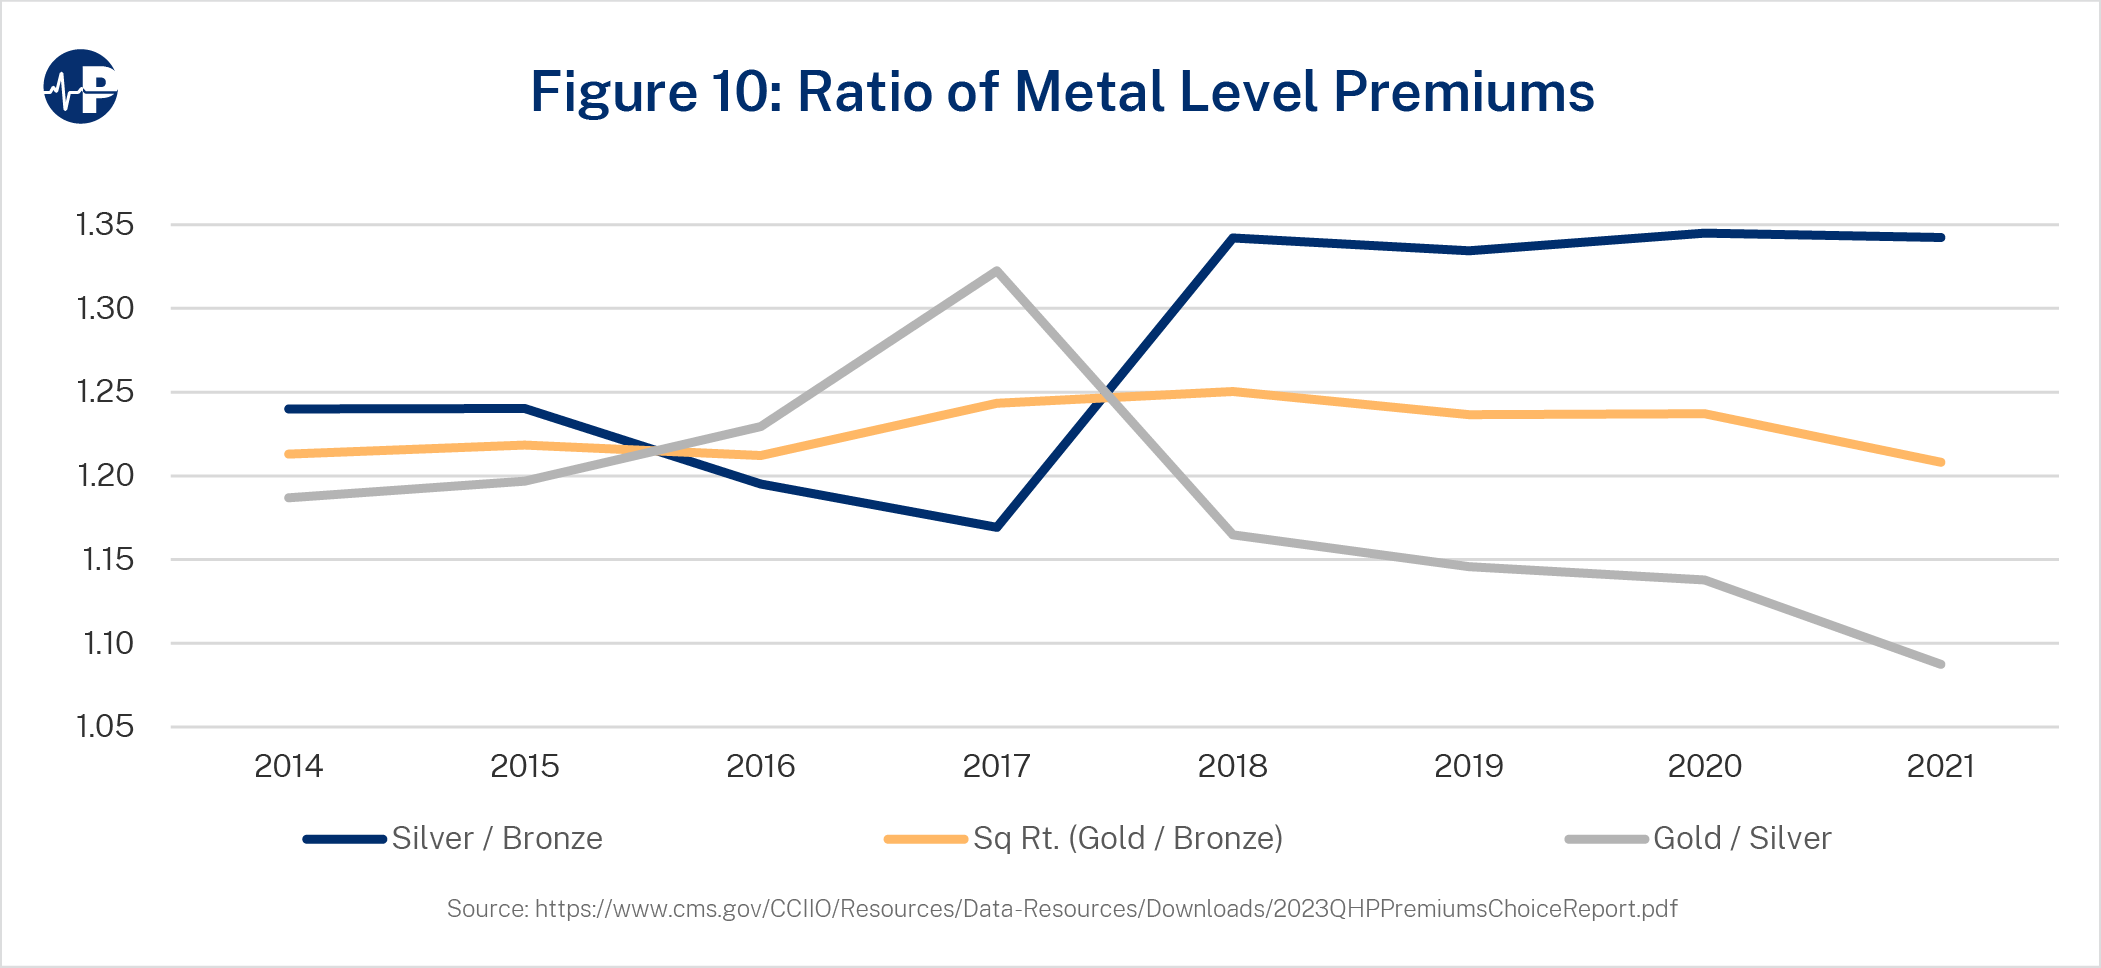
The impact of both premium misalignment34 and CSR defunding is demonstrated in Figure 10, which shows the ratio of premiums among metal tiers. These ratios were intended to be consistent, meaning that horizontal lines were generally expected when the ACA was implemented. In 2016 and 2017, bronze and gold premiums rose relatively faster than silver premiums as insurers incorporated specific metal-level experience into plan-level adjustment factors.35 In 2018, while prior year premium misalignment remained inherent in the premium rates, the increase in silver actuarial values resulting from CSR defunding more than offset the premium misalignment impact, and silver premiums and premium subsidies rose accordingly.
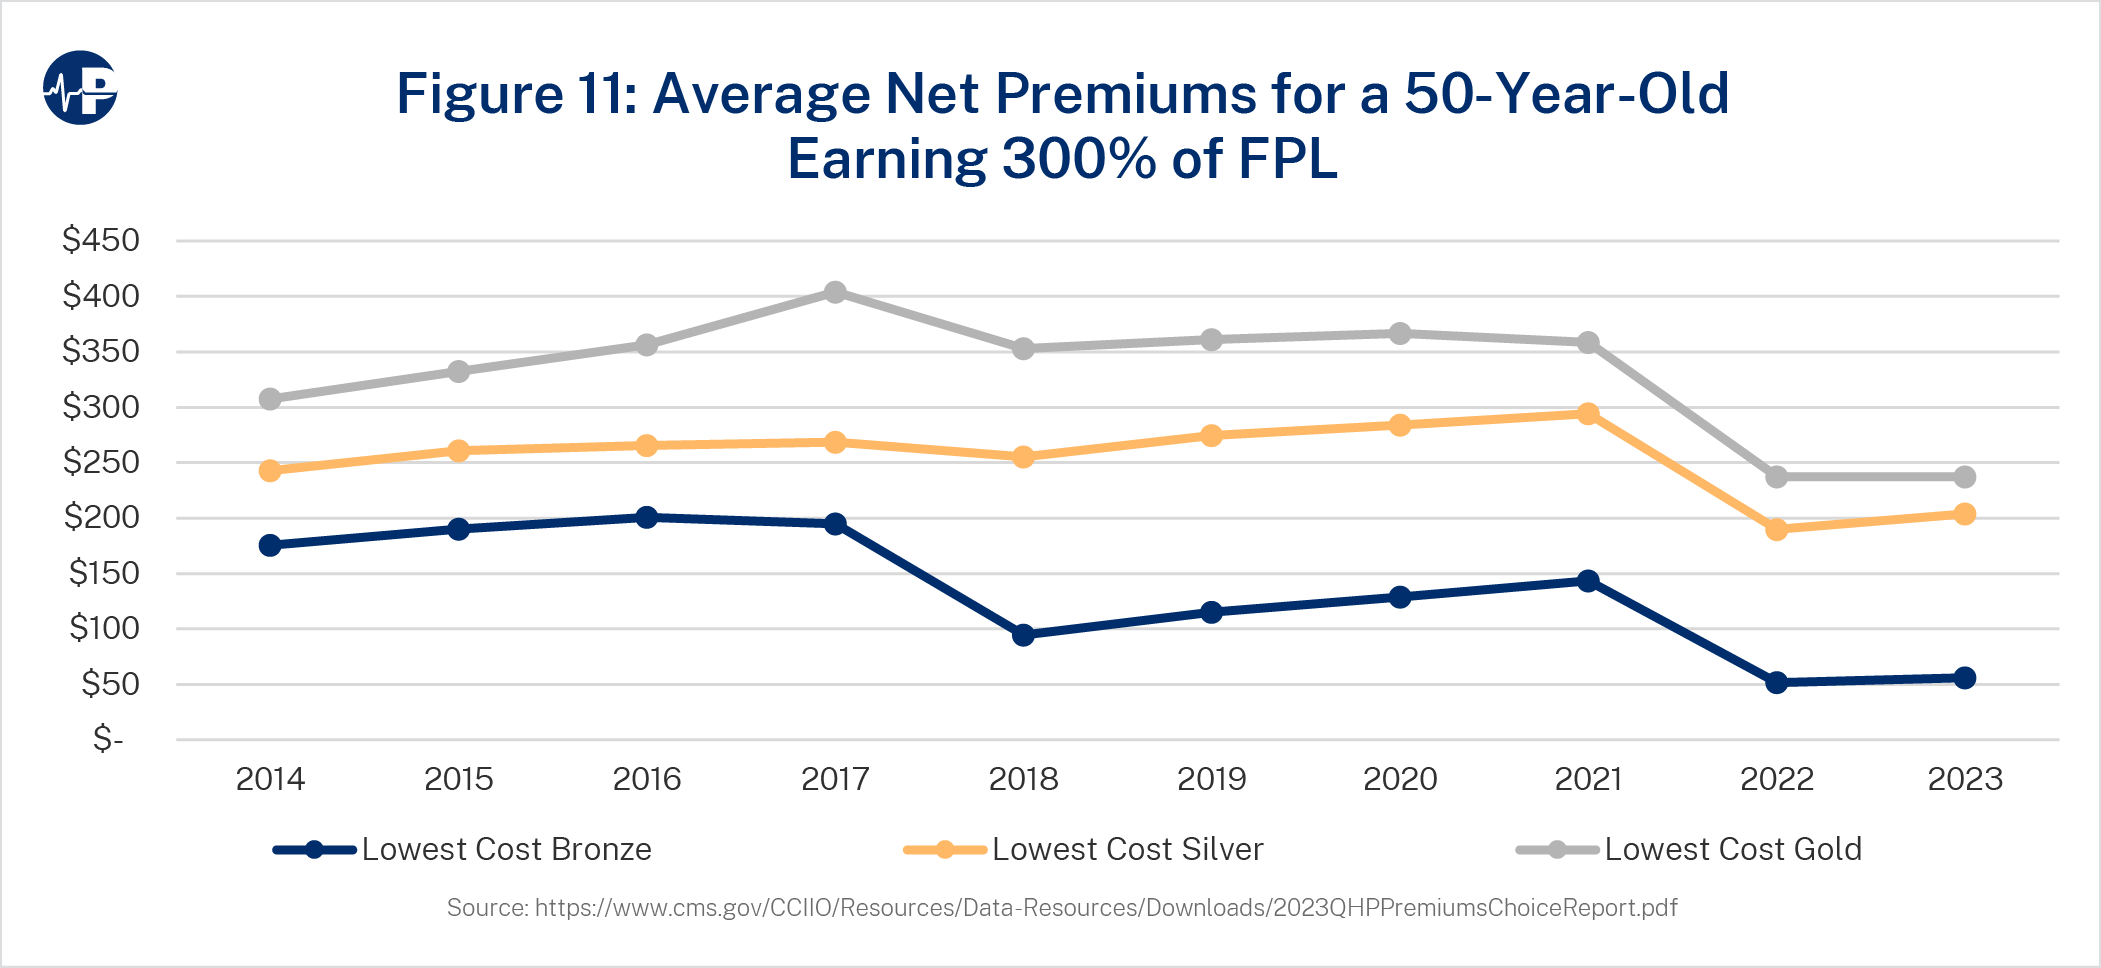
The varying impact on metal level net premiums can be seen in Figure 11, which shows the lowest cost net premiums at different metal levels over time for a 50-year-old earning 300 percent FPL. Breakpoints in 2018 and 2022 reflect higher taxpayer spending and lower enrollee spending resulting from CSR defunding and ARPA-enhanced subsidies, respectively.
From a fiscal standpoint, the policy changes impacting ACA exchanges have led to an increase in the cost per subsidized enrollee. The ARPA-enhanced subsidies are generally less inefficient than the response to CSR defunding due to the non-linear impact36 of free coverage eligibility for enrollees under 150 percent FPL. While effective on a pure enrollment basis, there are potential adverse implications with “free plans,” as consumers may be less connected to enrollment decisions and may even be unaware of enrollment without associated financial responsibility.37
RECOMMENDATIONS AND OTHER FACTORS FOR POLICYMAKERS TO CONSIDER
Policymakers aiming to enhance ACA efficiency may consider reversing some of the recent ACA policy changes. Congress could restore CSR funding, but this might also be an administrative decision. Under current law, President Obama allowed CSR funding, President Trump allowed CSR funding until receiving a legal recommendation from the Justice Department in October 2017,38 and President Biden has not allowed CSR funding. The enhanced subsidies in the ARPA were scheduled to expire in 2022 but were extended through 2025 in the Inflation Reduction Act. Renewal of these enhanced subsidies is expected to be a policy discussion in 2025, if not sooner.
On the other hand, federal policymakers have less influence on state-level rating compliance enforcement, which will mechanically increase premium subsidies. While unfortunately characterized by some as an effort to “achieve policy goals,”39 state efforts to enforce premium alignment is better understood as enforcing compliance with federal law. Policymakers should recognize that state adherence to the ACA’s single risk pool requirements will likely follow greater public awareness of regulatory noncompliance.40 Policymakers should comprehend the developing premium, subsidy, and efficiency implications of increased regulatory compliance when considering policy modifications.
Problematically during a period when ongoing changes in premium subsidy levels are not well understood,41 it is recognized that policy considerations “do not skillfully complement current law, as the impact of current law is still developing and is quite fluid.”42 For example, the general impetus for the ARPA enhancements was a contention by some policymakers that ACA subsidies, developed under a “deficit neutrality” constraint, were too low. As premium subsidy enhancements due to state rating compliance enforcement are not widely communicated, many policymakers are likely unaware of the underlying changes that will increase subsidy levels and overall federal spending. Unanticipated rating compliance enforcement after the ARPA could potentially duplicate policymakers’ intention of increasing subsidies and render legislation redundant.
Logically, policymakers’ subjective assessments of the adequacy of subsidy levels are based on market experience. As premium misalignment skewed dynamics, federal spending was suppressed, and historical enrollment was accordingly lower than it would have been in a compliant environment. With aligned premiums in each market, assessments of market condition and federal spending associated with current law would be more accurate and better inform policy decisions. As more states enact premium alignment and comply with the ACA’s single risk pool requirement, policymakers may have a better view of current law implications when ARPA-enhanced subsidies expire in 2025.
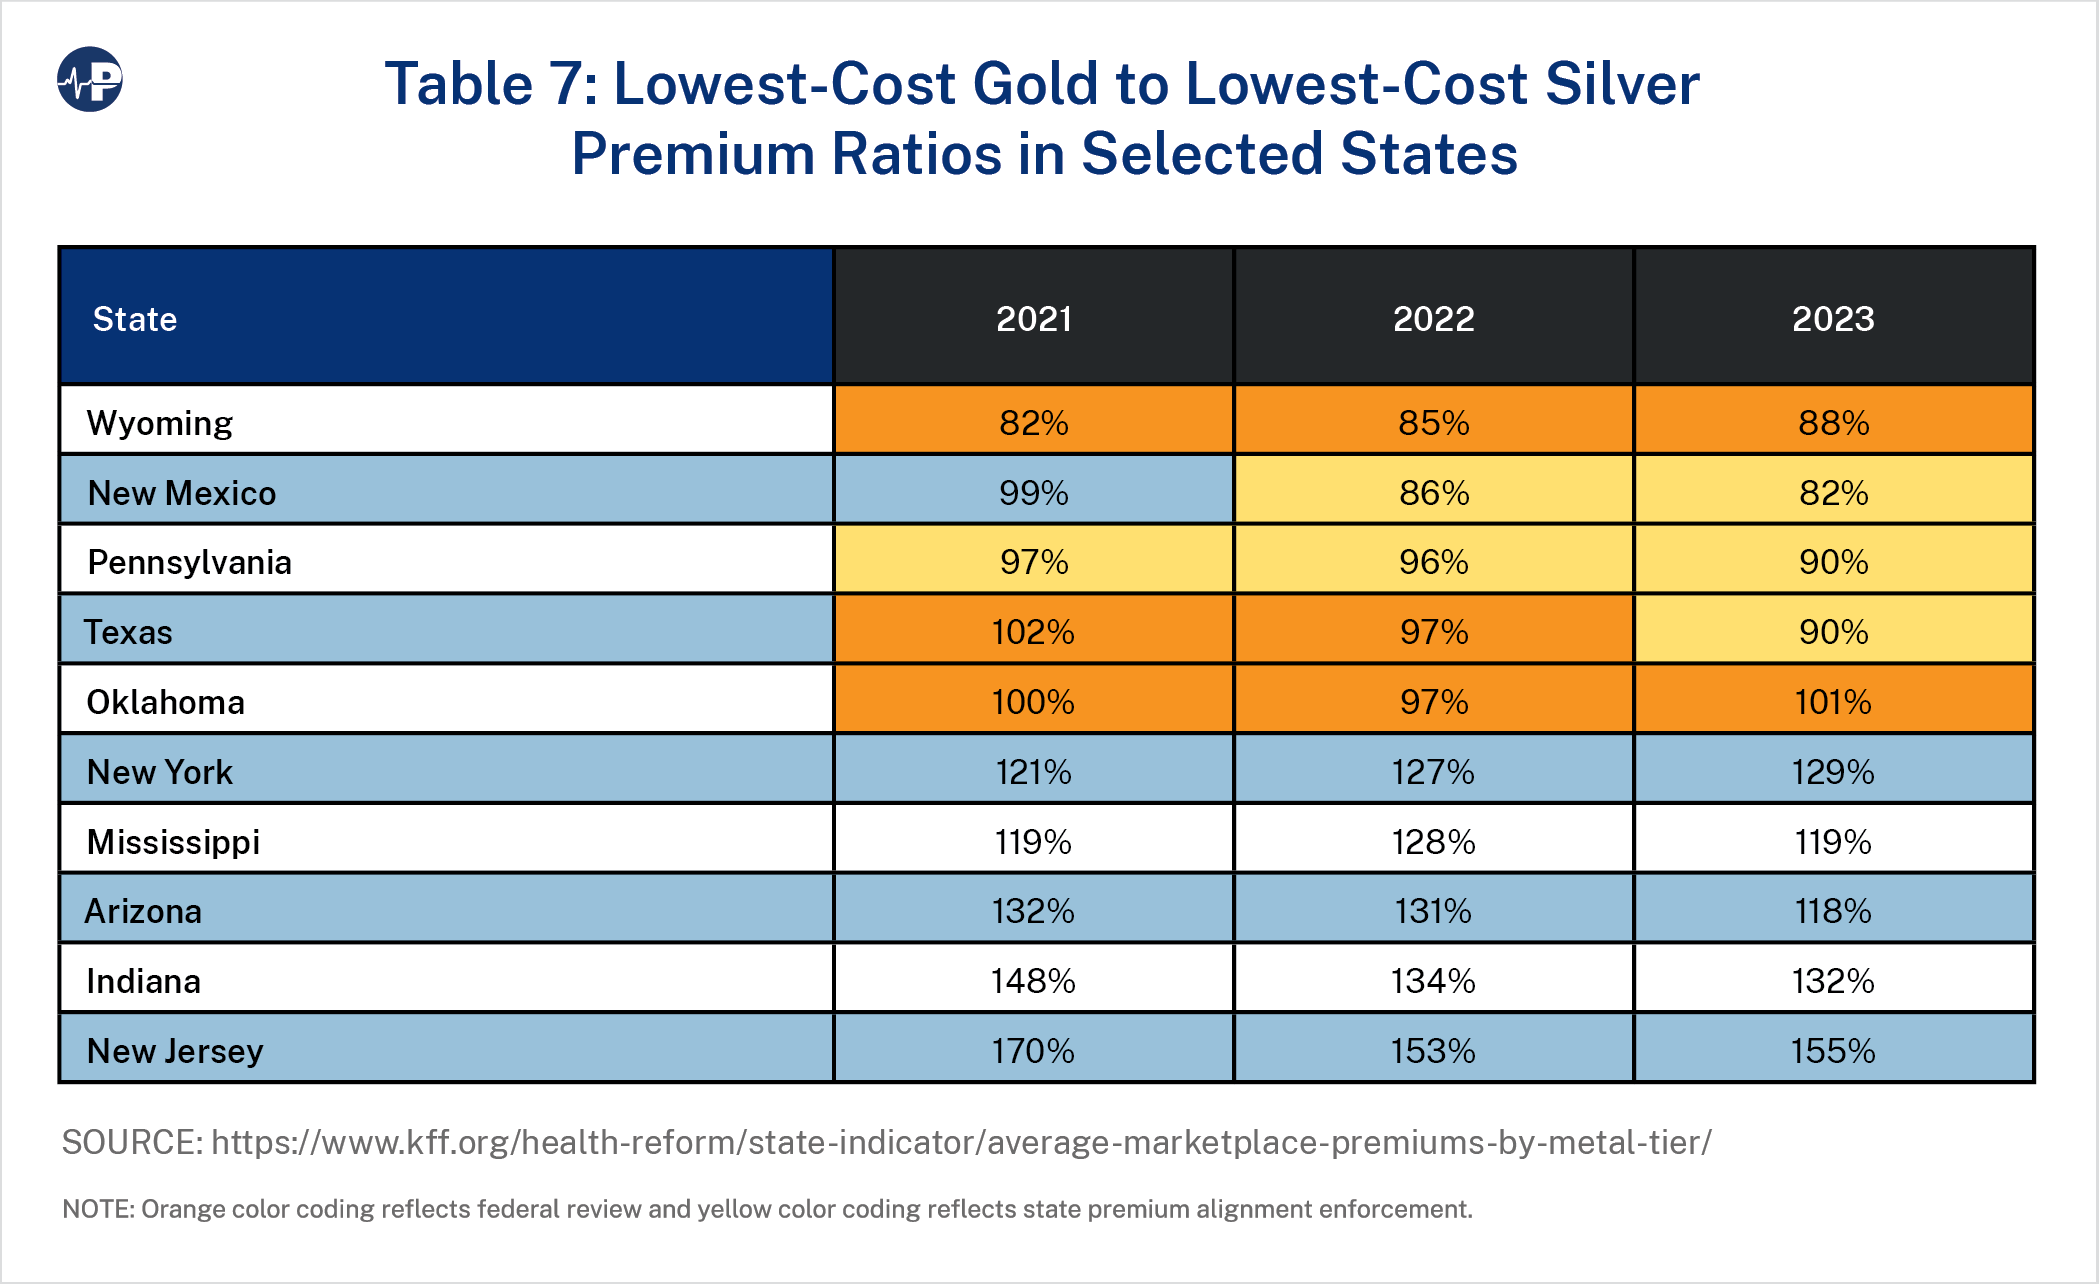
As an illustration of state differences, the lowest cost gold to silver premium ratios in selected states are displayed in Table 7.43 Premium alignment generally increases silver plan premiums and lowers gold plan premiums in revenue-neutral fashion. Accordingly, enrollees in gold plans have lower premiums and receive higher subsidies after premiums are aligned. The 10 states in Table 7 are the three states that have aligned premiums and have a mandated statewide factor to account for CSR defunding and foster fairness across insurers,44 the two states without a state “effective rate review” process that have ceded review authority to the federal government, and the five states with the highest 2022 gold-to-silver ratio. Orange color coding reflects federal review, and yellow color coding reflects state premium alignment enforcement.
If the single risk pool requirement is enforced in other states,45 either by the states or by the federal government,46 the results will be fivefold: (1) higher silver premiums, (2) higher premium subsidies, (3) lower gold premiums, (4) greater enrollment, and (5) greater federal spending.
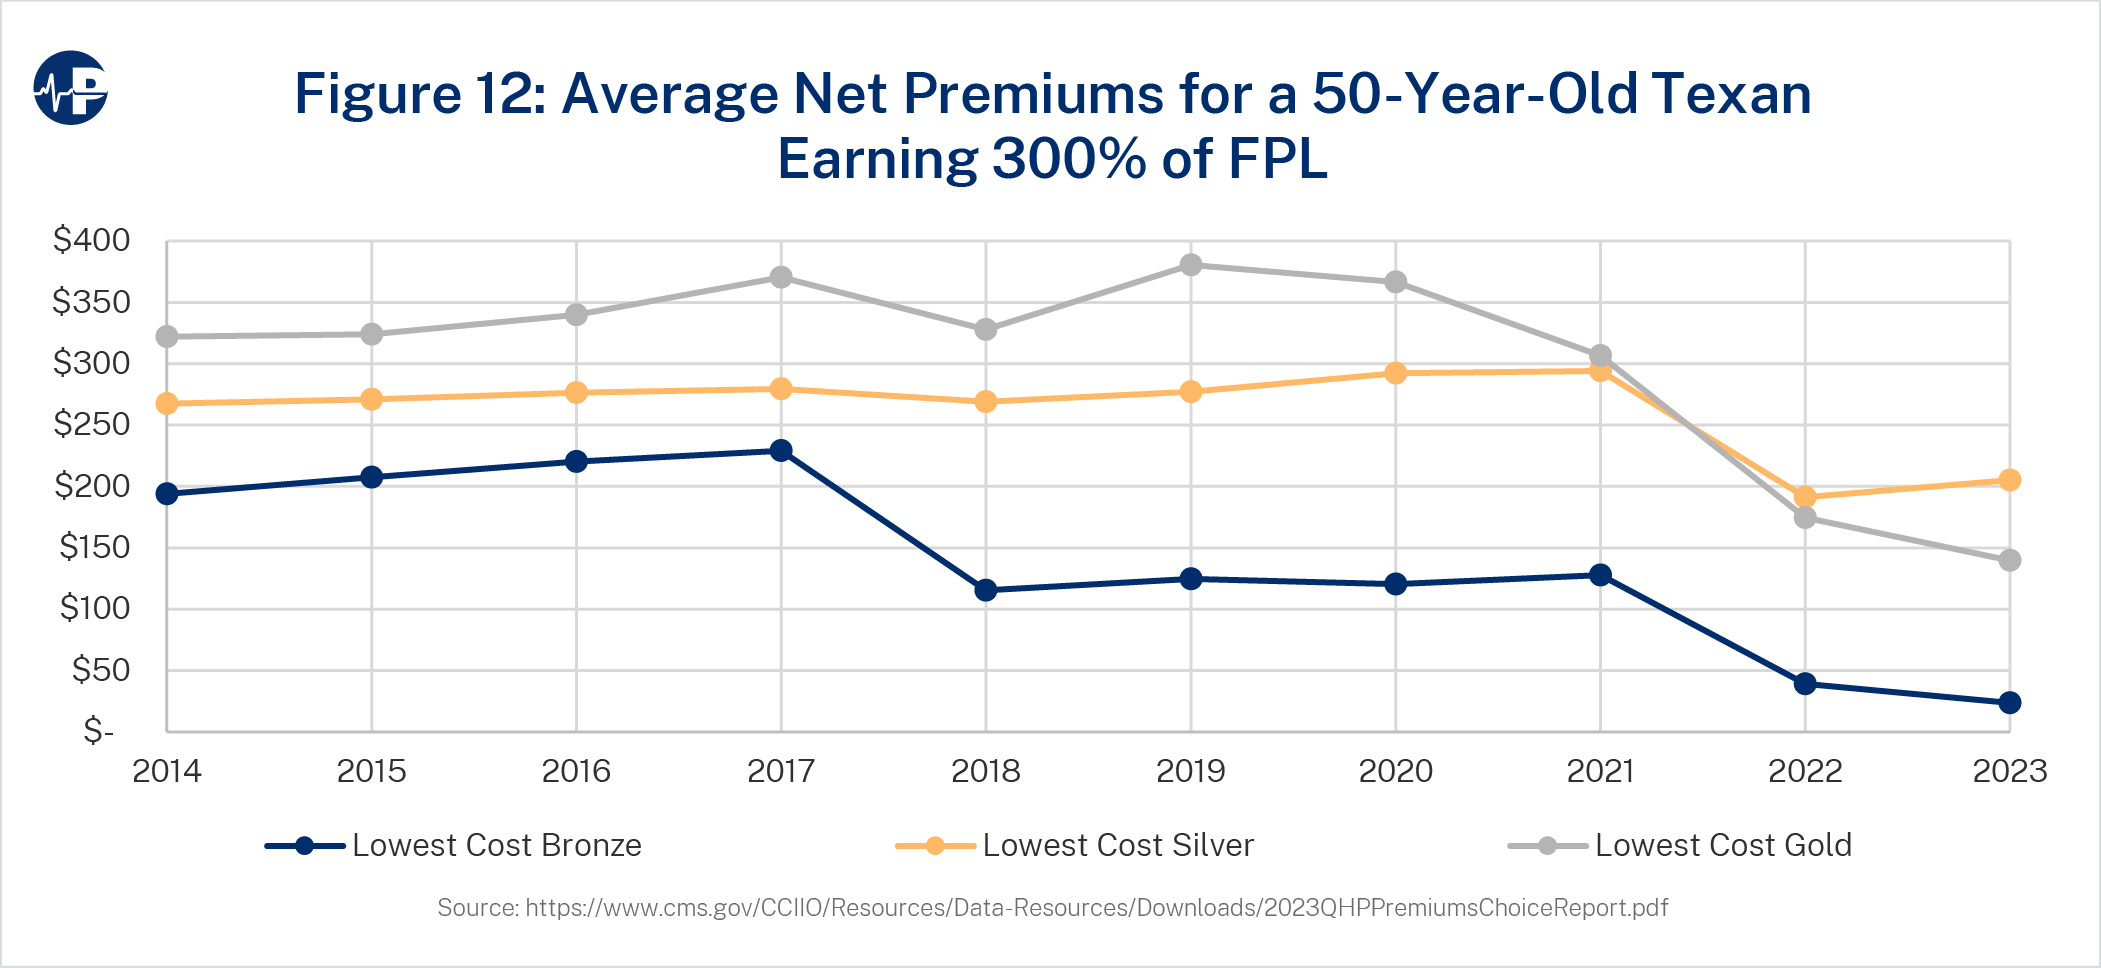
Figure 12 is a replication of Figure 10 for Texas. While silver premiums are close to the national average, monthly gold premiums in Texas are about $100 lower in 2023. Assuming more states enforce ACA rating compliance, policymakers should regard the higher enrollment and higher resulting costs as the appropriate baseline projection when developing policy considerations.
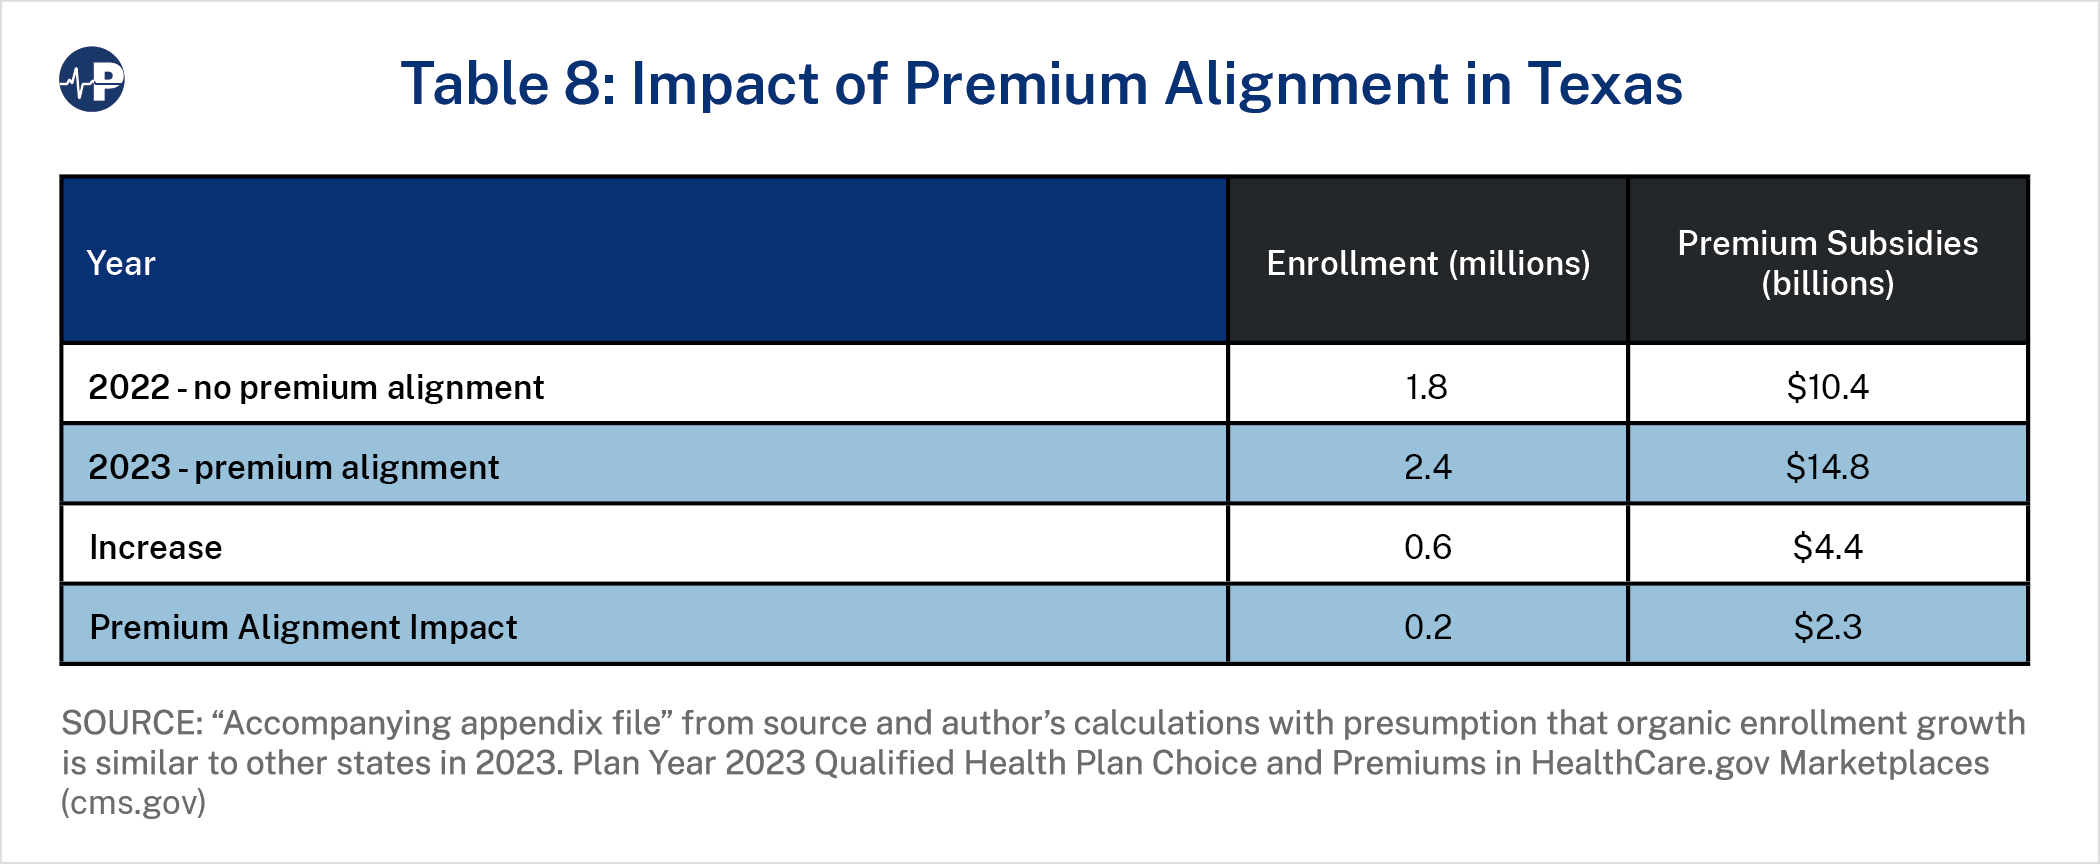
Table 8 illustrates the impact of state premium alignment enforcement. Beginning in plan year 2023, Texas became an “effective rate review” state and stopped ceding regulatory rating enforcement to the federal government.47 The implementation generally followed recommendations of regulatory enforcement in other states.48 As a result of this enforcement, premium relationships in Texas are generally aligned with actuarial value rather than plan or metal level experience. Exchange enrollment grew by one-third in 2023, and we estimate that almost half of the growth is due to the new premium alignment enforcement.
CONCLUSION
The ACA experiment is now at an inflection point. As the first decade of the ACA’s exchanges comes to an end, policymakers and stakeholders have the data to assess the relative effectiveness of the ACA’s framework through an efficiency lens. A holistic understanding of market performance inclusive of related costs—rather than simply enrollment—could better promote policy efficacy.
While the law’s ardent proponents have celebrated recent enrollment growth in ACA exchanges, overall the ACA has attracted far fewer enrollees than anticipated, and it has done so at a much higher cost than originally projected. Rather than growing the individual market by 20 million people at a cost of $137 billion each year, the individual market had grown by 3 million at a cost of $60 billion annually by 2021. On a per-person basis, the taxpayer cost of enrollment is three times higher than expected.
Various ACA policy changes since 2014 have led to an increase in federal spending and increased exchange enrollment. While these enhancements have increased average subsidies, they are likewise less efficient than anticipated. Despite increased coverage levels due to additional federal funding, individual market enrollment remains at about half of the projected amount under original policy expectations.
As we approach the 2024 plan year, there is confusion among federal regulators regarding rating compliance49 and ongoing concern that the ACA’s single risk pool requirement is not practical; some actuaries maintain that community rating compliance is too risky and we “have to have experience rating”50 to maintain market stability. Unwritten allowances to deviate from the law obviously raise actuarial professionalism concerns,51 and inefficient subsidy expansions have served to offset the implications of non-compliant rating. In the public sphere, recent subsidy-driven enrollment gains have been touted and celebrated with little mention of the inefficiency and fiscal implications related to the subsidies and the expansion of them.
A more holistic deliberation —inclusive of related costs in addition to simple enrollment data—could better promote policy efficacy. Such consideration is by no means an original approach. When the ACA was developed, policymakers relied on ACA efficiency projections, which in hindsight were extremely optimistic. In fairness, these projections were developed to model a population group that had largely been traditionally uninsured and was difficult to predict. With 10 years of ACA exchange experience and state-level detail providing measurable results of various additional policy changes, policy experts now have the robust experience to properly assess the policy implications of ACA-related dynamics.
The restructuring of the individual market exchanges has resulted in significant taxpayer cost without an appreciable return in the number of Americans covered, although some targeted population groups have benefitted from coverage gains. For 2022, it is projected that $76 billion in federal spending in the ACA individual exchanges will have an immaterial enrollment impact when compared to a pre-ACA environment. For a fixed federal budget or a flexible appropriation range, we now have data that demonstrates the enrollment response to federal spending and net premium dynamics. This new intelligence could be leveraged to improve the policy efficacy of the ACA individual market exchanges or design a more efficient structural individual market framework.
Footnotes
1↑ CBS News, “Transcript: Obama’s Health Care Speech,” September 9, 2009, https://www.cbsnews.com/news/transcript-obamas-health-care-speech/
2↑ Gregory G. Fann, “‘Uninsured Rate’ Measurements and Health Policy Considerations,” SOA Research Institute, September 2021, https://www.soa.org/4a576c/globalassets/assets/files/resources/research-report/2021/hcct-research-report-uninsured.pdf
4↑ Throughout this paper, exchange enrollment refers to estimated enrollment from effectuated enrollment reports. Expenditure data is from table 22 of the National Health Expenditure Data at https://www.cms.gov/research-statistics-data-and-systems/statistics-trends-and-reports/nationalhealthexpenddata/nationalhealthaccountshistorical
6↑ Actuarial value refers to the percentage of allowed claims insurers pay for a benefit plan. CSR benefits are available for enrollees with income below 250 percent of the federal poverty level who select silver plans. When CSR funding ceased, insurers were financially responsible for a larger proportion of silver plan claims.
7↑ U.S. Department of Health and Human Services (HHS), Office of the Assistant Secretary for Planning and Evaluation, “Potential Fiscal Consequences of Not Providing CSR Reimbursements,” December 2015, https://aspe.hhs.gov/sites/default/files/migrated_legacy_files//130481/ASPE_IB_CSRs.pdf
8↑ Under the ACA, premiums for individuals and small groups must be determined by considering the anticipated claims experience of all enrollees in the statewide “single risk pool” (45 C.F.R. §156.80). Premium misalignment refers to the industry practice of violating the ACA single risk pool provisions by adjusting premiums in metal level tiers to reflect specific enrollment characteristics of a population more granular than the statewide market. The general impact of premium misalignment since 2016 has been higher gold and bronze premiums and lower silver premiums. As subsidies are calibrated on silver plan premiums, these rating dynamics reduce premium subsidies.
9↑ State of New Mexico, Office of Superintendent of Insurance, Plan Year 2022 ACA Individual Market Pricing Guidance, May 28, 2021, https://www.osi.state.nm.us/wp-content/uploads/2021/06/OSI-2022-Rate-Guidance-Final-05282021.pdf
10↑ Supplement: TX SB1296 | 2021-2022 | 87th Legislature | Analysis (Senate Committee Report) | LegiScan
12↑ CBO, Who Went Without Health Insurance in 2019, and Why?, September 30, 2020, https://www.cbo.gov/publication/56504
13↑ In 2016, similar observations led to remarks that the ACA may be more appropriately characterized as the “Medicaid Expansion Act.” Stuart M. Butler, “The Future of the Affordable Care Act: Reassessment and Revision,” JAMA Network, August 2, 2016, https://jamanetwork.com/journals/jama/fullarticle/2533696
14↑ Medicaid enrollment data collected through the Medicaid Budget and Expenditure System used end-of-year enrollment numbers, a newly eligible category. See Centers for Medicare and Medicaid Services (CMS), “Medicaid Enrollment Data Collected Through MBES,” https://www.medicaid.gov/medicaid/national-medicaid-chip-program-information/medicaid-chip-enrollment-data/medicaid-enrollment-data-collected-through-mbes/index.html
15↑ Gary Claxton et al., “Employer Health Benefits: 2022 Annual Survey,” KFF, 2022, https://files.kff.org/attachment/Report-Employer-Health-Benefits-2022-Annual-Survey.pdf
16↑ Greg Fann, “The Elusive Paradoxes of the ACA,” The Actuary, March 2020, https://www.theactuarymagazine.org/the-elusive-paradoxes-of-the-aca/
17↑ Premium subsidies are based on the benchmark plan premium and income level. Most enrollees select lower cost plans than the benchmark plans. As an example, if gross premiums are $100 and $300 for a younger enrollee and an older enrollee, respectively, and the net premium contribution is $50 for their equivalent incomes, the younger enrollee receives a $50 subsidy and the older enrollee receives a $250 subsidy. If enrollees use these subsidy amounts to purchase plans 10 percent cheaper plans ($90 and $270), then the net premium contributions are $40 ($90-$50) for the younger enrollee and $20 ($270-$250) for the older enrollee. See Greg Fann, “Implications of Individual Subsidies in the Affordable Care Act—What Stakeholders Need to Understand,” Health Watch 75 (May 2014), https://www.soa.org/globalassets/assets/library/newsletters/health-watch-newsletter/2014/may/hsn-2014-iss-75-fann.pdf
18↑ Greg Fann, “The ACA’s Changing Coverage Goals: From Obama/Biden to Trump,” Axene Health Partners, The ACA’s Changing Coverage Goals: From Obama/Biden to Trump – Axene Health Partners, LLC (axenehp.com)
19↑ Quoted in Sarah Kliff, “By Picking Tom Price to Lead HHS, Trump Shows He’s Absolutely Serious About Dismantling Obamacare,” Vox, November 28, 2016, https://www.vox.com/2016/11/28/13772342/trump-tom-price-obamacare
21↑ As a result of the ARPA, enrollees with incomes above 400 percent FPL were eligible for premium subsidies if benchmark premiums (second-lowest-cost silver plans in their counties) exceeded 8.5 percent of their income in 2021 and 2022. The Inflation Reduction Act extended the enhanced subsidies through 2025.
23↑ The 2021 projection of 48 million “Nongroup and Other” people include about 8 million nonelderly Medicare beneficiaries. See “Table 1. CBO's May 2013 Estimate of the Effects of the Affordable Care Act on Health Insurance Coverage” at https://www.cbo.gov/sites/default/files/recurringdata/51298-2013-05-aca.pdf
24↑ Total ACA market enrollment is based on average billable member months reported in the annual ACA risk adjustment reports. See CMS, “Premium Stabilization Programs,” https://www.cms.gov/cciio/programs-and-initiatives/premium-stabilization-programs
25↑ While insurers misestimated initial ACA risk levels, gross premiums in ACA exchanges were also lower in 2014-2016 due to federal reinsurance, which lowered insurers’ liability for individuals with high cost claims, and “risk corridors,” which reduced insurers’ gains and losses. These programs allowed insurers to price more aggressively in an attempt to attract early market share. See CMS, “The Three Rs: An Overview,” October 1, 2015, https://www.cms.gov/newsroom/fact-sheets/three-rs-overview
26↑ The Health Insurance Exchange Public Use Files do not include the data in states that have established state-based exchanges. See CMS, “Health Insurance Exchange Public Use Files (Exchange PUFs),” https://www.cms.gov/CCIIO/Resources/Data-Resources/marketplace-puf
27↑ Greg Fann, “The Affordable Care Act Makeover—Part 1: Who Had ‘Coronavirus’ Replacing ‘Medicare for All’ on Their Bingo Card?,” LinkedIn, May 18, 2020, https://www.linkedin.com/pulse/affordable-care-act-makeover-part-1-who-had-coronavirus-greg-fann/?published=t
29↑ After 2017, CSR subsidies were no longer reimbursed, but insurers were still responsible for the costs, resulting in higher actuarial values on impacted plans. As these subsidies were available only on silver plans (with exceptions for some American Indians and Alaska Natives), insurers adjusted premiums to reflect the higher resulting actuarial value. The general dynamics of these premium adjustments has been unofficially characterized as “CSR loading” by HHS and “silver loading” in the health policy community. See Samara Lorenz, Director, Oversight Group, Center for Consumer Information and Insurance, CMS, “Offering of Plans That Are Not QHPs Without CSR ‘Loading,’” memorandum, August 3, 2018, https://www.cms.gov/CCIIO/Resources/Regulations-and-Guidance/Downloads/Offering-plans-not-QHPs-without-CSR-loading.pdf
30↑ Brian Blase, “Expanded ACA Subsidies: Exacerbating Health Inflation and Income Inequality,” Galen Institute, updated June 11, 2021, https://galen.org/assets/Expanded-ACA-Subsidies-Exacerbating-Health-Inflation-and-Income-Inequality.pdf
31↑ Coleman Drake and David M. Anderson, “Terminating Cost-Sharing Reduction Subsidy Payments: The Impact of Marketplace Zero-Dollar Premium Plans on Enrollment,” Health Affairs 39, no. 1 (2020): 41–49, https://www.healthaffairs.org/doi/epdf/10.1377/hlthaff.2019.00345
32↑ Premiums for enrollees vary by other factors (e.g., age, geography, family composition, tobacco use), but the single risk pool requirement allows a particular enrollee’s premium difference between two plan options to reflect only benefit differences and related induced demand (meaning that plan with lower cost-sharing amounts will lead to greater use of health care services).
33↑ Stan Dorn and Timothy Jost, “ACA Metal-Tier Mispricing: Improving Affordability by Solving an Actuarial Mystery,” Health Affairs Forefront, January 27, 2023, https://www.healthaffairs.org/content/forefront/aca-metal-tier-mispricing-improving-affordability-solving-actuarial-mystery
34↑ The ACA single risk pool guidelines require insurers to limit plan rating factors to actuarially justified allowable differences. As ACA claims experience emerged, insurers recognized plan level profitability differences, and premium relationships began to shift out of alignment with prescribed allowances. In general, silver premiums (which determine premium subsidy levels) declined while bronze, gold, and platinum premiums increased. Effectively, enrollees in non-silver plans had higher gross and net premiums. While the federal government retracted language from the 2023 rating instructions clarifying that “single risk pool guidelines should be followed,” some states are independently enforcing single risk pool guidelines. Stan Dorn, Greg Fann, and Hannah Markus, “Misalignment Between Premiums and Coverage Generosity Imposes Heavy Cost Burdens on Consumers in Health Insurance Exchanges,” Axene Health Partners, https://axenehp.com/misalignment-premiums-coverage-generosity-imposes-heavy-cost-burdens-consumers-health-insurance-exchanges/
35↑ The CBO acknowledged metal level premium differences due to health status in ACA base experience and projections. See CBO, The Effects of Terminating Payments for Cost-Sharing Reductions, August 2017, https://www.cbo.gov/system/files/115th-congress-2017-2018/reports/53009-costsharingreductions.pdf
36↑ Premiums changing from $1 to $0 has a larger enrollment impact than premiums changing from $2 to $1 does.
37↑ Daniel Chang, “Fraudsters Duping Homeless People into ACA Plans They Can’t Afford,” WUSF Public Media, June 17, 2023, https://wusfnews.wusf.usf.edu/politics-issues/2023-06-17/fraudsters-duping-homeless-people-signing-aca-plans-cant-afford
38↑ Eric Hargan, Acting Secretary, HHS, “Payments to Issuers for Cost-Sharing Reductions (CSRs),” memorandum to Seema Verma, Administrator, CMS, October 12, 2017, https://www.hhs.gov/sites/default/files/csr-payment-memo.pdf
39↑ Joyce Bohl et al., “Paying for ACA Cost-Sharing Reductions: Are Premiums Too Low or Too High?,” Health Affairs Forefront, December 6, 2022, https://www.healthaffairs.org/content/forefront/paying-aca-cost-sharing-reductions-premiums-too-low-too-high
40↑ American Cancer Society Cancer Action Network et al., letter to the Hon. Xavier Becerra, Secretary, HHS, September 13, 2022, https://www.cff.org/sites/default/files/2022-10/PPC-Letter-to-HHS-Outlining-Patient-Priorities-for-the-2024-NBPP-Rulemaking.pdf
41↑ Policymakers are generally unaware of ACA premium misalignment and the environmental impact of aligning premiums.
42↑ Greg Fann, “The Temptuous Crisis Invitation,” The Actuary, July 2020, https://www.theactuarymagazine.org/the-temptuous-crisis-invitation/
43↑ In 2015, HHS described the silver plan actuarial value impact of CSR defunding: “The result would be a new distribution of consumers across Marketplace (exchange) health plans, with silver plans likely enrolling only those individuals eligible for the two highest CSR tiers. Without enrollees at the 70 and 73 percent AV [actuarial value] levels, silver plans would have to be priced even higher to cover insurers’ costs. Specifically, with all enrollees entitled to 87 or 94 percent AV coverage, the new average AV in silver plans would be about 90 percent, and plans would have to be priced accordingly…. Under certain assumptions, individuals eligible for CSRs that raise the AV of a silver plan to 87 percent would also be better off buying gold or platinum rather than silver plans. In that case, only individuals eligible for the highest CSR tier would remain in silver plans, which would be priced for an actuarial value of 94 percent, resulting in even larger price increases.” HHS, Office of the Assistant Secretary for Planning and Evaluation, “Potential Fiscal Consequences of Not Providing CSR Reimbursements.”
In 2023, the average silver actuarial value is about 90 percent, and gold premiums (with a base actuarial value of 80 percent) are priced about 5 percent higher than silver premiums. KFF, “Average Marketplace Premiums by Metal Tier, 2018-2023,” https://www.kff.org/health-reform/state-indicator/average-marketplace-premiums-by-metal-tier/
44↑ When premiums are aligned, insurers are at risk for adverse distribution enrollment with uneven profitability across plans. Common alignment across all insurers mitigates that risk, but if insurers apply different factors to adjust for CSR defunding, some insurers may be at a competitive disadvantage. New Mexico, Pennsylvania, and Texas have mandated a common statewide “CSR Defunding Factor” to mitigate this risk.
45↑ New Jersey is strengthening enforcement of the single risk pool requirement effective in plan year 2024 and requiring on-exchange silver plans to be priced at a 90 percent actuarial value in 2025. 3896_I1.PDF (state.nj.us)
47↑ Greg Fann, “The Fruits of Objective Actuarial Communication,” The Actuary, February 2023, https://www.theactuarymagazine.org/the-fruits-of-objective-actuarial-communication/
48↑ Charles Miller, “Comments on SB 1296 Informal Rule,” Texas 2036, https://texas2036.org/posts/comments-on-sb-1296-informal-rule/
49↑ HHS noted single risk pool compliance advocates “objected to HHS considering any method of estimating CSR premium load factors that involves issuers using experience data or issuer pricing models”, while their objection was to the American Academy of Actuaries’ recommendation to recognize the “unique population characteristics of CSR enrollees” and deviate from issuer pricing model results to “reflect the true cost” of CSR enrollees. Patient Protection and Affordable Care Act, HHS Notice of Benefit and Payment Parameters for 2024 (cms.gov)
50↑ Greg Fann, “Our Independence and ACA Fireworks,” LinkedIn, April 12, 2023, https://www.linkedin.com/pulse/our-independence-aca-fireworks-greg-fann/
51↑ Descant, “Daniel Cruz on the Actuarial Profession—A Systemic Failure of Self-Regulation,” podcast, November 25, 2022, https://www.descant.info/podcast/episode/7aa219f5/daniel-cruz-on-the-actuarial-profession-a-systemic-failure-of-self-regulation
Acknowledgements
The authors are grateful to the Paragon team, and to Doug Badger, Drew Gonshorowski, Theo Merkel, and Brian Blase for their exceptional comments and work in review of the paper.