Hospital lobbyists argued that the reforms to provider taxes and state-directed payments (SDPs) in the One Big Beautiful Bill (OBBB) would decimate rural providers. For example, the National Rural Health Association (NRHA), in its comment on CMS’s proposed rule implementing the OBBB’s SDP provision, stated it would “disproportionately harm rural hospitals and jeopardize Medicaid enrollee access to care in rural communities.” This claim has often been repeated in the media without evidence.
In this analysis, we examine publicly available provider-specific scheduled SDP payments in Texas and Arizona in 2025 and show that in both states, more than 90 percent of SDP payments were for non-rural providers. This is consistent with a recent study by the Assistant Secretary for Planning and Evaluation (ASPE) at the US Department of Health and Human Services, which found that only 5 percent of SDP funds in 2025 went to rural inpatient hospitals.
- Using the 2025 Federal Office of Rural Health Policy (FORHP) hospital-site designation, rural providers account for 2 percent of spending under Texas’s principal hospital SDP, CHIRP, and 8.3 percent under Arizona’s principal hospital SDP, HEALTHII. The figures describe what the hospitals were scheduled to receive under these SDPs. They do not reflect final cash receipts, all hospital SDPs in either state, or hospitals’ net gain accounting for their financing contributions through Medicaid provider taxes or IGTs. Texas and Arizona use different annual windows. Both Pics use the same FORHP definition.
- We also examined whether those numbers changed under different definitions of rurality. Texas’s rural share did not change significantly under different definitions (2.3 percent and 2 percent under Texas’s and the U.S. Department of Agriculture’s (USDA) respective definitions). However, Arizona’s rural share varied more under different definitions (19 percent and 4.4 percent under Arizona’s and the USDA’s respective definitions).
- We also examined spending per available hospital bed to see if differences in hospital capacity could explain the heavy skew toward non-rural providers. We found that Texas still spent more per available hospital bed on non-rural providers than rural providers, while Arizona spent more per bed on rural providers than non-rural providers.
Methodology
We selected Texas and Arizona because each publishes a hospital-level fiscal year 2025 schedule that can be checked against individual providers. They are illustrative cases, not a representative sample of states. AI assisted the data preparation and chart production. We manually checked a sample of its calculations and found no errors.
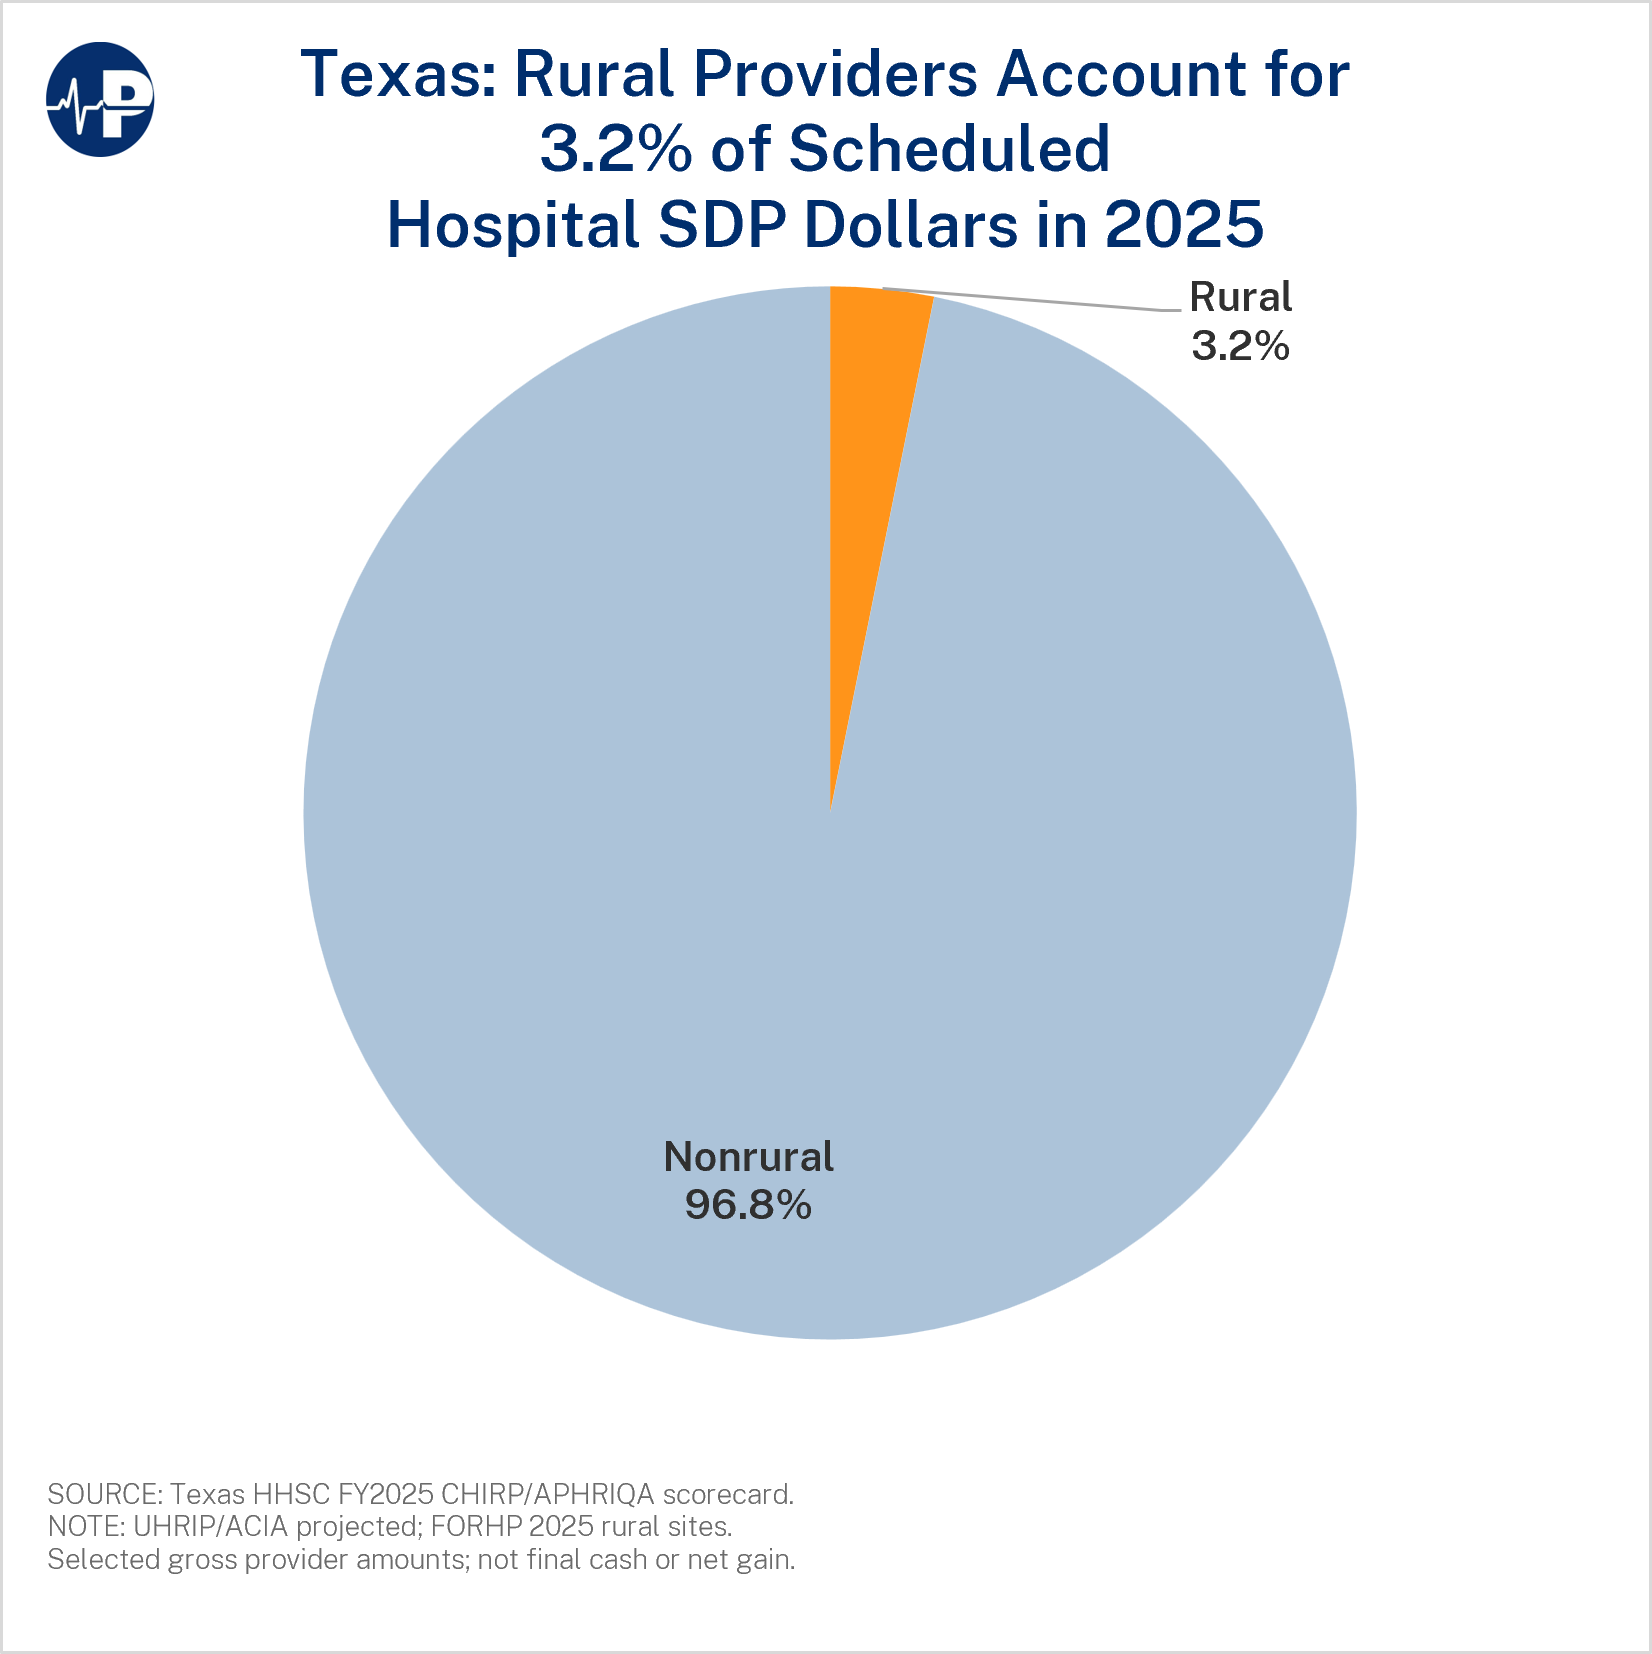 Texas SDPs
For Texas, we examined each hospital’s scheduled payments under the state’s Comprehensive Hospital Increase Reimbursement Program (CHIRP), which Texas describes as its “statewide program that increases Medicaid payments to hospitals for inpatient and outpatient services provided to persons with Medicaid.” CHIRP has three components: Uniform Hospital Rate Increase Payment (UHRIP), Average Commercial Incentive Award (ACIA), and Alternate Participating Hospital Reimbursement for Improving Quality Award (APHRIQA). The state posts projected payments for all three components in its Final Payment (SFY2025) Scorecard under “APHRIQA Scorecards.”
Between September 1, 2024 and August 31, 2025, CHIRP was scheduled to spend $6.05 billion (out of $6.48 billion it was approved to spend). We calculated this total by combining the projected UHRIP and ACIA amounts with updated figures for the APHRIQA. The updated APHRIQA figures include interim payments reported as having been received and final payments or recoveries calculated after hospitals’ quality results were known. These figures replace the preliminary APHRIQA estimate to avoid double counting. Because UHRIP and ACIA remain projections, the combined total is not a final accounting of actual payments. Texas has other directed payment programs, but they serve different provider types or lack comparable provider-level spending data, so we excluded them from the analysis.
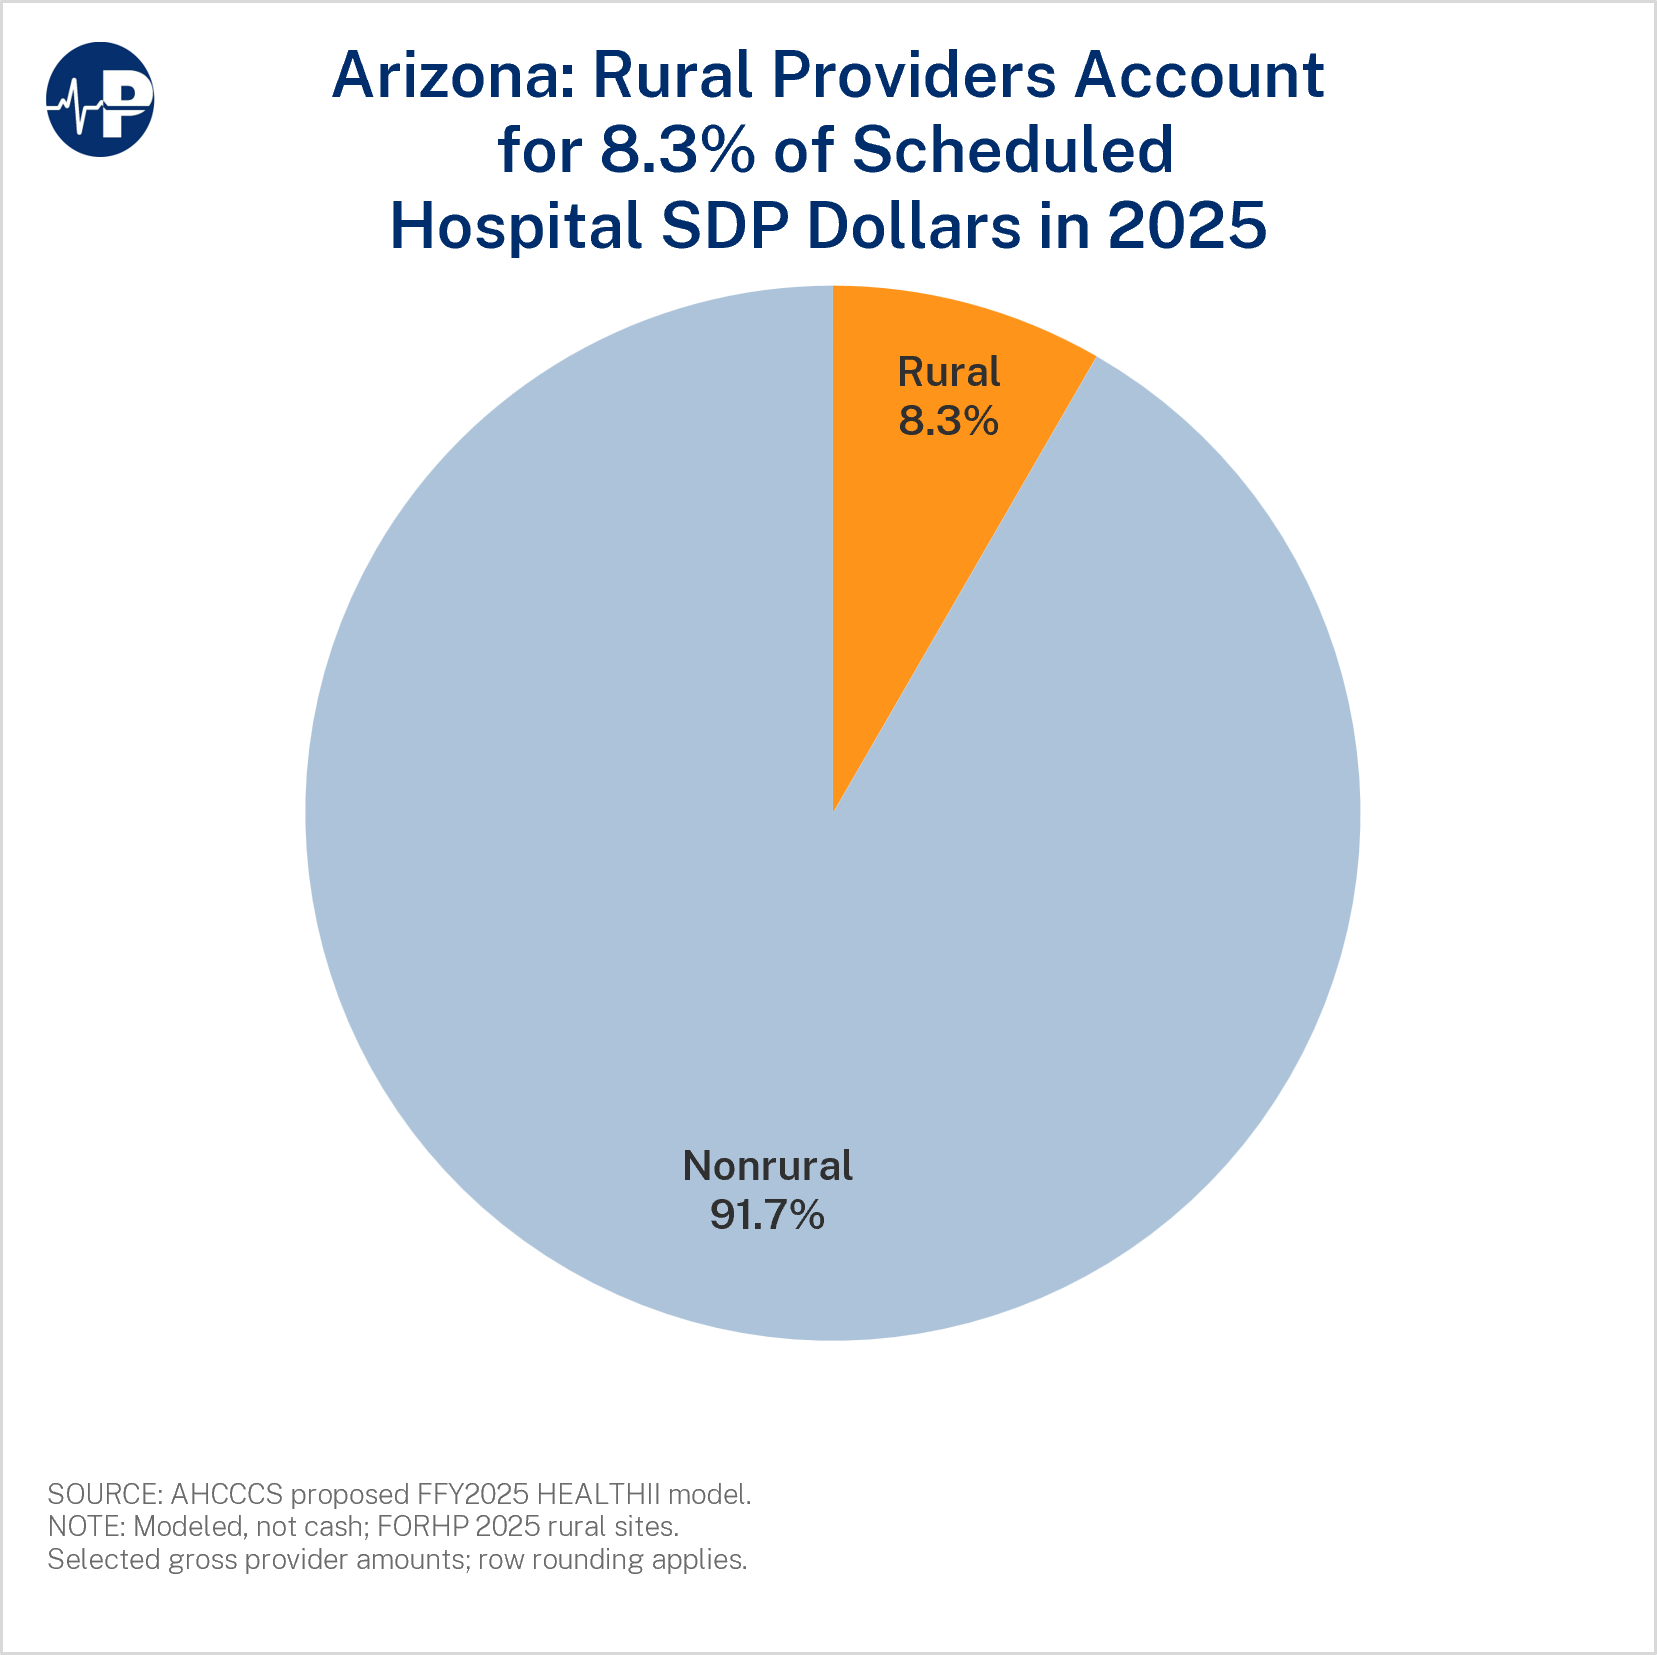 Arizona SDPs
Our data for Arizona covered the Hospital Enhanced Access Leading to Health Improvements Initiative (HEALTHII) model for October 1, 2024, through September 30, 2025. Across 117 providers, it lists $3.031 billion in SDP payments (out of $3.09 billion it was approved to spend). Arizona used its 2023 hospital claims to estimate its base payments in 2025, adding an allowance for claims not yet reported but assuming no growth in hospital use between 2023 and 2025. Provider amounts could change with actual FY2025 managed-care utilization and final reconciliation.
Arizona has other less costly SDPs that were not included in our analysis because there were no publicly available provider-level estimates that would have permitted a rural/urban comparison. These programs seem targeted to non-rural hospitals, including some examples that seemed to target single providers located in the urban area of Phoenix.
- The Safety Net Services Initiative (SNSI) is an SDP that was approved by CMS to spend $388.5 million on “the eligible public safety net hospital established by the state for inpatient and outpatient hospital services.” That hospital is Valleywise, Maricopa County Special Health Care District, located in the city of Phoenix.
- Another SDP that seems directed towards just one provider is the Pediatric Services Initiative (PSI), which was approved to provide $59.12 million “for inpatient and outpatient hospital services at freestanding children’s hospitals with more than 100 licensed pediatric beds.” It seems directed to Phoenix Children’s Hospital (PCH). The City of Phoenix’s summary of its June 18, 2025, Formal Meeting described PSI as “a partnership between the City of Phoenix, AHCCCS and PCH” and that its purpose “is to help provide financial sustainability to PCH as one of the country’s largest and busiest pediatric systems.”
Another major SDP that we excluded is Arizona’s Access to Professional Services Initiative (APSI), which was approved to provide $310.4 million in payments to hospitals based on professional services. We excluded this SDP from our analysis because the state did not publicly disclose provider-specific payments. However, one AHCCCS document from before 2022 listed 11 hospitals as APSI recipients. While it is unclear whether those providers have changed, none of those 11 hospitals are considered rural under any of the definitions we used.
Rural vs. Non-Rural Classification
Both analyses classify each hospital under the 2025 Federal Office of Rural Health Policy (FORHP) rural designation, as compiled by UNC Sheps Center. For any unmatched sites, we used the Health Resources and Services Administration’s (HRSA) rural-area point lookup to find the correct FORHP classification.
In addition to the FORHP, we also considered two other rural vs. non-rural definitions. First, we looked at the states’ own designations (Texas CHIRP’s own provider classes and a limited Arizona AHCCCS APR-DRG/RHIF category schedule). Second, we used the U.S. Department of Agriculture’s (USDA) 2023 county metro/non-metro codes.
Findings
Under FORHP 2025, 136 Texas CHIRP rows classified rural account for $191.6 million of $6.050 billion (3.2 percent). Seventeen Arizona HEALTHII rows classified rural account for $252.7 million of $3.031 billion (8.3 percent). The other 247 Texas and 100 Arizona rows are non-rural under this site designation. All 383 Texas and 117 Arizona provider rows, including zero-dollar rows, remain in the denominators. None has an unknown FORHP class.
Numbers Using Different Definitions of Rural
We also examined how the results changed under different definitions of rural. Texas’s results changed little, while Arizona’s varied more substantially. Texas’s rural designation under CHIRP yields 2.3 percent. Using USDA’s county metro/non-metro classification, non-metro hospitals account for 2.2 percent of selected dollars.
While Arizona’s rural share under USDA (4.4 percent) was smaller than its share using the FORHP definition, the state’s own definitions showed a much higher percentage of rural providers. Under Arizona’s own designations, contained in a separate limited AHCCCS APR-DRG/RHIF schedule, rural hospitals account for $576.6 million (19.0 percent) while $117.8 million (3.9 percent) went to hospitals with unknown state-category status. The schedule’s “All Other” category is not proof of a non-rural location.
These sensitivity shares all use the full state selected-dollar totals, including unknown classifications.
Adjustment for Hospital Size
One possible explanation for the patterns we observe is that non-rural providers receive larger SDP payments because they serve more patients. To account for capacity differences, we also examined spending per available hospital bed. These numbers were taken from hospitals’ Medicare cost reports only for providers that had full-year Medicare cost reports and known geography (about 99.6 percent of selected Texas dollars and 98.3 percent of Arizona dollars).
The denominator is all available beds, not Medicaid patient volume. Also, some cost-report periods do not coincide with the SDP year.
We found that even adjusting for hospital beds, Texas SDP spending was still significantly skewed towards non-rural providers, while the opposite was true in Arizona. In the separate matched comparison using USDA non-metro/metro county status, rural dollars per average available bed were about $33,300 versus $102,600 for metro Texas hospitals, but about $504,800 versus $181,500 in Arizona.
These findings only describe selected gross provider allocations before provider taxes or intergovernmental financing. They do not show whether provider taxes help or hurt any individual hospital, whether all rural hospitals participate, or how the OBBB’s reforms will change access or employment.
CONCLUSION
These findings are relevant for both the SDP reforms and the changes to provider taxes in the OBBB. As Paragon has previously written, states often combine SDPs with provider taxes. They first use provider taxes to raise funds from providers, then use SDPs to pay providers back while triggering larger infusions of federal Medicaid money. Both the state and providers often net even greater funds (see this video explaining the financing mechanism).
The fact that states skew their resources towards non-rural providers adds another piece to the puzzle of why states with provider taxes experience decreased rural hospital employment, as research by Liam Sigaud and Niklas Kleinworth found. That decrease in provider-tax states happened even though the authors found no corresponding decline among urban hospitals. Our finding provides one possible explanation for this seeming contradiction: states direct nearly all their Medicaid SDP dollars towards non-rural hospitals.
Ultimately, Congress and the Administration are right to focus their efforts to reform these payments and stop diverting resources from the most vulnerable populations.