
Reforming Government. Empowering Patients.
Navigation
Medicaid Expansion’s Growing Improper Enrollment Crisis
Nearly Half of Expansion Enrollees Likely Do Not Meet Eligibility Requirements


The Paper
Executive Summary
What This Paper Covers
This paper examines improper enrollment in the Medicaid expansion under the Affordable Care Act (ACA) in 2024. It builds on Paragon Health Institute’s earlier research, “Ineligible Enrollment in the ACA’s Medicaid Expansion: Evidence, Costs, and Remedies,” which estimated that roughly one in three expansion enrollees—4.9 million people—did not qualify for the program in 2019. With states’ post-COVID eligibility redeterminations now complete, this paper provides the first comprehensive assessment of how improper expansion enrollment has evolved since the pandemic.
Using Census Bureau’s American Community Survey (ACS) data, administrative enrollment data from the Medicaid Budget and Expenditure System (MBES), and per-enrollee spending figures from the Medicaid and CHIP Payment and Access Commission (MACPAC), the paper compares actual enrollment in the expansion group at the state level against estimates of the number of eligible individuals plausibly enrolled. The difference between the two reflects improper enrollment. Improper enrollees include people receiving expansion coverage despite income above the eligibility limit; people failing to meet citizenship, immigration, or residency requirements; and people who are qualified for Medicaid through traditional pathways.
The paper also examines:
- the structural features of Medicaid expansion’s financing—including the 9:1 federal match rate and state financing schemes such as provider taxes—that weaken states’ incentives to ensure proper eligibility determinations;
- the fiscal costs of improper enrollment for the federal government and the states, including the cost-shifting produced when traditional enrollees are misclassified into the expansion group;
- how improper enrollment changed between 2019 and 2024 both nationally and state by state; and
- post-unwinding enrollment trends, which show that expansion enrollment remains far above pre-pandemic levels even as traditional Medicaid enrollment has largely returned to pre-pandemic levels.
What We Found and Why It Matters
Improper enrollment in Medicaid expansion is widespread, and it has grown dramatically worse since 2019. Under my central assumption of a 70 percent take-up rate among eligible individuals, I estimate that 9.2 million expansion enrollees—nearly half (46 percent)—were likely ineligible for the program in 2024. That is an 88 percent increase from the 4.9 million improper enrollees I estimated for 2019, when the ineligible share was 33 percent. The finding of substantial improper enrollment is robust to alternative assumptions: Even under an implausible 100 percent take-up rate—a theoretical lower bound—more than a quarter of expansion enrollees (5.2 million people) appear ineligible.
The fiscal consequences are severe. I estimate that improper expansion enrollment cost the federal government approximately $32.9 billion in 2024—about 6 percent of all federal Medicaid spending. California alone accounts for $10.4 billion in federal costs. Using a consistent methodology used in a previous Paragon analysis, I estimate that the federal costs stemming from improper expansion enrollment more than doubled from 2019 to 2024. Because roughly one-third of improper enrollees appear to be individuals who qualify for Medicaid through traditional pathways but were misclassified into the higher-match expansion group, states collectively saved an estimated $6.8 billion — a direct illustration of the perverse incentives built into the program’s financing.
Improper enrollment is a nationwide problem, but a handful of states drive a disproportionate share. California alone accounts for roughly 3.1 million improper enrollees—about one-third of the national total—with an estimated ineligible rate of 62 percent. I also find substantial levels of improper enrollment in New York, Louisiana, Oregon, and Washington. Yet the deterioration is broad-based: Of the 32 states that had expanded Medicaid before 2019, improper enrollment increased in 31, and 36 of the 41 expansion states (including the District of Columbia) show detectable improper enrollment in 2024.
These patterns are consistent with the structural incentives facing states. Because the federal government pays at least 90 percent of expansion costs—far above the roughly 60 percent average match for traditional enrollees—states bear almost none of the cost of improper expansion enrollment while reaping the political—and potentially economic—benefits of higher enrollment and more federal funding. The post-pandemic unwinding illustrates the consequences: By mid-2025, traditional Medicaid enrollment had returned close to pre-pandemic levels, but expansion enrollment remained 21 percent above its January 2020 level. The COVID-era enrollment surge in the expansion group, in other words, never reversed.
Improper enrollment is not a victimless accounting problem. It diverts resources from the vulnerable populations Medicaid was designed to serve—children, pregnant women, the elderly, and people with disabilities—strains the health system, erodes public trust, and imposes tens of billions of dollars in improper costs on federal taxpayers each year.
What We Recommend
Congress and the Trump administration have taken important initial steps through the One Big Beautiful Bill (OBBB) of 2025, which will require six-month eligibility redeterminations for expansion adults beginning in 2027, phase-down provider taxes and state-directed payments beginning in 2028 and impose financial penalties on states with high eligibility-related payment error rates beginning in 2030. These are meaningful guardrails, but their impact depends heavily on state implementation and federal commitments to ongoing oversight—and the estimates in this paper, based on 2024 data, predate these reforms.
Policymakers should go further to remove improper enrollees and stem the flow of new improper enrollees into the program, including taking the following actions:
- Rectifying the central structural flaw in Medicaid financing by reducing the 90 percent federal matching rate for expansion enrollees to the rate states receive for traditional enrollees, ensuring that improper enrollment imposes real costs on state budgets
- Strengthening income verification at enrollment by tightening “reasonable compatibility” thresholds for self-attestation and broadening real-time wage and income data checks
- Eliminating the federal requirement that states conduct passive (
- Extending the Payment Error Rate Measurement (PERM) program by requiring independent, annual eligibility audits in every state, enabling swifter penalties and corrective action
Without structural reform—including, above all, reforms to the financing arrangement that insulates states from the costs of their own eligibility failures—improper enrollment is likely to remain an embedded feature of Medicaid expansion rather than an isolated anomaly.
Introduction
The expansion of Medicaid under the ACA, broadly implemented in 2014, has become a central feature of the U.S. health system, covering about 10 percent of non-elderly adults.1 Yet the program is marred by high taxpayer costs, mediocre health outcomes,2 and pervasive deficiencies in program integrity.3 Enrollment in the expansion group has far exceeded initial projections, prompting concerns that large numbers of people who do not qualify for Medicaid may be receiving benefits under the ACA’s expansion.4 Enrollees can be ineligible for expansion coverage for a variety of reasons, including having income in excess of eligibility limits, failing to meet requirements related to citizenship/immigration status or state residency, or qualifying for Medicaid through traditional pathways. Whatever the reason, improper enrollment erodes public trust in government, diverts resources away from intended beneficiaries, and imposes unwanted costs on taxpayers.
There are strong reasons to believe that Medicaid expansion may be particularly vulnerable to this type of abuse. The structural design of the program encourages lax eligibility enforcement. One of the core flaws is that while the states are responsible for monitoring their Medicaid rolls and preventing improper enrollment, the fiscal costs of improper enrollment are paid almost entirely by the federal government, which covers at least 90 percent of the cost of expansion enrollees—far more than the approximately 60 percent average federal match states receive for traditional enrollees such as low-income children and people with disabilities.5 As a result, when ineligible individuals receive benefits through the expansion group, states bear almost none of the cost.6 Furthermore, high enrollment under Medicaid expansion—regardless of enrollees’ true eligibility—delivers political benefits to state policymakers. These misaligned incentives are compounded by financing arrangements—such as provider taxes and intergovernmental transfers—that allow states to capture additional federal matching dollars while further reducing their effective share of program costs. Under the ACA’s 90 percent federal reimbursement rate, the rate of return on these financing schemes is roughly six times higher for expansion enrollees than for the traditional Medicaid population. These two factors raise serious concerns that states may not adequately invest in program integrity measures.
The same incentive structure also creates fiscal motives for states to misclassify individuals eligible for Medicaid under traditional pathways into the expansion group. Because the federal match for expansion enrollees is roughly 30 percentage points higher than the average for traditional enrollees, states stand to save thousands of dollars per enrollee per year by placing them in the expansion group. Research suggests these reclassifications may be widespread, affecting millions of enrollees and substantially inflating federal Medicaid spending.7
Federal investigations into expansion states’ Medicaid records provide direct evidence of improper enrollment in the expansion group. In an audit of New York’s Medicaid program, investigators reviewed eligibility documentation for a random sample of Medicaid enrollees New York had classified as belonging to the expansion group and for whom New York had received federal funding. The review found that 28 percent of these enrollees were ineligible.8 Similar audits in California9 and Colorado10 found that 18 percent and 23 percent, respectively, of randomly sampled enrollees in the expansion group were ineligible. In some states, auditors identified large numbers of additional enrollees who, based on incomplete records, may not have met Medicaid eligibility requirements.11
Additional evidence of improper enrollment in the expansion group comes from statistical studies using publicly available data on income, family composition, and Medicaid enrollment. Using 2012–2017 Census Bureau data, one study showed that Medicaid take-up after the ACA’s implementation rose not just among eligible adults but also among those above the income threshold. The analysis suggested approximately 522,000 seemingly income-ineligible enrollees across nine expansion states.12 Because the study focused on a small subset of expansion states in the early years of the expansion, its results likely severely underestimate the current scale of improper enrollment nationally. A broader study using a similar methodology uncovered “egregious eligibility errors in many states,” including between 2.23 million and 3.25 million improper Medicaid expansion enrollees who had income above the eligibility threshold in 2017.13
Last year, the Paragon Health Institute published the most recent quantitative assessment of the scope of improper enrollment under Medicaid expansion. Combining actual enrollment in the expansion group with an estimate of the number of eligible people plausibly enrolled derived from Census Bureau data, I calculated that approximately one in three expansion enrollees—4.9 million people—likely did not qualify for the program in 2019, imposing an annual cost to the federal government of $23.8 billion in improper Medicaid spending.14 The report also used the estimated rate of improper enrollment in each state in 2019 to generate estimates of improper enrollment in 2024. The extrapolation yielded an estimated 6.6 million improper enrollees in 2024 and a federal cost of $36.9 billion.
Applying a similar methodology to more recent data, this paper estimates the magnitude of improper expansion enrollment in 2024. As enrollment in the expansion group has grown (from 14.7 million in 2019 to 20.2 million in 2024), my central estimate implies that improper enrollment has surged to nearly one in two expansion enrollees in 2024. Large increases in per-enrollee costs have further amplified the fiscal consequences, imposing additional Medicaid costs on the federal government of approximately $54.3 billion in 2024—more than double what the federal government spent on improper enrollees in 2019.15 Using a more expansive methodology that accounts for spillover effects of improper Medicaid enrollment on the ACA exchanges, I estimate that the net federal cost of improper expansion enrollment was approximately $32.9 billion in 2024.16 Moreover, the updated 2024 results presented in this paper substantially exceed the extrapolated 2024 estimates cited above from my prior analysis, indicating that program integrity has deteriorated since 2019.
Data and Methods
This analysis relies primarily on survey data from the ACS and administrative Medicaid data reported by the Centers for Medicare and Medicaid Services (CMS) through MBES. To estimate the fiscal costs of improper enrollment, I use figures published by MACPAC.
To quantify improper enrollment, I adopt a residual-based approach that compares the actual number of expansion enrollees to an estimate of the number of eligible individuals enrolled. The difference between these two groups reflects improper enrollment. In particular, the methodology consists of four steps:
- Using ACS microdata on income, age, immigration status, and other characteristics, determine the size of the population eligible for coverage under Medicaid expansion.
- Estimate actual enrollment among eligible individuals by applying plausible take-up rates to the estimates from step 1.
- Calculate improper enrollment by comparing estimated enrollment among eligible individuals from step 2 and MBES administrative data on actual enrollment in the expansion group.
- Apply estimates of per-enrollee spending to estimate federal and state costs of improper enrollment.
It is difficult to assess the scale of improper enrollment in Medicaid between 2020 and 2023 due to the continuous coverage requirement tied to the COVID-19 public health emergency. This provision allowed people to remain de facto eligible for the program even if their circumstances (e.g., income level or family structure) did not qualify them for coverage under normal eligibility rules. The continuous coverage requirement ended in May 2023, and states began the “unwinding” process of redetermining enrollees’ eligibility. The unwinding progressed at different rates in different states, but nearly all states had completed their reviews by late summer 2024.17 Therefore, I use the average monthly number of expansion enrollees from August to December 2024 as my measure of actual expansion enrollment. As a robustness check, to test whether lingering unwinding effects may be contaminating my results, I also provide results using June 2025 data (the most recent month available) on actual expansion enrollment. This approach, shown in Table D.1 in Appendix D, produces an estimate of improper enrollment that is only slightly smaller (~5 percent) than my main result.
Another potential concern stems from the differences in how income is defined and measured across data sources. In particular, ACS data may undercount the number of individuals eligible under Medicaid expansion due to fluctuations in monthly income that are not captured by the annual income variable in the ACS. In a household with large month-to-month changes in income, an individual may be ineligible for coverage in one month but gain eligibility shortly thereafter due to a decline in income. Further, the measure of annual family income in the ACS differs from how income-based criteria are used to determine Medicaid eligibility. For example, while non-taxable income sources—such as Supplemental Security Income, child support payments, gifts, veterans’ disability payments, and workers’ compensation—are excluded from the modified adjusted gross income (MAGI) measure used to determine Medicaid eligibility, these sources are counted under the ACS’s definition of income. As a result, an individual may report income above 138 percent of the federal poverty level (FPL) to the ACS but—due to the MAGI exclusions—remain eligible for Medicaid expansion coverage.
To address these concerns, I conduct a robustness check in which I raise the threshold for eligible individuals in the ACS to 150 percent FPL instead of 138 percent FPL. For a single adult, this difference is $1,807 in annual income, or about $150 per month. At the federal minimum wage, this corresponds to about five hours of additional work per week throughout the year. This buffer should help to account for the possibility of unstable work patterns for some individuals and the fact that MAGI-based income measures are more restrictive than ACS definitions of income are. The results in Table D.2 show that, while estimates of improper enrollment shrink compared to my main findings, this higher income threshold does not undermine my central qualitative finding that a substantial level of improper enrollment existed in the Medicaid expansion group in 2024.
For more detailed information about the methods that underpin the analysis of improper enrollment and its fiscal costs, please refer to Appendix A and Appendix B, respectively.
Improper Enrollment Under Medicaid Expansion Was Substantial in 2024
Estimates of improper expansion enrollment in each expansion state are shown in Table 1. Given the central importance of the take-up rate—that is, the share of individuals eligible for coverage under Medicaid expansion who sign up for the program—I present estimates for a range of possible values. Appendix A provides additional detail about the empirical research that informs the take-up rate assumptions used in this report. Table 1 shows four possible take-up rates and the corresponding scale of improper enrollment in each state. Given the residual-based nature of this analysis, higher take-up rates mechanically shrink the size of the ineligible population.

I begin with the most extreme scenario: a take-up rate of 100 percent—that is, every eligible individual is enrolled under Medicaid expansion. Although a 100 percent take-up rate is implausible, it serves as a theoretical lower bound for improper enrollment and a useful benchmark for more realistic estimates. However, even under the assumption of 100 percent take-up, the results imply nearly 5.2 million improper enrollees nationally in 2024, representing more than one-quarter of expansion enrollment.
Next, Table 1 shows three take-up rates designed to approximate the plausible range: 85 percent, 70 percent, and 55 percent. Under the assumption of 85 percent take-up, the number of improper enrollees nationally increases to 7.1 million. Reducing the take-up rate to 70 percent increases the estimated number of improper enrollees to 9.2 million. Finally, a take-up rate assumption of 55 percent—meant to reflect the upper bound of the plausible range—produces an estimate of 11.5 million improper enrollees in 2024.
While the vast majority of expansion states exhibit evidence of improper enrollment, a small number of states contribute disproportionately to the national total. Using the mid-range 70 percent take-up rate assumption, nearly 3.1 million improper enrollees live in California alone, while Louisiana, New York, and Oregon are also hotspots for improper enrollment.
For reasons explained in Appendix A, I consider the 70 percent take-up rate to be the most plausible central estimate. Therefore, subsequent exhibits will primarily be based on this assumption.
Figures 1a and 1b adjust the scale of improper enrollment, by state, for the size of the expansion group (Figure 1a) and for the total population (Figure 1b).18 Figure 1a maps improper enrollees per 10,000 Medicaid expansion enrollees, effectively showing how concentrated the ineligibility problem is within each state’s own expansion population. By this measure, California, Oregon, Washington, Louisiana, Connecticut, and Vermont sit in the darkest category, indicating that a comparatively large share (53–75 percent) of their expansion enrollees are estimated to be ineligible. In general, states in the Northeast and Rust Belt tend to have a high proportion of improper enrollment in their expansion groups, while states in the upper Midwest tend to have lower ineligible rates (<15 percent).

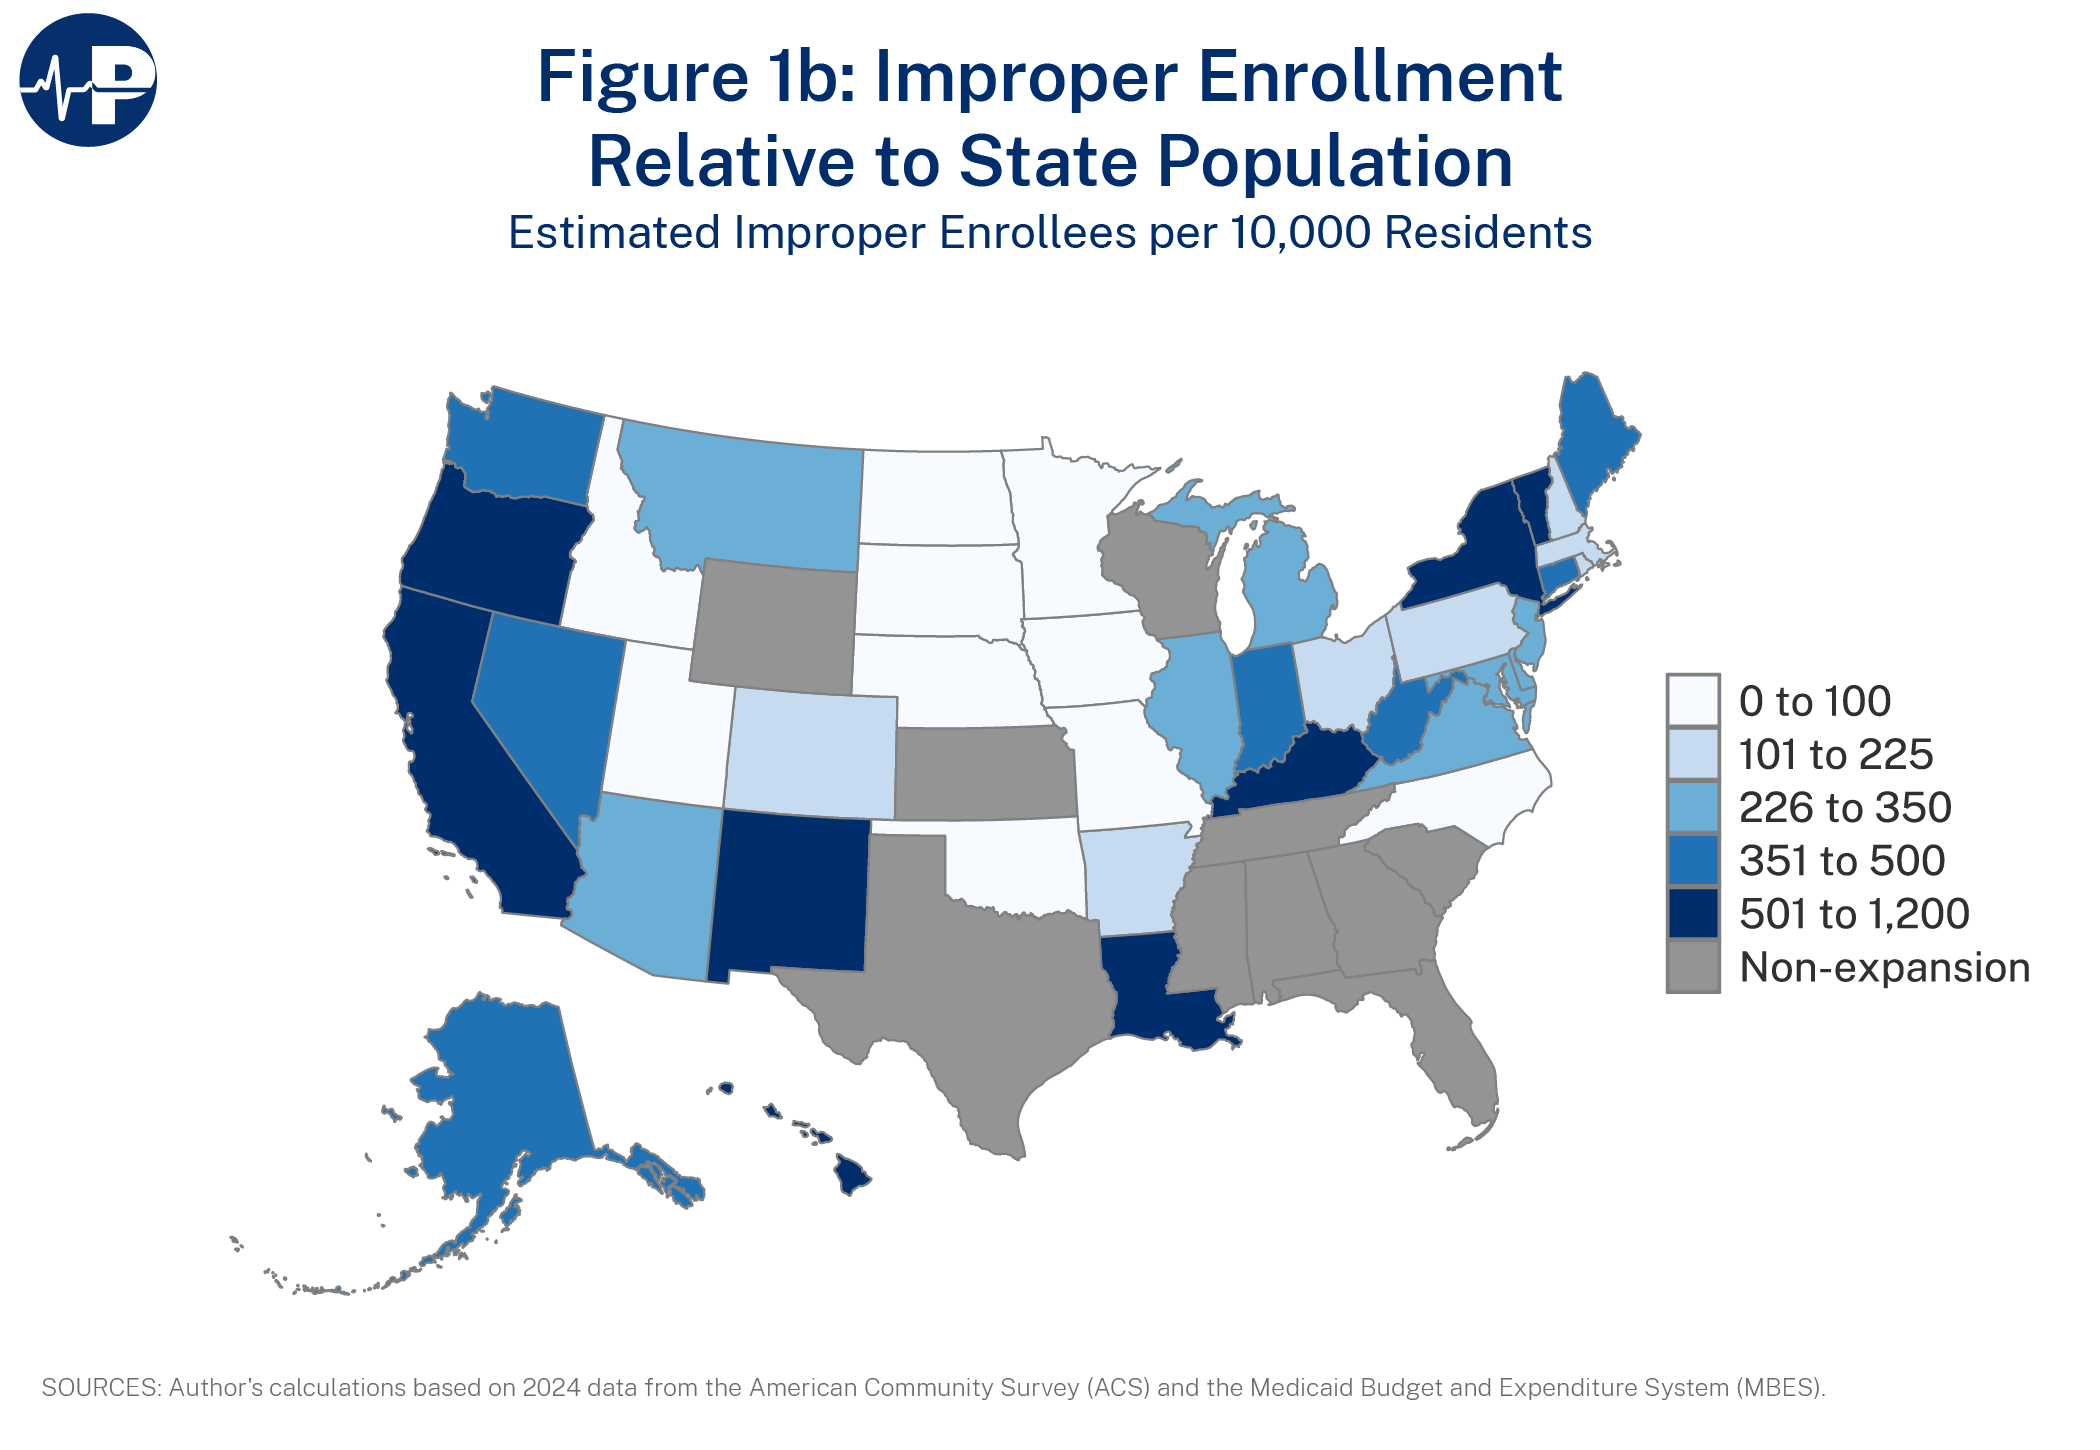
Figure 1b re-expresses the same improper enrollment figures relative to each state’s total population rather than just its expansion enrollees. The patterns are similar to Figure 1a. Several states—including New York, Kentucky, and New Mexico—move into noticeably darker categories in Figure 1b than in Figure 1a, reflecting that their improper enrollees, while perhaps a smaller share of their expansion populations specifically, still represent meaningful shares of the states. Under the preferred specification, improper expansion enrollment exceeds 5 percent of the total population in eight states and exceeds 3.5 percent of the total population in another six states.
Improper Enrollment in 2024 Imposed Heavy Fiscal Costs on the Federal Government
The scale of improper enrollment and the high level of Medicaid per-enrollee costs have resulted in considerable improper federal spending.
To accurately quantify the fiscal impact of improper enrollment—particularly the distributional burden on the federal government and the states—several important facts must be incorporated into the analysis. First, some ineligible individuals enrolled in the expansion group would likely qualify for Medicaid through alternative eligibility pathways. Hence, it is important to distinguish between two types of improper enrollees: (1) individuals who are not eligible for any Medicaid coverage and (2) individuals who are eligible for Medicaid coverage under traditional rules but have been misclassified into the expansion group (e.g., a pregnant woman misclassified as an expansion enrollee). While the first group imposes costs on both the federal government and the states, the second group shifts costs from the states to the federal government due to the higher matching rates applicable to expansion enrollees.
As a result, improper enrollment imposes unambiguous costs on the federal government, but states could achieve budget savings if the share of misclassified enrollees among all improper enrollees is sufficiently high.19 Drawing on estimates from federal audits, I assume that 36 percent of improper expansion enrollees qualify for Medicaid coverage through traditional pathways. The remaining 64 percent are assumed to be ineligible for any Medicaid coverage. The remaining 64 percent of enrollees can be further divided into two subgroups based on their eligibility for coverage through the ACA exchanges; each subgroup imposes different net costs on the federal government.
See Appendix B for more details about how the fiscal estimates are calculated. The results are back-of-the-envelope estimates based on available data. They should be interpreted with caution as some assumptions are uncertain, particularly the counterfactual allocation of improperly enrolled individuals across Medicaid, ACA exchange, and uninsured outcomes.
Because Table 2 incorporates likely interactions between Medicaid and ACA exchange enrollment, I consider these estimates the preferred measure of the federal fiscal impact.20

As a baseline, I provide estimates using a 100 percent take-up assumption. Under this scenario, the federal government incurred costs of approximately $18.2 billion from improper enrollment in 2024, while states collectively saved $3.9 billion. Using the more realistic, mid-range assumption of 70 percent take-up, federal costs climb to $32.9 billion, and aggregate state savings increase to $6.8 billion.
There is substantial variation across states stemming from differences in the number of improper enrollees, state-specific per-enrollee costs, the spread between the federal matching rates for traditional and expansion enrollees, and the level of subsidies provided under the ACA. Assuming a 70 percent take-up rate, California accounts for the largest share of federal costs by far ($10.4 billion) while saving nearly $2.5 billion by shifting other Medicaid costs to the federal government through misclassifications. Other substantial sources of federal costs include New York, Washington, Oregon, and Louisiana.
West Virginia presents a unique case of both the federal government and the state achieving savings from improper enrollment. This is because premiums—and hence, subsidies—in the ACA exchanges are exceptionally high in West Virginia, while per-enrollee spending on Medicaid expansion is exceptionally low. Therefore, in the absence of improper enrollment in Medicaid, the shift to the ACA exchanges—some of which would likely be improper—would result in even higher federal costs. The state savings in West Virginia reflect the impact of misclassifications from the traditional Medicaid population.
The federal fiscal costs of improper enrollment in Medicaid are further reduced because the analysis assumes that some individuals who were improperly enrolled in Medicaid would instead have improperly received subsidized ACA exchange coverage. If the ACA exchanges had robust eligibility verification, the estimated federal cost of improper Medicaid enrollment would rise, because improper exchange enrollment (and its associated costs for the federal government) would not be a viable alternative to improper Medicaid enrollment. This is the main reason why the federal fiscal impact reported in Table 2 is smaller than the federal fiscal impact reported in Table C.1, which excludes spillover effects on the ACA exchanges. This adjustment recognizes that some individuals would instead improperly receive federally subsidized ACA exchange coverage, so those federal costs should not be double counted when estimating the net fiscal impact.
Improper Expansion Enrollment Increased Sharply from 2019 to 2024
The scale of improper enrollment grew substantially through the COVID-19 pandemic and the Biden administration. Table 3 compares state-level improper enrollment in 2019 (reproduced from last year’s report) to the new estimates for 2024. Both sets of estimates are based on a take-up rate assumption of 70 percent. In the 2019 analysis, 28 of 32 expansion states showed evidence of improper enrollment. In 2024, the number of expansion states had increased to 41 (including the District of Columbia), of which 36 had detectable levels of improper enrollment. I find no evidence that improper enrollment declined in any state from 2019 to 2024.

Nationally, I estimate that the number of improper Medicaid enrollees in the expansion group increased from 4.9 million in 2019 to 9.2 million in 2024—an 88 percent increase. In part, this is due to more states expanding Medicaid between 2019 and 2024, mechanically enlarging the enrollment pool.21 But the vast majority of the growth in improper enrollment occurred in states that had expanded prior to 2019 and were included in last year’s analysis. Limiting the comparison to the same set of 32 expansion states in both years, I find that improper enrollment grew by 80 percent from 2019 (4.9 million) to 2024 (8.8 million).
As a share of total expansion enrollment, the estimated ineligible rate rose from 33 percent in 2019 to 46 percent in 2024—meaning that nearly half of expansion enrollees in 2024 were likely ineligible for coverage.22 The ineligible rate increased in nearly all states for which comparable estimates are available. Several states saw especially dramatic increases. In Arizona, the estimated ineligible share of the expansion group climbed from 3 percent in 2019 to 42 percent in 2024. Earlier this year, an Arizona lawmaker warned that improper Medicaid payments were costing taxpayers billions of dollars per year.23 In Illinois, the ineligible rate rose from 9 percent to 35 percent. In Indiana and Ohio—states where no improper enrollment was detected in 2019—the 2024 estimates imply hundreds of thousands of improper enrollees. States with already-high ineligible rates in 2019 also saw further deterioration in program integrity: In Oregon, the estimated share of improper enrollees rose from 57 percent to 73 percent, and in Louisiana it rose from 32 percent to 62 percent.
In absolute terms, the states with the largest estimated ineligible populations in 2024 were California (3.09 million), New York (1.01 million), Louisiana (~497,000), Oregon (~482,000), and Washington (~342,000). In 2024, 20 states had more than 100,000 improper enrollees, up from 12 states in 2019.
The surge in improper enrollment across states is captured in Figure 2, which shows the change in the number of improper enrollees from 2019 to 2024. Improper enrollment increased in 31 of the 32 states that had expanded Medicaid before 2019, with California standing out dramatically: Its improper enrollee count grew by roughly 1.4 million over the period, nearly doubling and far outpacing every other state. Louisiana, Indiana, Arizona, Illinois, Oregon, and Ohio also experienced large increases in improper enrollment, each adding more than 200,000 improper enrollees, while the remaining expansion states saw smaller (though still positive) growth. North Dakota was the lone exception, showing no evidence of improper enrollment in either 2019 or 2024. These patterns illustrate that the growth in improper enrollment was not confined to a handful of outlier states but was a broad-based phenomenon across the Medicaid expansion population.

Table 4 breaks down the state shares of estimated improper enrollment for 2019 and 2024. Over time, improper enrollment has become somewhat more evenly distributed across states, with relatively smaller shares of total improper enrollment concentrated in a few states. In 2019, the five states with the largest estimated ineligible populations—California, New York, Oregon, Washington, and New Jersey—collectively accounted for 66.5 percent of total estimated improper enrollment nationwide. In 2024, the top five states had shifted to California, New York, Louisiana, Oregon, and Washington, and combined they represented 58.7 percent of total estimated improper enrollment nationwide. This pattern demonstrates that while a handful of states account for a disproportionate share of improper enrollment, deficiencies in program integrity are widespread around the country.
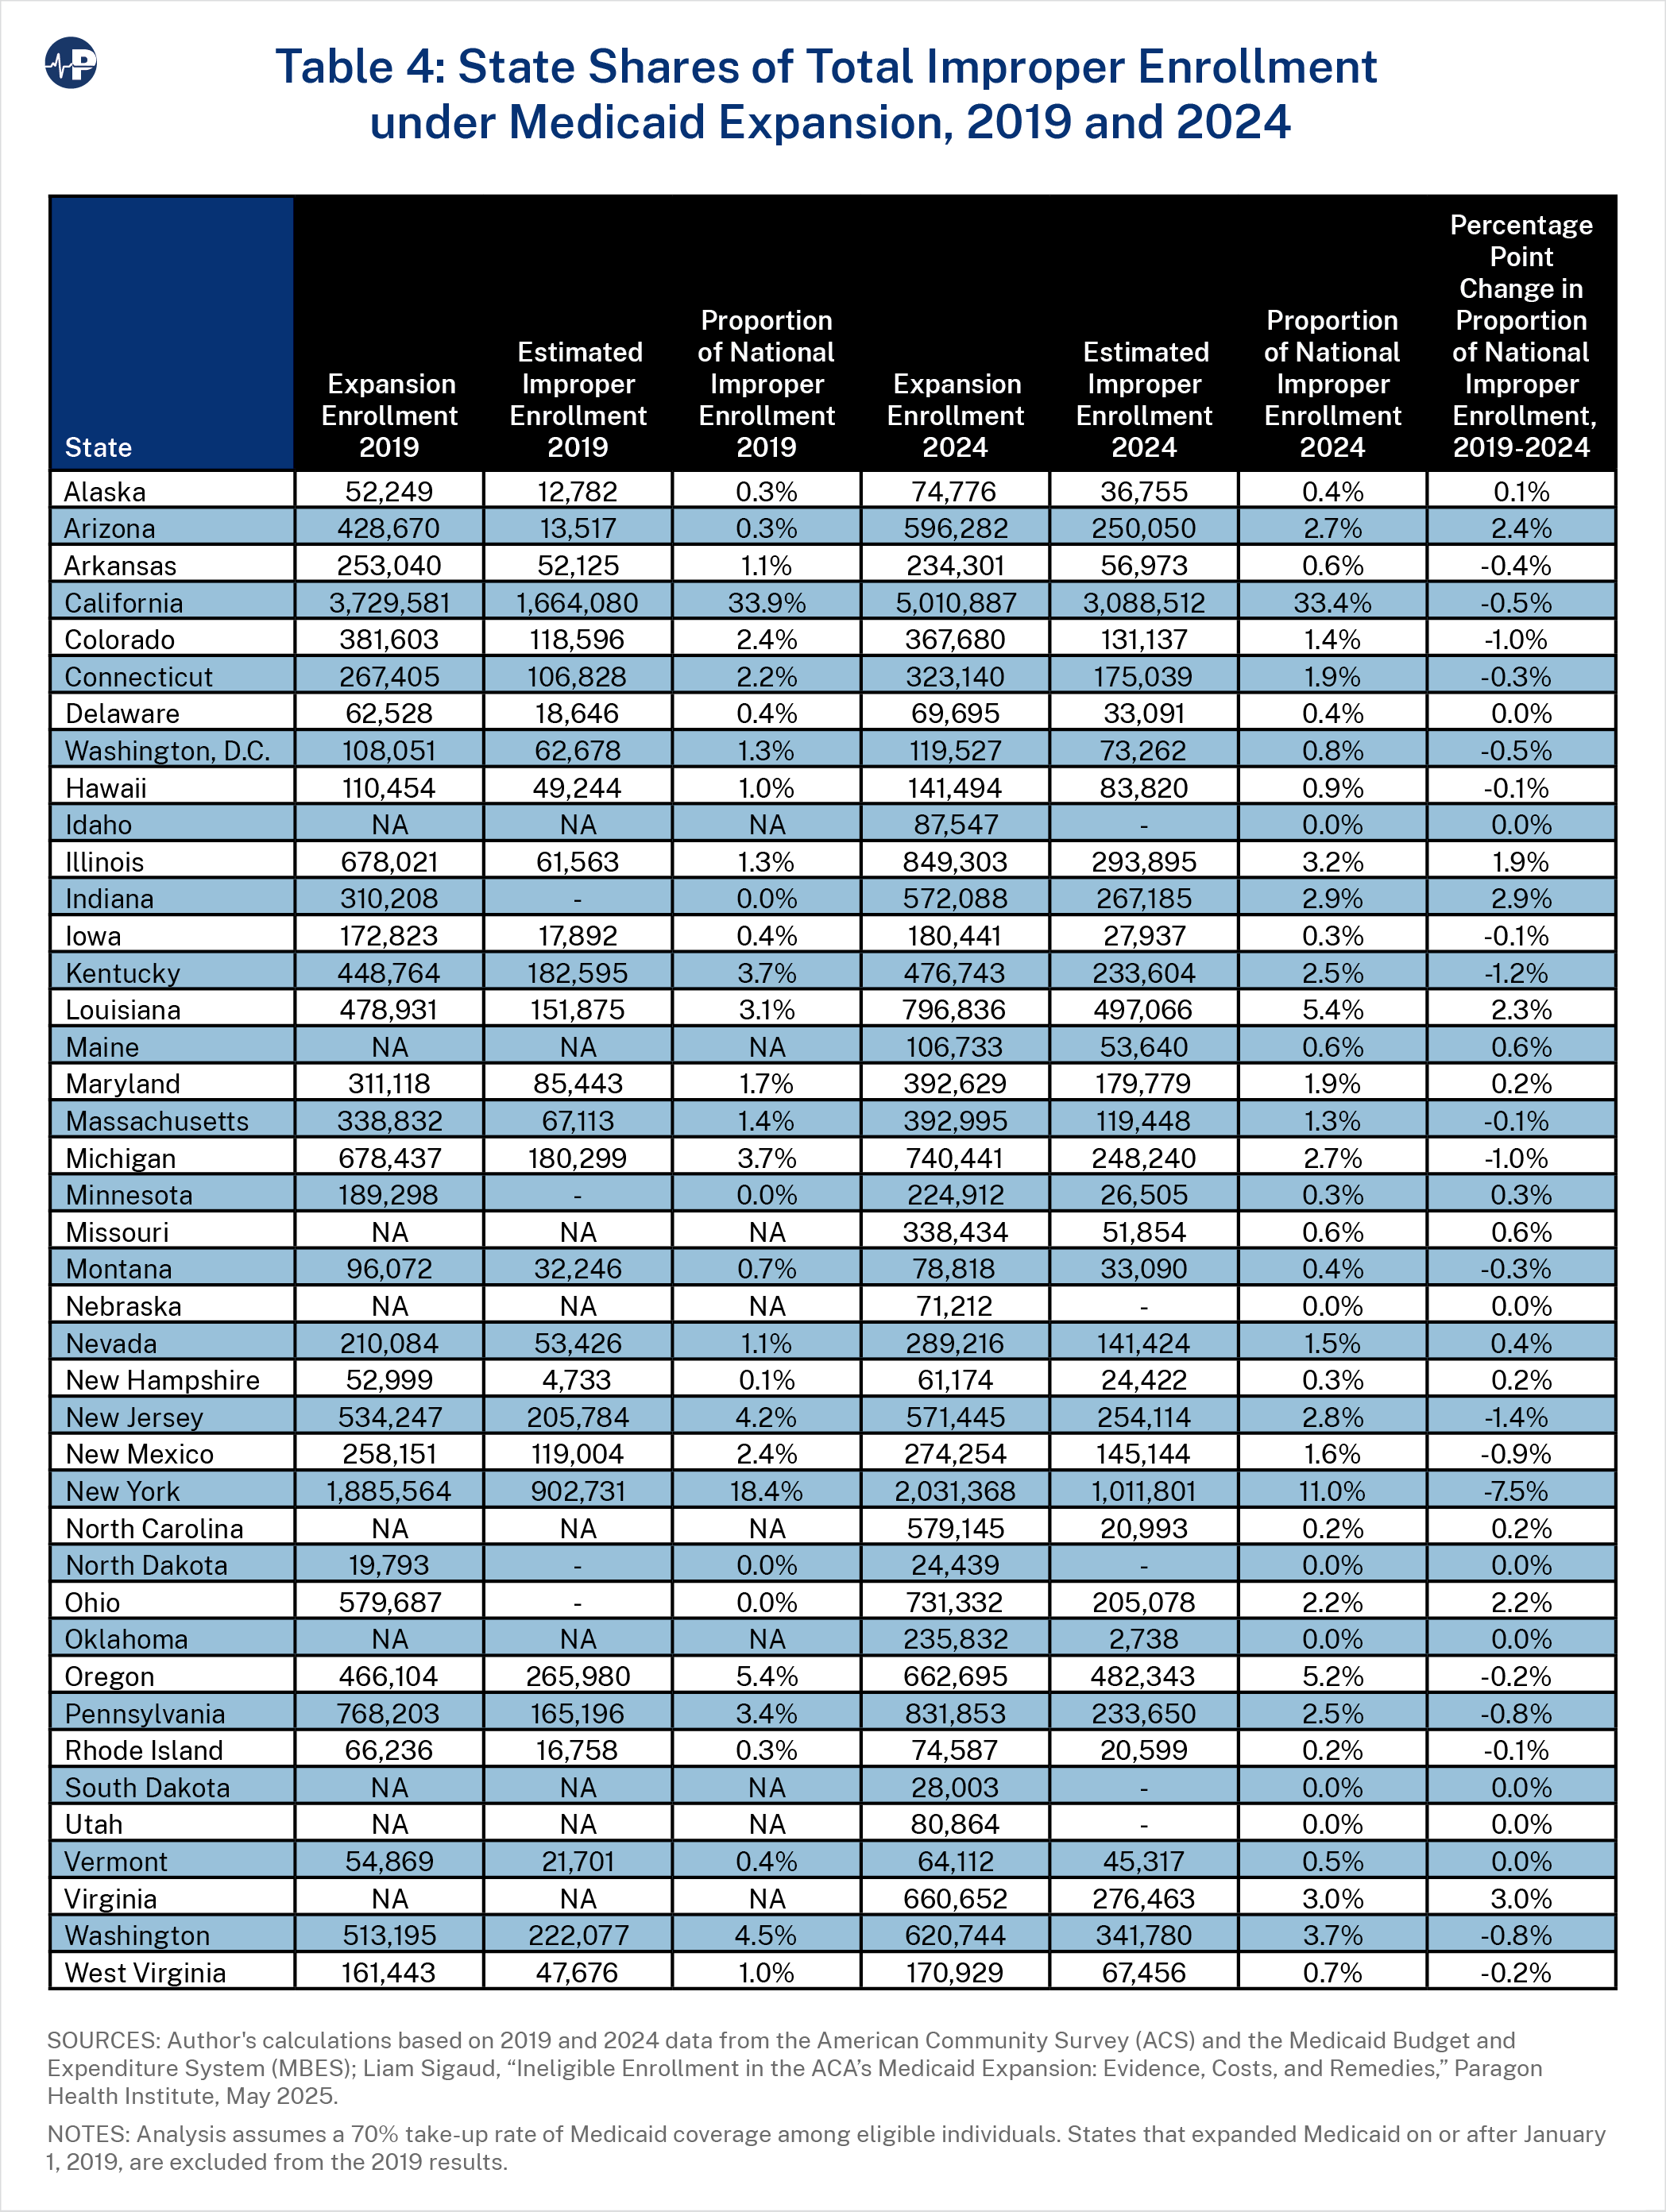
The most notable shift depicted in Table 4 concerns New York, which declined as a share of total improper enrollment from 18.4 percent in 2019 to 11.0 percent in 2024. The fact that this decline occurred despite an increase of more than 100,000 in the number of improper enrollees in New York illustrates how much national improper enrollment soared between 2019 and 2024.
California alone contributed roughly one-third of the national total in both 2019 and 2024, a striking concentration that reflects both the state’s large expansion population and high estimated ineligible rates of 45 percent in 2019 and 62 percent in 2024.
Enrollment Under Medicaid Expansion Remains Far Above Pre-Pandemic Levels
The sharp increase in improper enrollment between 2019 and 2024 was likely fueled by COVID-era policy decisions that allowed Medicaid enrollment to spike without adequate guardrails to prevent abuse. From March 2020 to May 2023, a continuous coverage requirement applied to Medicaid that prevented states from conducting routine eligibility checks and removing people who no longer qualified for the program. This contributed to massive enrollment growth from 15.2 million people in the expansion group in January 2020 to 24.1 million in May 2023—an increase of 8.9 million enrollees, or 59 percent. Although states resumed eligibility determinations in mid-2023, the process appears to have been insufficient to remove large numbers of people who had become ineligible.
This pattern is evident in Figure 3, which tracks enrollment trends from January 2020 to June 2025 for the expansion group and traditional Medicaid enrollees (e.g., children). For ease of comparison, both groups are indexed to 1 in January 2020—hence, for example, a value of 1.2 indicates an increase of 20 percent relative to January 2020. For consistency, the sample is restricted to states that expanded Medicaid prior to January 2020 to purge the data of mechanical increases in enrollment stemming from additional states expanding Medicaid during the 2020–2025 period.24 Enrollment in both groups (expansion and traditional) rose steadily between March 2020 and May 2023, as expected under the continuous coverage requirement. Beginning in mid-2023, enrollment declined in both groups and began to level off in mid-2024 as most states completed their unwinding process. But while enrollment among traditional enrollees approached pre-pandemic levels by June 2025, enrollment in the expansion group remained markedly elevated—21 percent above its pre-pandemic levels.

Given the incentives established through Medicaid’s financing structure, these patterns are not surprising. Because states bear only a small part of the cost of improper enrollment in the expansion group, they had little motivation to take effective unwinding measures that would have identified and removed improper expansion enrollees. On the other hand, states bear a substantially higher share of the cost of traditional enrollees, making them less willing to tolerate elevated improper enrollment among traditional beneficiaries.
Policy Recommendations
The results above suggest widespread improper enrollment in Medicaid expansion that has significantly worsened over time. The substantial fiscal costs associated with estimated improper enrollment underscore the urgency of policy reforms to restore integrity to the program. Some reforms have already been set in motion by Congress and the Trump administration through the OBBB. It is important to emphasize that the estimates in this paper, which are based on 2024 data, predate these actions.
Beginning in 2027, states will be required to conduct eligibility redeterminations every six months for expansion adults (rather than annually) and improve processes to prevent duplicative Medicaid enrollment in multiple states. Beginning in 2028, restrictions on provider taxes and state-directed payments will limit states’ ability to shift Medicaid costs to the federal government, making state policymakers more sensitive to the fiscal consequences of improper enrollment. Beginning in 2030, financial penalties will be imposed on states with high payment rates linked to eligibility errors. These measures represent meaningful guardrails to prevent abuse, but their real-world impact largely depends on their implementation by states. Without strong federal oversight and accountability, states may seek to circumvent these requirements to avoid addressing improper enrollment.
Federal policymakers should consider going further to remove improper expansion enrollees in Medicaid and stem the flow of new improper enrollment. Additional reforms should include the following:
- Reducing the 90 percent federal matching rate for expansion enrollees to the same rate states receive for traditional enrollees. This would substantially strengthen states’ incentives to conduct timely and accurate eligibility reviews of expansion enrollees by ensuring that improper enrollment imposes tangible costs on state budgets.
- Strengthening income verification at enrollment by tightening “reasonable compatibility” thresholds for self-attestation and broadening real-time wage/income data checks (e.g., state wage databases, tax records).
- Eliminating the federal requirement that states conduct eligibility reviews passively (
- Extending the current PERM program by requiring independent, annual eligibility audits in every state. This would provide more up-to-date information on improper enrollment, allowing error-rate penalties to be imposed swiftly and corrective action to be taken.
Conclusion
The harm from improper enrollment extends beyond the federal budget. Improper expansion enrollees crowd out intended beneficiaries, including the traditional Medicaid population—children, pregnant women, the elderly, and people with disabilities—for whom the program was originally designed. Studies have documented that expansion exacerbated health system strain, resulting in longer waits for medical appointments, reduced health spending on low-income children, and worse access to emergency care.25 Restoring eligibility integrity to Medicaid expansion is not merely a matter of fiscal responsibility; it is a matter of fairness to the vulnerable populations that the program was built to serve.
Appendix A: Methodology for Estimating Improper Enrollment
To estimate the number of improper enrollees under Medicaid expansion in each state, I proceed in three steps:
- Determine the number of individuals eligible for coverage under Medicaid expansion.
- Estimate actual enrollment among eligible individuals by combining the estimates from step 1 with a plausible take-up rate of Medicaid coverage.
- Calculate improper enrollment by comparing estimated enrollment among eligible individuals from step 2 against administrative data on actual enrollment in the expansion group.
I use the ACS to estimate the number of individuals eligible for coverage under Medicaid expansion. The ACS is sent to approximately 3.5 million addresses annually, representing 1 percent of the U.S. population. Data quality is high, with response rates typically above 90 percent. The survey collects information about family structure, citizenship status, educational attainment, income, disability, employment, and housing characteristics, among other topics.
To approximate the population eligible for Medicaid expansion, I impose several restrictions on the full ACS sample to exclude groups that are either generally ineligible for federal Medicaid funding (e.g., recent immigrants) or eligible for Medicaid through alternative pathways (e.g., people with disabilities). Specifically, I drop individuals who meet at least one of the following criteria:
- Under age 19 or over age 64
- Annual family income above 138 percent FPL26
- Living with at least one child in the home and annual family income below the eligibility threshold for parental Medicaid coverage
- Receiving any Supplemental Security Income
- Having a cognitive or physical impairment that interferes with activities of daily living
- Non-citizen who has been in the United States less than five years
After these exclusion criteria are imposed, the remaining observations represent the pool of individuals eligible for coverage under Medicaid expansion. I apply ACS sampling weights to calculate the size of this eligible population in each state.
The number of people eligible for coverage under Medicaid expansion is unlikely to equal the number of actual enrollees. The take-up rate for a social assistance program refers to the percentage of eligible individuals who actually enroll to receive benefits or services. There are a variety of reasons why individuals may not participate in assistance programs for which they qualify, including the availability of other sources of coverage, a lack of awareness, administrative barriers, stigma, and other frictions. To accurately calculate the number of eligible enrollees under Medicaid expansion, it is crucial to account for imperfect take-up. Otherwise, the eligible population will be inflated and improper enrollment will be understated.
A number of studies have attempted to estimate the take-up rate in Medicaid, and I ground my take-up rate assumptions in this empirical literature. According to one study, the take-up rate for Medicaid expansion was approximately 44 percent in 2014–2015 and 53.8 percent in 2016–2017.27 These estimates are broadly consistent with previous estimates of Medicaid take-up rates among adults eligible for coverage prior to the ACA, which ranged from about 50 percent to 80 percent, with most estimates falling below 65 percent.28 The elimination of the ACA’s individual mandate in 2019 may have further reduced the take-up rate relative to prior years when the mandate was still in effect. Another consideration is that take-up rates likely increased over time as more people became aware of the new eligibility rules. Hence, take-up rates measured in the early years of Medicaid expansion may have been somewhat lower than the take-up rates in 2019 and beyond (i.e., the period I examine in this report). Consistent with this prediction, a recent analysis suggests that the take-up rate for Medicaid coverage among non-elderly, childless adults (roughly corresponding to the expansion population) increased slightly from 68.4 percent in 2017–2019 to 72.6 percent in 2023 amid the post-COVID unwinding.29 Taking all these factors and empirical estimates into consideration, I assume a take-up rate of 70 percent as the mid-range estimate in this analysis.
Finally, I compare my estimates of the number of enrolled eligible individuals with administrative data on the actual number of expansion enrollees in each state. This information comes from MBES, the database used by CMS to compute the amount of federal aid states receive to fund their Medicaid programs. To minimize the effects of the post-COVID Medicaid unwinding, I use the average monthly number of expansion enrollees from August to December 2024.30 According to CMS, only six states expected to complete unwinding-related renewals in August 2024 or later.31 As a robustness check, Table D.1 reports the results of using June 2025 data (the most recent month available) on actual expansion enrollment. This approach produces an estimate of 8.7 million improper enrollees nationally—only slightly smaller than my main result of 9.2 million.
Combining these pieces, the core estimate of improper enrollment in each expansion state (indexed by ) is obtained using the following formula:

Appendix B: Methodology for Estimating the Fiscal Costs of Improper Enrollment
In calculating the fiscal costs of improper expansion enrollment, it is necessary to distinguish between two types of improper enrollees: (1) individuals who are not eligible for any Medicaid coverage and (2) individuals who are eligible for Medicaid coverage through traditional pathways (e.g., people with disabilities) but have been misclassified into the expansion group. While the first type of improper enrollee imposes costs on both the federal government and the states, the second group shifts costs from the states to the federal government due to the higher federal matching rates applicable to expansion enrollees. As a result, improper enrollment imposes unambiguous costs on the federal government, but if the share of misclassified enrollees among all improper enrollees is sufficiently high, states can achieve budget savings.
There is little reliable data on the respective size of each group. To obtain a numerical estimate, I base my calculations on audits conducted in California32 and Colorado33 by the Office of Inspector General at the Department of Health and Human Services. In each state, investigators calculated the proportion of improper expansion enrollees who should have been classified into different eligibility categories. The results revealed that 37.5 percent and 35.7 percent of improper enrollees had been misclassified in California and Colorado, respectively. The stability of the estimates between the two states provides some reassurance that similar ratios are plausible in the rest of the country. Drawing on these findings, the analysis assumes that 36 percent of improper enrollees are misclassified, and the remaining 64 percent are assumed to be ineligible for any Medicaid coverage.
Further complicating the analysis, the enrollees ineligible for any Medicaid coverage can be divided into two subgroups: (1a) individuals who are eligible for coverage through the ACA exchanges and (1b) individuals who are not eligible for coverage through the ACA exchanges. Subgroup 1a is largely composed of individuals earning above 138 percent FPL, while subgroup 1b is largely composed of individuals who fail to meet non-income eligibility requirements (e.g., rules related to immigration status, age, or the availability of affordable employer-based coverage).
Based on the available evidence and the characteristics of expansion enrollees, I assume that group 1a accounts for 30 percent of improper expansion enrollment; I assign the remaining enrollees (34 percent) to group 1b. These assumptions are based on federal Medicaid audits34 as well as academic research.35 Moreover, previous Paragon research has documented substantial levels of improper enrollment in the ACA exchanges in 2024.36 Therefore, I further assume that 50 percent of group 1b (i.e., 17 percent of total improper expansion enrollees) would have improperly enrolled in fully subsidized exchange plans if they had not been enrolled in Medicaid.37
To quantify Medicaid costs, I use state-level data on per-enrollee spending on the expansion group and all Medicaid enrollees from MACPAC. The latest available data are for FY2023, so I inflate FY2023 costs to 2024 dollars using the medical care component of the Consumer Price Index (CPI-M) from the Bureau of Labor Statistics. Due to idiosyncrasies in state data management practices, MACPAC does not provide estimates of per-enrollee costs in the expansion group for Vermont. Data is also missing for North Carolina, because it expanded its Medicaid program in late 2023. For both states, I impute the value using the median per-enrollee cost among the other expansion states.
In estimating federal subsidy costs in the ACA exchanges, I assume that a typical enrollee in group 1a is 45 years old, single, and childless with an income at 175 percent FPL38 who resides in the county containing the state’s most populous city.39 As with Medicaid coverage, some people eligible for ACA coverage will not enroll for a variety of reasons. I assume a take-up rate of ACA coverage of 70 percent for this population.
To estimate the federal and state costs from individuals ineligible for any Medicaid coverage (group 1), I account for the per-enrollee cost of the expansion, the average annual ACA subsidy, the assumed take-up rate of exchange coverage (70 percent), and the federal-state financing split for expansion enrollees (based on the statutory federal matching rate, I assign 90 percent of these total costs to the federal government and 10 percent to the state).40
The federal and state costs for misclassified individuals are calculated differently, as these do not reflect new costs for the Medicaid program but rather a shifting of costs from states to the federal government. For each state, I calculate the total cost of these enrollees by multiplying the estimated number of misclassified individuals by the per-enrollee cost of all Medicaid enrollees.41 To capture the cost shifting to the federal government, I then multiply that product by the difference in federal matching rates between the expansion group (90 percent) and traditional Medicaid enrollees (approximately 60 percent, on average). The state costs are simply the federal costs multiplied by -1.
Finally, I obtain the full costs of improper enrollment for the federal government and the states by summing the costs of each of the two groups described above.
I consider these assumptions to be reasonable back-of-the envelope estimates based on available data. However, results should be interpreted with caution. The true amount of improper federal spending may be several billion dollars higher or lower than my estimates indicate.
Appendix C: Comparison of Fiscal Costs of Improper Enrollment in 2019 and 2024 Using Consistent Methodology
The estimates of the fiscal costs of improper enrollment presented in the main section of the paper include an adjustment for the possibility that individuals who are ineligible for Medicaid expansion would otherwise be enrolled in subsidized coverage on the ACA exchanges. This methodological refinement had not been incorporated into my earlier analysis of improper Medicaid enrollment in 2019. Here, to facilitate an apples-to-apples comparison between the 2019 and 2024 fiscal estimates and accommodate a broader range of possibilities, I present fiscal impact estimates for 2019 and 2024 under the consistent assumption that no improper Medicaid expansion enrollees would be enrolled in the ACA exchanges if they did not have Medicaid coverage. In other words, this shows improper Medicaid expenditures but not the overall federal cost, because many improperly enrolled Medicaid expansion enrollees would enroll in the subsidized ACA exchanges. For both years, I assume a take-up rate of 70 percent among the Medicaid-eligible population.
The results, shown in Table C.1, indicate that the federal Medicaid costs of improper enrollment have risen dramatically over recent years from $23.8 billion in 2019 to $54.3 billion in 2024. At the same time, the growth of improper enrollment has benefited state budgets due to the cost savings tied to misclassifying traditional Medicaid enrollees. In 2019, states experienced aggregate savings of $4.2 billion, which increased to $6.8 billion in 2024.
There is substantial variation across states, reflecting differences in the number of improper enrollees, state-specific per-enrollee costs, and the spread between the federal matching rates for traditional and expansion enrollees. In both 2019 and 2024, California accounted for the largest share of federal costs by far ($7.7 billion in 2019 and $16.4 billion in 2024) while saving $1.3 billion in 2019 and nearly $2.5 billion in 2024. Other substantial sources of federal costs include New York, New Jersey, Washington, Oregon, and Pennsylvania.

Appendix D: Estimates of Improper Enrollment Under Alternative Assumption


Footnotes
1↑ Historically, eligibility for Medicaid was generally limited to low-income children and their caregivers, pregnant women, the elderly, and people with disabilities. The ACA dramatically expanded Medicaid, creating a new eligibility category for non-elderly, able-bodied adults with incomes up to 138 percent of the federal poverty level (the "expansion group"). To date, 40 states and the District of Columbia have expanded Medicaid.
2↑ Joel Zinberg and Liam Sigaud, "What Matters for Health: Insurance Is Less Important Than You Think," Paragon Health Institute, December 2024, https://paragoninstitute.org/public-health/what-matters-for-health-insurance-is-less-important-than-you-think/
3↑ Brian Blase and Aaron Yelowitz, "The ACA's Medicaid Expansion: A Review of Ineligible Enrollees and Improper Payments," Mercatus Center at George Mason University, November 2019, https://papers.ssrn.com/sol3/papers.cfm?abstract_id=3515323
4↑ Jonathan Ingram, "The ObamaCare Expansion Enrollment Explosion," Foundation for Government Accountability, April 2015, https://thefga.org/research/the-obamacare-expansion-enrollment-explosion/
5↑ The federal share of expansion costs was set at 90 percent in 2020. From 2014 to 2019, the federal share was even higher, further insulating states from the fiscal costs of improper enrollment.
6↑ Brian Blase and Drew Gonshorowski, "Medicaid Financing Reform: Stopping Discrimination Against the Most Vulnerable and Reducing Bias Favoring Wealthy States," Paragon Health Institute, July 2024, https://paragoninstitute.org/medicaid/medicaid-financing-reform-stopping-discrimination-against-the-most-vulnerable-and-reducing-bias-favoring-wealthy-states/
7↑ Liam Sigaud et al., "The Hidden Subsidy of the Affordable Care Act," Mercatus Center at George Mason University, July 2024, https://papers.ssrn.com/sol3/papers.cfm?abstract_id=4889920
8↑ Department of Health and Human Services (HHS), Office of Inspector General (OIG), New York Did Not Correctly Determine Medicaid Eligibility for Some Newly Enrolled Beneficiaries, January 5, 2018, https://oig.hhs.gov/reports/all/2018/new-york-did-not-correctly-determine-medicaid-eligibility-for-some-newly-enrolled-beneficiaries/
9↑ HHS OIG, California Made Medicaid Payments on Behalf of Newly Eligible Beneficiaries Who Did Not Meet Federal and State Requirements, February 20, 2018, https://oig.hhs.gov/reports/all/2018/california-made-medicaid-payments-on-behalf-of-newly-eligible-beneficiaries-who-did-not-meet-federal-and-state-requirements/
10↑ HHS OIG, Colorado Did Not Correctly Determine Medicaid Eligibility for Some Newly Enrolled Beneficiaries, August 30, 2019, https://oig.hhs.gov/reports/all/2019/colorado-did-notcorrectly-determine-medicaid-eligibility-for-some-newlyenrolled-beneficiaries/
11↑ In California, for example, as many as 52 percent of expansion enrollees may have been ineligible, according to federal investigators.
12↑ Charles J. Courtemanche et al., "Medicaid Coverage Across the Income Distribution Under the Affordable Care Act," National Bureau of Economic Research, August 2019, https://www.nber.org/papers/w26145
13↑ Blase and Yelowitz, "The ACA's Medicaid Expansion."
14↑ See Liam Sigaud, "Ineligible Enrollment in the ACA's Medicaid Expansion: Evidence, Costs, and Remedies," Paragon Health Institute, May 2025, This estimate does not include spillover fiscal effects on the ACA exchanges (e.g., individuals who would enroll in subsidized exchange plans if they were not improperly enrolled in Medicaid). Incorporating those second-order effects would reduce the federal cost https://paragoninstitute.org/medicaid/ineligible-enrollment-in-the-acas-medicaid-expansion-evidence-costs-and-remedies/
15↑ Sigaud, "Ineligible Enrollment in the ACA's Medicaid Expansion."
16↑ Due to the change in methodology, this figure should not be used for comparisons with the 2019 estimate.
17↑ CMS, "Scheduled State Timelines for Completing Unwinding-Related Renewals: Preliminary Analysis as of May 2024," https://www.medicaid.gov/resources-for-states/downloads/sst-cmpltng-unwndng-rnwls-prlmnry-anlys-05312024.pdf
18↑ The estimates of improper enrollment are based on a 70 percent take-up assumption. The color shading of each map approximates quintiles, though numbers were rounded for ease of interpretation. Non-expansion states are shaded gray and excluded from the analysis.
19↑ Introducing a misclassification assumption reduces federal costs because misclassifications, on a per-enrollee basis, are less costly to the federal government than is covering individuals who do not qualify for any Medicaid coverage. The misclassification assumption also dramatically changes the results for states. States benefit from misclassification because the federal matching rate for enrollees misclassified into the expansion group is substantially higher than the matching rate for traditional enrollees. These state savings from misclassifications offset the direct state costs of covering individuals ineligible for Medicaid through any pathway.
20↑ I do not attempt to model the fiscal implications of improper Medicaid expansion enrollment on employer-sponsored insurance, labor supply, and tax revenues. These effects are beyond the scope of this analysis and are expected to be relatively small.
21↑ Nine states expanded Medicaid between 2019 and 2024: Maine (2019), Virginia (2019), Idaho (2020), Utah (2020), Nebraska (2020), Oklahoma (2021), Missouri (2021), South Dakota (2023), and North Carolina (2023).
22↑ The improper enrollment rate I calculate for 2024 (46 percent) is somewhat higher than the rate measured through direct federal audits discussed earlier in the paper. Several factors could explain this difference. First, the federal audits were conducted in the early, pre-COVID era of Medicaid expansion (generally in 2018 or earlier). It is plausible that improper enrollment worsened over time, especially after the continuous enrollment requirement was implemented and program participation surged. Second, the federal audits were conducted in a small subset of expansion states. Improper enrollment rates could vary considerably?as my results suggest?across states.
23↑ Zachery Schmidt, "Shamp: Arizona Gives $6B Yearly in Improper Medicaid Payments," The Center Square, January 29, 2026, https://www.thecentersquare.com/arizona/article_b1a207ca-770e-4e4e-b162-18fcdadeac50.html
24↑ This restriction results in dropping seven of the 41 expansion states: Idaho (expanded in 2020), Utah (expanded in 2020), Nebraska (expanded in 2020), Oklahoma (expanded in 2021), Missouri (expanded in 2021), South Dakota (expanded in 2023), and North Carolina (expanded in 2023).
25↑ Liam Sigaud, "Losing Focus: How the ACA's Medicaid Expansion Left Traditional Enrollees Behind," Paragon Health Institute, February 2025, https://paragoninstitute.org/paragon-prognosis/losing-focus-how-the-acas-medicaid-expansion-left-traditional-enrollees-behind/
26↑ To address concerns stemming from differences in how income is defined and measured between the ACS and Medicaid eligibility rules, I conduct a robustness check in which I raise the threshold for eligible individuals in the ACS to 150 percent FPL instead of 138 percent FPL. The results in Table D.2 show that while estimates of improper enrollment shrink compared to my main findings (from 9.2 million to 8.2 million under a 70 percent take-up rate assumption), evidence of substantial improper enrollment in 2024 persists.
27↑ Salam Abdus, "Trends in Medicaid Take-Up Among Eligible Adults After the Affordable Care Act Medicaid Expansions: 2014?2019," Medical Care Research and Review 82, no. 1 (2024): 100?106, https://journals.sagepub.com/doi/abs/10.1177/10775587241273429
28↑ B. Sommers et al., "Understanding Participation Rates in Medicaid: Implications for the Affordable Act," March 16, 2012, ASPE Issue Brief, https://aspe.hhs.gov/sites/default/files/private/pdf/76411/ib.pdf
29↑ Rebecca Smith et al., "Who Enrolls in Coverage and Who Remains Uninsured? Medicaid Take Up Before and After the Affordable Care Act and During Unwinding," The Milbank Quarterly 103, no. 2 (2025): 349?389.
30↑ In March 2020, the federal government imposed a continuous coverage requirement on Medicaid, prohibiting states from conducting eligibility redeterminations during the COVID-19 public health emergency. This restriction was lifted in early 2023, triggering a large-scale unwinding effort across the country.
31↑ CMS, "Scheduled State Timelines for Completing Unwinding-Related Renewals."
32↑ HHS OIG, California Made Medicaid Payments.
33↑ HHS OIG, Colorado Did Not Correctly Determine Medicaid Eligibility.
34↑ HHS OIG, Prior Audits of Medicaid Eligibility Determinations in Four States Identified Millions of Beneficiaries Who Did Not or May Not Have Met Eligibility Requirements, 2022, https://oig.hhs.gov/reports/all/2022/prior-audits-of-medicaid-eligibility-determinations-in-four-states-identified-millions-of-beneficiaries-who-did-not-or-may-not-have-met-eligibility-requirements/
35↑ Benjamin Hopkins et al., "How Did Take-Up of Marketplace Plans Vary with Price, Income, and Gender?," American Journal of Health Economics 11, no. 1 (2025): 63?90.
36↑ Brian Blase and Drew Gonshorowski, "The Great Obamacare Enrollment Fraud," Paragon Health Institute, June 2024, https://paragoninstitute.org/private-health/the-great-obamacare-enrollment-fraud/
37↑ The 2025 Paragon study measuring improper enrollment in 2019 accounted for misclassifications but ignored possible interactions with the ACA exchanges. To facilitate apples-to-apples comparisons between 2019 and 2024 and accommodate a broader range of possibilities, Appendix C shows fiscal impact estimates for 2019 and 2024 under the consistent assumption that no ineligible Medicaid expansion enrollees would be enrolled in the ACA exchanges if they did not have Medicaid coverage. The results indicate that federal Medicaid costs tied to improper enrollment grew from $23.8 billion in 2019 to $54.3 billion in 2024, while aggregate state savings grew from $4.2 billion in 2019 to $6.8 billion in 2024.
38↑ In 2024, the District of Columbia extended Medicaid coverage to expansion adults up to 215 percent FPL. Therefore, I use 220 percent FPL as the income level for estimating federal subsidies in the ACA exchanges.
39↑ I select 175 percent FPL for the representative enrollee because individuals at this income level generally did not have access to zero-premium plans in 2024, creating an incentive to enroll in Medicaid to receive premium-free coverage. Moreover, individuals closer to the 138 percent FPL Medicaid eligibility threshold are more likely to successfully improperly enroll in Medicaid; as a result, it is less plausible that individuals higher up the income scale improperly enrolled in Medicaid in large numbers. I obtain estimated subsidy amounts from the Kaiser Family Foundation (KFF) 2024 Health Insurance Marketplace Calculator. Across all states, the average annual subsidy amount is about $6,268.
40↑ In 2019, the federal matching rate for the expansion group was 93 percent. The rate decreased to 90 percent in 2020 and, under current law, will remain at that level indefinitely. Therefore, I use a 90 percent rate for 2024 estimates.
41↑ Because I have little insight into the composition of the misclassified group, I use the per-enrollee cost across all eligibility categories, including children, parents, the elderly, and people with disabilities.
Author

Acknowledgements
The author is grateful to Brian Blase, Hayden Dublois, John R. Graham, Mark Howell, Matt Robinson, Anthony Wojtkowiak, Aaron Yelowitz, and the Paragon team for their exceptional comments and work in review of the paper.