
Reforming Government. Empowering Patients.
Navigation
Medicaid Financing Reform
Stopping Discrimination Against the Most Vulnerable and Reducing Bias Favoring Wealthy States


The Paper
Executive Summary
What’s the Problem?
No major government program has grown as much over the past generation—and with such poor results—as Medicaid. The reason for the substantial growth: the federal government provides an open-ended reimbursement of state Medicaid expenditures. Despite the intent of the federal financing formula—the federal medical assistance percentage (FMAP)—to provide greater federal support in poorer states, richer states have developed more profligate Medicaid programs and thus receive far more federal funding per person in poverty than poorer states. Part of the problem is that the FMAP formula has an arbitrary floor on the federal reimbursement for the wealthiest states. Medicaid’s financing structure leads states to spend more on Medicaid relative to other areas like education, infrastructure, and policing and leads states to develop financing schemes and gimmicks in order to obtain as much federal money as possible.
The Affordable Care Act (ACA) significantly expanded Medicaid over the past decade, worsening the program’s structural problems. The ACA created a new eligibility category for Medicaid—able-bodied, working-age adults—with a much higher federal reimbursement percentage for these enrollees. This has led to a host of problems, including: 1) a diversion of resources away from traditional Medicaid enrollees, particularly low-income children and people with disabilities, that has reduced their access to health care services; 2) a near quadrupling of Medicaid’s improper payments; and 3) a surge of spending that has significantly contributed to large and growing federal deficits.
How Do We Propose to Fix the Problem?
Most importantly, our proposal would end the discrimination against low-income children, pregnant women, seniors, and people with disabilities by equalizing the percentage that the federal government reimburses state Medicaid expenditures for them and for ACA expansion enrollees. Starting in 2026, our proposal would begin phasing down the 90 percent FMAP for expansion enrollees until it would reach parity in 2034 with each state’s FMAP for traditional enrollees. We permit states to keep Medicaid expansion and reduce eligibility to only households below the poverty level, while households earning above the poverty level would be eligible for tax credits for ACA exchange plans. This policy would better protect services for traditional enrollees, better align state incentives to get value from expenditures and eliminate their incentive to enroll as many people under the expansion as possible, and significantly increase enrollment in the exchanges relative to Medicaid.
We include a second proposal that would add an important reform to the phasedown of the ACA expansion FMAP. The second proposal reduces the FMAP floor that benefits wealthy states from 50 percent to 40 percent. The only jurisdiction affected by the 40 percent floor would be the District of Columbia, the U.S. jurisdiction with the highest per capita income. States with the highest per capita incomes, such as California, Connecticut, Massachusetts, and New York, would have FMAPs between 45 and 50 percent, based on their state per capita income. This policy would create greater equity in the federal support across the country—reducing the gap in federal funding per person in poverty—although wealthy states would still receive more federal funding per person in poverty after our proposal takes full effect. The phasedown of the standard FMAP would also start in 2026 and be complete in 2034.
What Would Result?
We estimate state baselines of Medicaid expenditures and show the impact of our proposals relative to that baseline for each state. We also pegged our federal estimates of savings to how the Congressional Budget Office (CBO) would likely score the proposal, which included feedback we received from CBO.
Effect on States
- We expect and we model states lowering Medicaid expansion eligibility from 138 percent of the federal poverty level (FPL) to the FPL in both proposals.
- We estimate the total costs to states from proposal #1 would be $110.1 billion between 2026 and 2034, which includes costs from the reduction in the 90 percent FMAP for Medicaid expansion enrollees with income below the FPL, somewhat offset by savings to states from not having to pay the 10 percent share for enrollees with income above the FPL. For these estimates, we assume all states maintain the expansion up to 100 percent FPL. If states drop Medicaid eligibility, they would accrue additional savings. Moreover, we do not assume states take steps to run more efficient programs when the enhanced FMAP phases down even though they would have a strong incentive to become more efficient.
- We estimate the total costs to states would be $171.5 billion from proposal #2, with the added costs absorbed by wealthy states and the District of Columbia picking up a greater share of the costs for traditional enrollees with the lowering of the FMAP floor.
Effect on the Federal Government
- Assuming all states maintain their expansion and all individuals in households with income between 100 and 138 percent FPL maintain coverage with the switch from Medicaid to the subsidized exchanges (in essence no behavioral changes from our proposals), we estimate that the federal government would save $251.7 billion from proposal #1 and $314.2 billion from proposal #2.
- There would be three sources of federal savings. First, we estimate $40.3 billion in savings because current non-expansion states would not expand their programs under our proposals, and CBO assumes some degree of non-expansion states expanding in the baseline. Second, we estimate $171.5 billion in savings from the phasedown of the 90 percent expansion FMAP for people with income below the FPL and for proposal #2, we estimate an additional $57.1 billion in savings from reducing the FMAP floor for traditional enrollees. Third, the federal government accrues about $45.3 billion in savings because, on average, federal spending per Medicaid expansion enrollee exceeds the premium tax credit for the lowest-income exchange enrollees and we estimate around 4.5 million enrollees switch from Medicaid to the exchanges.
- We also account for two behavioral assumptions that CBO would assume in its projections: 1) states dropping Medicaid expansion when the 90 percent expansion FMAP declines and 2) some people losing Medicaid and not enrolling in a subsidized exchange plan. Based on conversations with CBO and other experts, we estimate that about a quarter of people living in current expansion states would live in a state that pulls back its expansion and that about one-in-five expansion enrollees with income between 100 and 138 percent FPL will not enroll in a subsidized exchange plan. We estimate that the respective federal savings from these two factors would be: $185.6 billion and $92.6 billion.
- Thus, we expect CBO would estimate that proposal #1 would save $529.9 billion from 2026-2034 and proposal #2 would save $592.4 billion over this period.
Introduction
Fundamental Medicaid reform that focuses states on maximizing value for those who truly need public assistance—and not just on maximizing the receipt of federal dollars—is long overdue. Reform should also address the moral issue that the current financing structure discriminates against the more vulnerable Medicaid enrollees in favor of the able-bodied, working-age, generally childless adults or Affordable Care Act (ACA) expansion enrollees. Research shows that health care resources are being diverted away from traditional enrollees and to expansion enrollees in expansion states, with Medicaid enrollees having more difficulty accessing medical appointments after expansion. The federal government should not pay a higher percentage of the expenses for the expansion enrollees than it does for children, pregnant women, seniors, and people with disabilities on the program. Reform should also more fairly distribute federal resources across states, as the current structure provides much greater support for richer states that have larger Medicaid programs.
In this paper, we propose a significant reform that ends the immoral inequity, more fairly distributes federal resources across the country, and improves states’ incentives to get value from the hundreds of billions of dollars they spend on Medicaid each year. As policymakers look for ways to make the federal budget more sustainable, our proposals would reduce federal deficits by more than $500 billion over the next decade. We also discuss key considerations for a more fundamental change to Medicaid financing reform that would largely distribute funds based on the number of people in poverty in each state, replacing the open-ended matching grant structure of Medicaid with fixed allotments to states.
Medicaid’s Basic Formula Is Irredeemably Flawed
Medicaid was created in 1965 to pay medical expenses and nursing home care for certain categories of low-income Americans, including children, individuals with disabilities, and seniors. The federal government sets rules around eligibility and benefits, and states have some ability to shape their programs to their preferences, generally by waiving certain federal requirements but still receiving federal matching funds. The key financing aspect of Medicaid is that the federal government provides an open-ended reimbursement of state expenditures. So when a state spends more on Medicaid, the federal government sends more money to the state. So long as the state covers its share of Medicaid costs, there is no limit to what the federal government will contribute.
For traditional enrollees, the federal reimbursement is largely a function of state per capita income. The federal reimbursement is referred to as the Federal Medical Assistance Percentage (FMAP). States with higher per capita income have lower FMAPs than do states with lower per capita income. The federal government sets an FMAP floor of 50 percent—which is important, because the formula would result in 10 states (as well as the District of Columbia) having FMAPs below 50 percent if not for the floor.1 During many economic recessions, such as the ones following the 2008 financial crisis and during the COVID-19 public health emergency, the federal government raised state FMAPs to deliver additional financial support to states.
Medicaid’s key structural problem is that states are making fiscal decisions with money that mostly comes from an external tax base—that is, out-of-state taxpayers. This financing design reduces states’ incentives to operate the program prudently. Blase elaborates on these problems in a 2016 Mercatus paper:2
This financing structure produces substantial spending and lessens the incentive of both the states and the federal government to ensure that the spending provides adequate value. That such a financing arrangement would produce this outcome should not be surprising, particularly to economists. In separate articles, James Buchanan and Barry Weingast, Kenneth Shepsle, and Christopher Johnson have demonstrated that when the costs of government expenditures are externalized to individuals outside a jurisdiction, the jurisdiction tends to consume public resources beyond the socially optimal amount. Wallace Oates observed that intergovernmental grants cause voters to demand an excessive amount of spending, because they create the appearance that local public expenditures are funded by nonresidents. Using a panel dataset of Organisation for Economic Co-operation and Development countries, Jonathan Rodden finds that decentralization funded by common-pool resources is directly related to growth in government.
The financing design makes Medicaid relatively cheaper for states compared to other main areas of state spending, including education, transportation, policing, and infrastructure. For example, $1 spent on policing gets the state $1 in police services. But, $1 spent on Medicaid gets the typical state $3 worth of Medicaid services, as the typical state bears only one-third of the average cost of its Medicaid program. The result of this structure is that Medicaid spending is relatively large compared to other state government priorities.
The open-ended reimbursement structure also leads states to develop financing schemes with the goal of obtaining federal money without having to put up any real contributions of their own. These financing schemes typically involve the following components: (1) funds go from providers to the states, 2) states use those funds to finance Medicaid services at those providers, (3) states claim federal reimbursement from those expenditures, and (4) states increase expenditures at those providers and have additional federal funds for Medicaid or non-Medicaid purposes. This feature further increases excessive and inappropriate spending. All states engage in such gimmicks, which the federal government allows within certain bounds. The schemes have existed for more than three decades,3 and their magnitude has been increasing. The lack of transparency and accountability in Medicaid alarms many scholars, and as Blase wrote in the Mercatus paper, “Medicaid is not true federalism.”4
Michael Greve coined the term cartel federalism to refer to Medicaid’s design in which states compete for federal subsidies to carry out Washington’s agenda. According to Greve, cartel federalism “promotes the growth of government at all levels, creates impenetrable intergovernmental bureaucracies and a torrent of transfer payments, and destroys political accountability.”5
The Affordable Care Act Worsened Medicaid Financing
The main coverage component of the ACA was a massive expansion of Medicaid to include non-disabled, working-age adults with income below 138 percent of the federal poverty level (FPL), or about $20,783 for a single-person household in 2024.6 In 2012, the U.S. Supreme Court ruled that the Medicaid expansion was optional for states. In 2014, the first year of the expansion, half of the states adopted it. Only 10 states have not adopted the expansion as of the end of 2023.7
Congress created a much higher FMAP for the expansion population. The expansion population FMAP was 100 percent from 2014 to 2016. It declined from 2017 through 2020, when it reached 90 percent—a level at which it is scheduled to remain indefinitely. In the 2016 Mercatus paper, Blase explained the problems with the enhanced FMAP:8
Only two [jurisdictions] (Massachusetts and [the District of Columbia]) had concluded that the tradeoffs—higher state taxes and reduced spending elsewhere—justified expanding Medicaid to the ACA expansion population before 2010.9 The elevated reimbursement rate for the expansion population worsens Medicaid’s key structural problem, and results in little, if any, incentive for states to be cost conscious for the expansion population.
The elevated match rate presents states with incentives to (1) boost ACA Medicaid enrollment and to categorize Medicaid enrollees as ACA expansion enrollees and (2) create high fees for services commonly used by expansion enrollees as well as high capitated payment rates for the insurers participating in the state’s Medicaid managed care program. The health care interest groups within the states, particularly hospitals and insurers, benefit from the higher enrollment and the higher rates with the large costs overwhelmingly dispersed to federal taxpayers.
Although beyond the scope of this paper, Medicaid’s health outcomes are generally disappointing.10 Most Medicaid recipients value the program at less than half the government’s cost.11 When considering the overall effect of Medicaid expansion and the resulting reallocation of health care services, health outcomes may have worsened.12 For example, from 2013 to 2017—the first four years of the ACA’s Medicaid expansion—life expectancy worsened in expansion states relative to non-expansion states.13 New Mercatus Center work demonstrates a shift of resources from traditional Medicaid enrollees to expansion enrollees in expansion states.14 A meta-analysis in Inquiry finds that Medicaid enrollees have more difficulty securing primary and specialty care appointments in states after they expand.15 A Mercatus working paper found that the expansion of Medicaid caused a 10.9 percent increase in depression scores among original program recipients, with particularly negative results among women and people with disabilities.16 The authors recommend that policymakers consider potential negative spillover effects when expanding Medicaid.
The ACA’s Medicaid expansion, which increased demand for health care services, produced a reallocation of services toward people who gained Medicaid under the expansion. A large part of that reallocation came from individuals who were previously enrolled in Medicaid. Therefore, traditional Medicaid enrollees received fewer health care services because of the expansion of the program to able-bodied, working-age adults. By paying states a much higher share of the expansion population’s spending, federal policy encouraged spending on expansion enrollees at the expense of traditional Medicaid enrollees.
The Centers for Medicare and Medicaid Services (CMS) produces annual Medicaid actuarial reports from the Office of the Actuary (OACT) that provide evidence of this reallocation. Figure 1 shows the percentage of difference between actual per capita federal Medicaid spending in 2014 to 2018 with OACT’s 2013 projections across eligibility groups. (OACT’s 2018 report is the last one that CMS has publicly released.) OACT severely underestimated Medicaid spending on expansion enrollees and severely overestimated spending on the aged and disabled Medicaid enrollees. Per capita federal spending on expansion enrollees in 2018 exceeded OACT’s 2013 projections by 56.0 percent, while per capita federal spending on aged and disabled Medicaid enrollees was lower by 25.4 percent and 11.3 percent, respectively. Per capita spending on children was somewhat higher than OACT projected, and spending on non-disabled adults who were eligible for Medicaid prior to the expansion was somewhat lower.

The numbers from OACT include spending in both expansion states and non-expansion states, which blurs the picture, as the reallocation of health care services away from traditional enrollees and toward expansion enrollees would not occur in non-expansion states. In December 2022, the Mercatus Center released a study that separated out expansion states and non-expansion states and assessed spending trends across eligibility categories.17 Mercatus found strong evidence that resources were diverted away from traditional enrollees to expansion enrollees.

As demonstrated by Figure 2, Medicaid spending on children increased much more in non-expansion states relative to expansion states between fiscal years 2013 and 2019. According to the Mercatus study summary:18
- There is strong evidence of a shift of financial resources away from certain vulnerable enrollee populations, the most notable being low-income children. Per capita Medicaid spending growth on children in expansion states was less than one-third what it was in non-expansion states and less than one-quarter of national average per-capita health care spending growth.
- Growth rates in Medicaid spending per capita on the aged were considerably lower in expansion states than in non-expansion states, and enrollment of the disabled in Medicaid also declined. (Of note, the enrollment decline of people with disabilities in Medicaid expansion states suggests that states classified disabled enrollees as expansion enrollees to secure the higher FMAP.) Trends in these areas were less definitive than the sharp divergence with respect to spending on children.
- Per capita Medicaid spending growth on nonaged, nondisabled adults—the focus of the ACA’s Medicaid expansion—was higher in expansion states than in non-expansion states.
Several recent studies provide evidence of reduced health care access for Medicaid enrollees in expansion states. Miller and Wherry found that Medicaid recipients in expansion states significantly delayed medical care because no appointment was available or because wait times were too long.19 Courtemanche and coauthors found that Medicaid expansion was related to a significant increase in the amount of time it took for ambulances to respond.20 And a meta-analysis in Inquiry found that Medicaid patients were half as likely as someone with private insurance to get an appointment prior to expansion but only one-third as likely as someone with private insurance to get an appointment after expansion—suggesting that expansion reduced access for Medicaid enrollees by one-third.21
Surge of Medicaid Enrollment, Much of It Improper
States that expanded Medicaid experienced much greater enrollment than they expected. As Blase and Yelowitz wrote in a November 2019 Mercatus report:22
In December 2016, the Foundation for Government Accountability released a study comparing the high-end enrollment projections of the 24 states that expanded with actual enrollment figures. Overall, these states enrolled more than twice as many people as projected, and every single state had enrollment in excess of its high-end projection. By May 2016, California’s enrollment of 3.8 million people in the Medicaid expansion was particularly excessive—more than four times as many people as projected.
In a study released last year, Blase and Gonshorowski contrasted Medicaid expansion enrollment projections made by the Urban Institute in November 2012 (which were above the state estimates that the Foundation for Government Accountability analyzed) with actual enrollment from February 2020, the last month before the pandemic (to avoid conflating Medicaid expansion’s effect with the increase in enrollment from the pandemic and policy changes following it).23 Overall, states enrolled 52 percent more people in Medicaid expansion than they expected.
Part of the reason why enrollment was so much greater than expected was that many new Medicaid enrollees did not have their eligibility properly reviewed. The 100 percent FMAP for the expansion population in 2014-2016 resulted in states classifying people who were previously eligible for Medicaid (and thus where the state was entitled only to the lower, standard FMAP) as expansion enrollees and classifying people who were ineligible for the program entirely as Medicaid enrollees. Seven audits by the Department of Health and Human Services (HHS) Office of the Inspector General in 2014 and 2015 found staggering errors.24 For example, one audit found that 65 of 125 sampled Medicaid enrollees in California were not eligible or were potentially ineligible—that is, the state did not do proper eligibility determinations prior to enrollment.25 Routine errors included failing to obtain proper documentation, failing to properly verify income, and failing to verify citizenship.
Under the Obama administration, CMS cancelled Medicaid eligibility audits from 2014 to 2017, essentially removing any possible financial penalties states could face for failing to ensure accurate Medicaid rolls. When the audits restarted, CMS found an alarming problem.26 Improper Medicaid spending soared—from 8 percent up to 15 percent of federal spending—even though only a third of states were fully audited that year.27 Blase and Yelowitz used self-reported data and found that millions of people in expansion states who likely earned income well above 138 percent FPL (the income threshold for eligibility under the ACA) reported Medicaid enrollment.28
According to CMS, the surge in improper payments was “driven by high levels of observed eligibility errors.”29
Some of the most consistent findings included states maintaining insufficient documentation to substantiate that income and other information was appropriately verified, failures to conduct timely and appropriate annual redeterminations, and claiming beneficiaries under incorrect eligibility categories that provide a higher federal matching rate than was appropriate. Eligibility errors of this nature are particularly concerning as [they] can indicate that individuals are allowed to remain enrolled in the program during times in which they do not qualify, potentially diverting limited resources that could otherwise be invested in better serving vulnerable populations.30
Surge of Medicaid Spending, Much of It Improper
Medicaid expansion resulted in substantial improper payments. In 2013, the Medicaid improper payment rate was 5.8 percent.31 By 2021, the rate rose to 21.7 percent—nearly quadrupling the pre-ACA percentage.32 In dollars, annual federal improper payments increased from an estimated $14.4 billion to $98.7 billion over this period. Figure 3 shows the growth in Medicaid improper payments and improper spending with Medicaid expansion. Of note, because CMS cancelled eligibility audits from 2014 to 2017, the reported levels of improper payments from those years were well below actual levels given the magnitude of errant and improper eligibility determinations. Although eligibility reviews restarted in 2018, they were for only one-third of states. The eligibility reviews in those one-third of states is the reason for the substantial increase in improper payments. The improper payment rate continued to increase the following year as another one-third of states had meaningful audits. We stopped the figure in 2021 because Medicaid’s reported improper payment rate, beginning in 2022, is artificially low as CMS granted flexibilities around COVID and stopped doing meaningful audits.

As explained above, the perverse incentives from the ACA Medicaid expansion resulted in millions of ineligible people enrolling in Medicaid or people being put on the program without proper eligibility reviews. According to a fact sheet based on the November 2019 CMS improper payment report:
Medicaid and CHIP eligibility improper payments are mostly due to insufficient documentation to verify eligibility, related primarily to income or resource verification for both situations where the required verification was not done at all and where there is indication the verification was initiated but there was no documentation to validate the verification process was completed, and non-compliance with eligibility redetermination requirements.33
Inequity in Federal Funding for Low-Income People’s Health Care
Another feature of Medicaid financing is that wealthier states receive greater federal support for their programs than poorer states—despite the FMAP formula, which provides a higher federal reimbursement percentage in poorer states.34

The FMAP formula design was intended to help equalize the fiscal capacities of states to finance health care and long-term care services and supports for lower-income populations. The theory was that, because states with less wealthy residents have a lower tax base from which to fund their programs, the federal government would provide greater fiscal support in those states. So while $1 of state spending with state resources in the wealthiest states generates $1 of federal aid (corresponding to a 50 percent FMAP), $1 of state spending with state resources in the poorest states generates roughly $3 of federal aid (corresponding to a 75 percent FMAP).35
Importantly, federal law requires that only 40 percent of the nonfederal share derives from state general revenue. Much, if not most, of states’ nonfederal share derives from financing arrangements where the money is transferred to the state by a health care entity (e.g., hospitals) for the purpose of obtaining federal Medicaid funds. Once the state receives the federal funds, it then returns those transferred amounts, and often much more, to the entity in higher Medicaid payments. As such, the actual state share of Medicaid spending is well below the percentage from the FMAP formula.36
Sigaud argues that the current FMAP structure is a poor way to distribute federal Medicaid funding to states because average income “is only loosely related to the health needs or size of its low-income population and its ability to fund its own social assistance programs.”37 He provides examples of the problem. Nevada and Maine have similar average per capita incomes, yet Nevada’s poverty rate is 25 percent higher, and its proportion of adults in the poorest health category is 13 percent higher.38 Florida and Wisconsin have similar FMAPs,39 yet Florida has a significantly higher poverty rate and percentage of adults in the poorest health.
The 50 percent FMAP floor benefits wealthier states and further weakens the correlation between a state’s economic situation and how much federal funding it receives for its Medicaid program. Figure 4 shows the states that benefit from the 50 percent floor and what their state FMAPs would be in the absence of the floor.

Table 1 shows federal Medicaid spending per person in poverty, the poverty rate, per capita income, and FMAP by state. This data is from 2019, which avoids confounding the results with the growth of Medicaid and economic turmoil associated with the COVID-19 pandemic and the declared public health emergency, which essentially prohibited states from doing Medicaid disenrollments during this period. Federal Medicaid spending per person in poverty has the most variation of any of the categories. Five states received less than $6,000 in federal Medicaid funding per person in poverty, while six states plus the District of Columbia received more than $14,000 in federal Medicaid funding per person in poverty.

Figure 5 plots federal Medicaid spending per person in poverty with state per capita income. Despite the intent of the FMAP formula, federal Medicaid spending per person in poverty is positively correlated (r=0.51) with state per capita income. The positive correlation grows even stronger (r=0.56) when weighting by the number of people in poverty in each state. The reality is that, whether due to economic or political reasons, wealthier states have grown much larger Medicaid programs—with higher eligibility levels and more expansive benefits—and receive far more federal funding per person in poverty than poorer states receive.

Figure 6 is similar to Figure 5 but excludes spending on ACA Medicaid expansion enrollees. The result remains quite robust with a strong positive correlation (r=0.44; r=0.42 when weighting by the number of people in poverty in each state). It turns out that federal funding for Medicaid currently benefits richer states that have grown more profligate Medicaid programs. This result, by itself, suggests that fundamental reform is needed to the FMAP formula.

Medicaid Financing Reform Proposals
To end the discrimination against low-income children, pregnant women, seniors, and individuals with disabilities and reduce the incentives for wasteful spending, Congress should equalize the enhanced expansion FMAP with the regular FMAP for traditional Medicaid enrollees. Medicaid reform should also address the problem that wealthier states receive far more federal Medicaid funding per person in poverty than poorer states do and should more equitably allocate federal funds across the country.
The increasingly dire federal budget situation is a crucial backdrop for the urgency of reform. Budget deficits of this magnitude during peacetime and economic expansion are deeply problematic. The deficits are pushing up both inflation and interest rates, harming American families and the nation’s future prosperity.
The specific guidelines underpinning Medicaid financing reform should be to:
- reduce the ACA Medicaid expansion FMAP so that it equals each state’s standard FMAP,
- reduce the disparity in federal Medicaid funding that benefits wealthier states over poorer states,
- reduce the federal deficit,
- reduce states’ incentives to use financing gimmicks to pass inappropriate costs to the federal government,
- create better overall incentives for states to obtain value from Medicaid expenditures, and
- create a transition period for states to move to a more sensible and fair financing structure without major disruptions to state budget planning.
Achieve FMAP Parity by Phasing Out the Enhanced FMAP
The enhanced FMAP for the ACA Medicaid expansion population—currently set at 90 percent—should be reduced to each state’s standard FMAP. As the federal reimbursement rate declines for the expansion population, states would have a strong incentive to reduce Medicaid’s upper level of income eligibility for able-bodied adults from 138 percent FPL to 100 percent FPL. Doing so would significantly reduce states’ costs. Enrollees with income above 100 percent FPL who lose Medicaid would be eligible for large, fully federally funded premium tax credits (PTCs) to purchase insurance plans through the ACA exchanges. As a result of the cost-sharing reduction program, these individuals would be eligible for 94 percent actuarial value plans if they purchase silver plans. A 94 percent actuarial value plan would have a low deductible and low copayments, making such coverage comparable to Medicaid.
Reducing the 50 Percent FMAP Floor and Increasing Equity in Federal Funding
The higher Medicaid reimbursement percentage in wealthier states was designed to equalize fiscal capacity across states, but as demonstrated earlier, the funding formula has not worked out that way. Wealthier states receive far more federal Medicaid financing per person in poverty than poorer states do. It is time to base the distribution of federal funds on a more accurate measure of state needs and fiscal capacities and not to reward wealthy states with more expansive Medicaid programs. Part of the reason for this inequity is the artificial 50 percent FMAP floor that helps wealthy states. While our first proposal leaves this floor in place, our second proposal reduces the FMAP floor in the wealthiest states. The jurisdiction with the highest per capita income is the District of Columbia, and the second proposal reduces its FMAP to 40 percent. We also reduce the FMAPs in the 10 other wealthiest states in a proportionate manner, but none would have an FMAP below 45 percent.
FMAP Reforms
We next outline our two proposed reforms. The proposals are accompanied by tables showing the fiscal impacts for states and the federal government. To illustrate the impacts by state, we first estimated a state Medicaid spending baseline (see Appendix A for methodological details). The state baseline in Appendix A shows the estimated federal Medicaid funding received by state per year from 2026 to 2034. We use this baseline to assess the effects of different reform options.
Proposal #1: Achieving Parity Between the Expansion FMAP and the Traditional FMAP
The reduction from the 90 percent reimbursement rate to the state’s normal FMAP occurs gradually over this period, beginning in 2026 with the equalization of the expansion FMAP and the normal FMAP occurring in 2034. We assume that states react to the reduction in the expansion FMAP by dropping eligibility for the expansion population to 100 percent FPL as people with income above that level would qualify for a large tax credit to purchase an exchange plan with 94 percent actuarial value. Under our proposal, traditional FMAPs would continue to fluctuate based on how state per capita income varies with national per capita income, but we assume that each state’s traditional FMAP in the future equals its 2025 FMAP for modeling purposes.
State Effects
For enrollees with income above 100 percent FPL, the federal government now finances the cost of their health coverage through the PTCs. So, states would save the 10 percent state share of total Medicaid spending for these enrollees under this proposal as these enrollees would replace Medicaid with a PTC to buy an exchange plan.40
For enrollees with income below 100 percent FPL, there is a gradual cost shift from the federal government to states as the expansion FMAP moves from 90 percent to each state’s normal FMAP. The estimates in Table 2 show the effects by state—assuming that 40 percent of expansion enrollees have income above 100 percent FPL and 60 percent of expansion enrollees have income below 100 percent FPL.41 To show the sensitivity of our results, Appendix B contains a corresponding table that shows the state effects for a range of 30-50 percent of expansion enrollees with income above 100 percent FPL.

In the aggregate, assuming that 40 percent of expansion enrollees have income above 100 percent FPL, the state costs of proposal #1 are roughly $110.1 billion—with $166.2 billion in costs from the decline in the expansion FMAP for enrollees below 100 percent FPL and $56.0 billion in savings from switching enrollees with income above 100 percent FPL to the exchanges. (We report these numbers as nominal dollars, as consistent with Congressional Budget Office [CBO] projections.)
Table 2 shows savings (or negative costs) for all states in 2026 and for some states—those with below-average per capita incomes and higher FMAPs—in 2027 and 2028, because in the first few years under proposal #1 there are greater savings from removing the state share for expansion enrollees above 100 percent FPL than state costs from the FMAP phasedown below 100 percent FPL. Because states would likely try to become more efficient with lower FMAPs, these estimates are higher than the actual costs states would incur from the phasedown of the 90 percent FMAP.
The estimates in Table 2 show the costs to states of maintaining Medicaid expansion eligibility at 100 percent FPL. In other words, they show the cost implications to states if no one loses coverage, with enrollees between 100 and 138 percent FPL shifting from Medicaid to the exchanges with PTCs. If states reduce Medicaid eligibility for the expansion population of able-bodied, working-age adults (which we discuss in more depth in a later section on how we expect CBO to estimate this proposal), there would be additional state and federal savings as well as an increase in the number of people without coverage.
The states most affected by this proposal are the expansion states with the highest per capita income, because the FMAP for this group of enrollees would decline from 90 percent to 50 percent over the nine-year period. The expansion states that would be affected the least are West Virginia, New Mexico, Kentucky, Arkansas, and Louisiana—the ones with the lowest per capita income and the highest standard FMAPs. As such, this proposal would advance equity in overall federal Medicaid financing in addition to equalizing the FMAPs across populations.
Federal Effects
We estimate that the federal savings from this proposal, assuming every Medicaid expansion state maintains the expansion at the reduced FMAP, would total $251.7 billion over the 2026-2034 period. There would be three components of federal savings, as scored by CBO. First, we assume that no current non-expansion states would adopt expansion if our proposal is enacted. We estimate this savings amount at $40.3 billion. This amount starts with $62.5 billion in Medicaid savings—our estimate of what CBO expects the cost of expansion to be in current non-expansion states over the budget window.42 These costs include future enrollees with income both above and below 100 percent FPL. It is important to account for the switch of people with PTCs in the exchanges in non-expansion states that would adopt expansion as CBO’s baseline lowers PTC expenditures to account for non-expansion states that it expects adopt Medicaid expansion over the budget window. Because we estimate that about 40 percent of expansion enrollees are above 100 percent FPL, we reduce the Medicaid savings by approximately 40 percent.43
Second, the federal government accrues savings as the 90 percent FMAP phases down to the state’s normal FMAP over the budget window. These savings are mirror images of the costs to states, so they equal $166.2 billion over the period.
Finally, the federal government saves money on the enrollees with income above 100 percent FPL who are shifted to the exchanges with PTCs, because the federal share of Medicaid expenditures generally exceeds the PTCs for people who would shift from Medicaid to the exchanges. We estimate this final category of savings at $45.3 billion over the 2026-2034 period.44
Table 3 shows the combined fiscal effect for states and the federal government from proposal #1, assuming no net coverage change from the financing reforms. This table assumes no change in insured status and that no states that have expanded Medicaid reduce eligibility for the expansion after the proposal takes effect.

Medicaid versus an Exchange Plan for Low-Income Enrollees
The ACA made subsidies available to people residing in households with income above 100 percent FPL unless they had access to government coverage (e.g., Medicaid) or affordable plans offered by their employers. In Medicaid expansion states, Medicaid eligibility was up to 138 percent FPL, so people with income between 100 percent and 138 percent FPL are entitled to enroll in Medicaid, while subsidized exchange plans were available to people in households with income above 138 percent FPL. In non-Medicaid expansion states, households with income between 100 percent and 138 percent FPL are entitled to subsidies to purchase exchange coverage.
For households that report income between 100 percent FPL in non-Medicaid expansion states (138 percent FPL in expansion states) and 150 percent FPL, the subsidies significantly reduce both plan premiums and cost-sharing amounts. For people below 150 percent FPL who select silver plans, insurers are required to raise the actuarial value of the plans to 94 percent.45 These plans have de minimis deductibles, copayments, and out-of-pocket limits. Moreover, as a result of an expansion of the subsidies—which increased the PTC to cover 100 percent of the benchmark plan premium from 2021 through 2025—the premiums paid by enrollees for these plans are now $0. The Biden administration also issued accommodating rules that make it easier for low-income enrollees to obtain PTCs, including an unlimited open enrollment period for individuals who report income below 150 percent FPL so that enrollees can sign up any time during the year.
Exchange plans are typically like Medicaid managed care plans. In many states, the same insurers that offer Medicaid plans also sell exchange plans and the plans have similar, if not identical, provider networks.
Importantly, although these income cutoffs appear precise, they are based on estimated household income. Some people eligible for Medicaid are enrolled in exchanges with subsidies and vice versa. Moreover, people have an incentive to misreport their income so that they maximize their federal health insurance subsidies. In non-Medicaid expansion states, people have a significant incentive to estimate their income at above 100 percent FPL in order to qualify for PTCs—a phenomena that is widespread.46 If people have income above 200 percent FPL and underestimate their income to qualify for a higher advanced PTC, the repayment when they file their taxes and reconcile their actual income with estimated income is capped at an amount lower than the advanced subsidies they would have received.47 They would have also received lower plan deductibles and cost-sharing from enrolling as 100-150 percent FPL enrollees. States also have an incentive for this classification, because they prefer more people with health insurance, particularly if the federal government is picking up all or the vast majority of the expense.48
While the incentives to misstate income for exchange plans are significant and the effects are profound, they are much more significant in states that have not adopted the ACA’s Medicaid expansion. This means they are not particularly relevant for this analysis, which focuses on the effect of reducing the 90 percent expansion FMAP. Moreover, the incentive to misstate income will be significantly smaller once the enhanced PTCs expire after 2025, which we assume and which CBO will assume in its score of these proposals given that they expire in the baseline.
How CBO Would Score Proposal #1
The projections above have been carefully calibrated to approximate how CBO would estimate proposal #1 with two exceptions. Table 4 shows how we expect CBO would model proposal #1.

We earlier showed the state costs under the assumption that states maintain Medicaid expansion for people with income below 100 percent FPL. Based on conversations with experts, including those at CBO, we estimate that CBO would assume that about three-quarters of expansion enrollees in households below 100 percent FPL reside in states that would maintain those expansions for people below 100 percent FPL even as the federal share of those expenses declines from 90 percent to the normal state FMAP over that period. Both the states and the federal government would experience savings if states end Medicaid expansion for enrollees with income below 100 percent FPL.
To estimate the federal savings, we eliminate one-quarter of the state costs of maintaining expansion after proposal #1 takes effect—$62.5 billion from 2026 to 2034.49 We assume that states make this change right away. (If states were to withdraw expansion more slowly, then the cost savings would be smaller.) We estimate that the federal share corresponding to those state costs would be $185.6 billion over this period.50 Of note, we did not estimate savings to any states from taking this action, but they would be large, particularly in states with relatively low FMAPs.
In addition to that effect, there would also likely be some loss of overall insurance coverage from moving people with income between 100 percent and 138 percent FPL from Medicaid expansion to the exchanges. In the aggregate, we assume that 40 percent of all current Medicaid expansion enrollees have income above 100 percent FPL and would move from Medicaid to the exchanges. If the enhanced PTCs are extended, loss of overall coverage would likely be negligible, as people would have access to fully taxpayer-subsidized insurance with a 94 percent actuarial value. If, however, the PTC structure is restored to the pre-2021 structure—as would be part of our preferred approach to reform federal health programs and promote a health sector with less waste and fraud—we estimate that about one in five Medicaid expansion enrollees with income above 100 percent FPL (or about 1.1 million people in 2030) would not transition from Medicaid to the exchanges. We estimate that the total federal savings over the nine-year period from this effect would be around $92.6 billion.51
To summarize, in addition to the discussion in proposal #1 of the state and federal effects, further savings accrue from the behavior of states and individuals in response to the policy change. We estimate that one-quarter of Medicaid expansion enrollees reside in states that would not maintain expansion up to 100 percent FPL and would instead revert to their previous eligibility levels. We also estimate that about one in five Medicaid expansion enrollees with income above 100 percent FPL would not enroll in exchange plans. Accounting for these effects, we project the total federal savings from proposal #1 at $529.9 billion. If CBO assumes that states become more efficient with the phasedown of the 90 percent expansion FMAP, the projected savings would likely be slightly higher than our estimates.
We expect that CBO would estimate that proposal #1 would increase the number of people without health insurance by around 3.0 million people. This includes people in current non-expansion states that would not expand under the proposal, people above 100 percent FPL who would not enroll in exchange plans, and people below 100 percent FPL in current expansion states that drop their expansions. We estimate that proposal #1 would cause Medicaid enrollment to decline by about 8.3 million people in 2030 relative to CBO’s baseline projections—with a 4.5 million increase in enrollment in the exchanges, a 0.8 million increase in employer-sponsored insurance, and the 3.0 million increase in the number of uninsured.
The 3.0 million increase in the number of uninsured assumes a greater fealty to the law and enforcing eligibility rules for exchanges than currently exists. If people are generally able to overestimate income to above 100 percent FPL in order to claim PTCs, then the increase in the uninsured will be less than 3.0 million, perhaps much less. For these purposes, we anticipate how CBO would likely project the policy proposal, and CBO tends to assume general fealty to the law.
Proposal #2: Proposal #1 + Lowering the FMAP Floor
Proposal #2 has the same elements as proposal #1 with one additional modification that is further aimed at advancing equity in states’ receipt of federal Medicaid dollars. We lowered the floor to 40 percent for the U.S. jurisdiction with the highest per capita income, the District of Columbia. Using the new floor and the proportionate distance in per capita incomes between the other wealthy states and the District of Columbia, we calculated new FMAPs for the states that would currently have FMAPs below 50 percent if the floor were removed.52 Table 5 shows the FMAPs that correspond with proposal #2. To minimize disruptions for these 10 states plus the District of Columbia, both the expansion FMAP and the traditional FMAP would phase down gradually between 2026 and 2034 until they reach these percentages.

State Effects
In the aggregate, assuming 40 percent of expansion enrollees have income above 100 percent FPL, the state costs of proposal #2 are roughly $172.6 billion—with $171.5 billion in costs from the decline in the expansion FMAP for enrollees below 100 percent FPL, $56.0 billion in state savings from switching expansion enrollees with income above 100 percent FPL to the exchanges, and $57.1 billion in costs from gradually reducing the FMAP from 50 percent in the 10 wealthiest states plus the District of Columbia for traditional Medicaid enrollees. Table 6 shows the fiscal effects by state, with a table in Appendix B that shows the range of costs associated with 30-50 percent of expansion enrollees having income above 100 percent FPL.

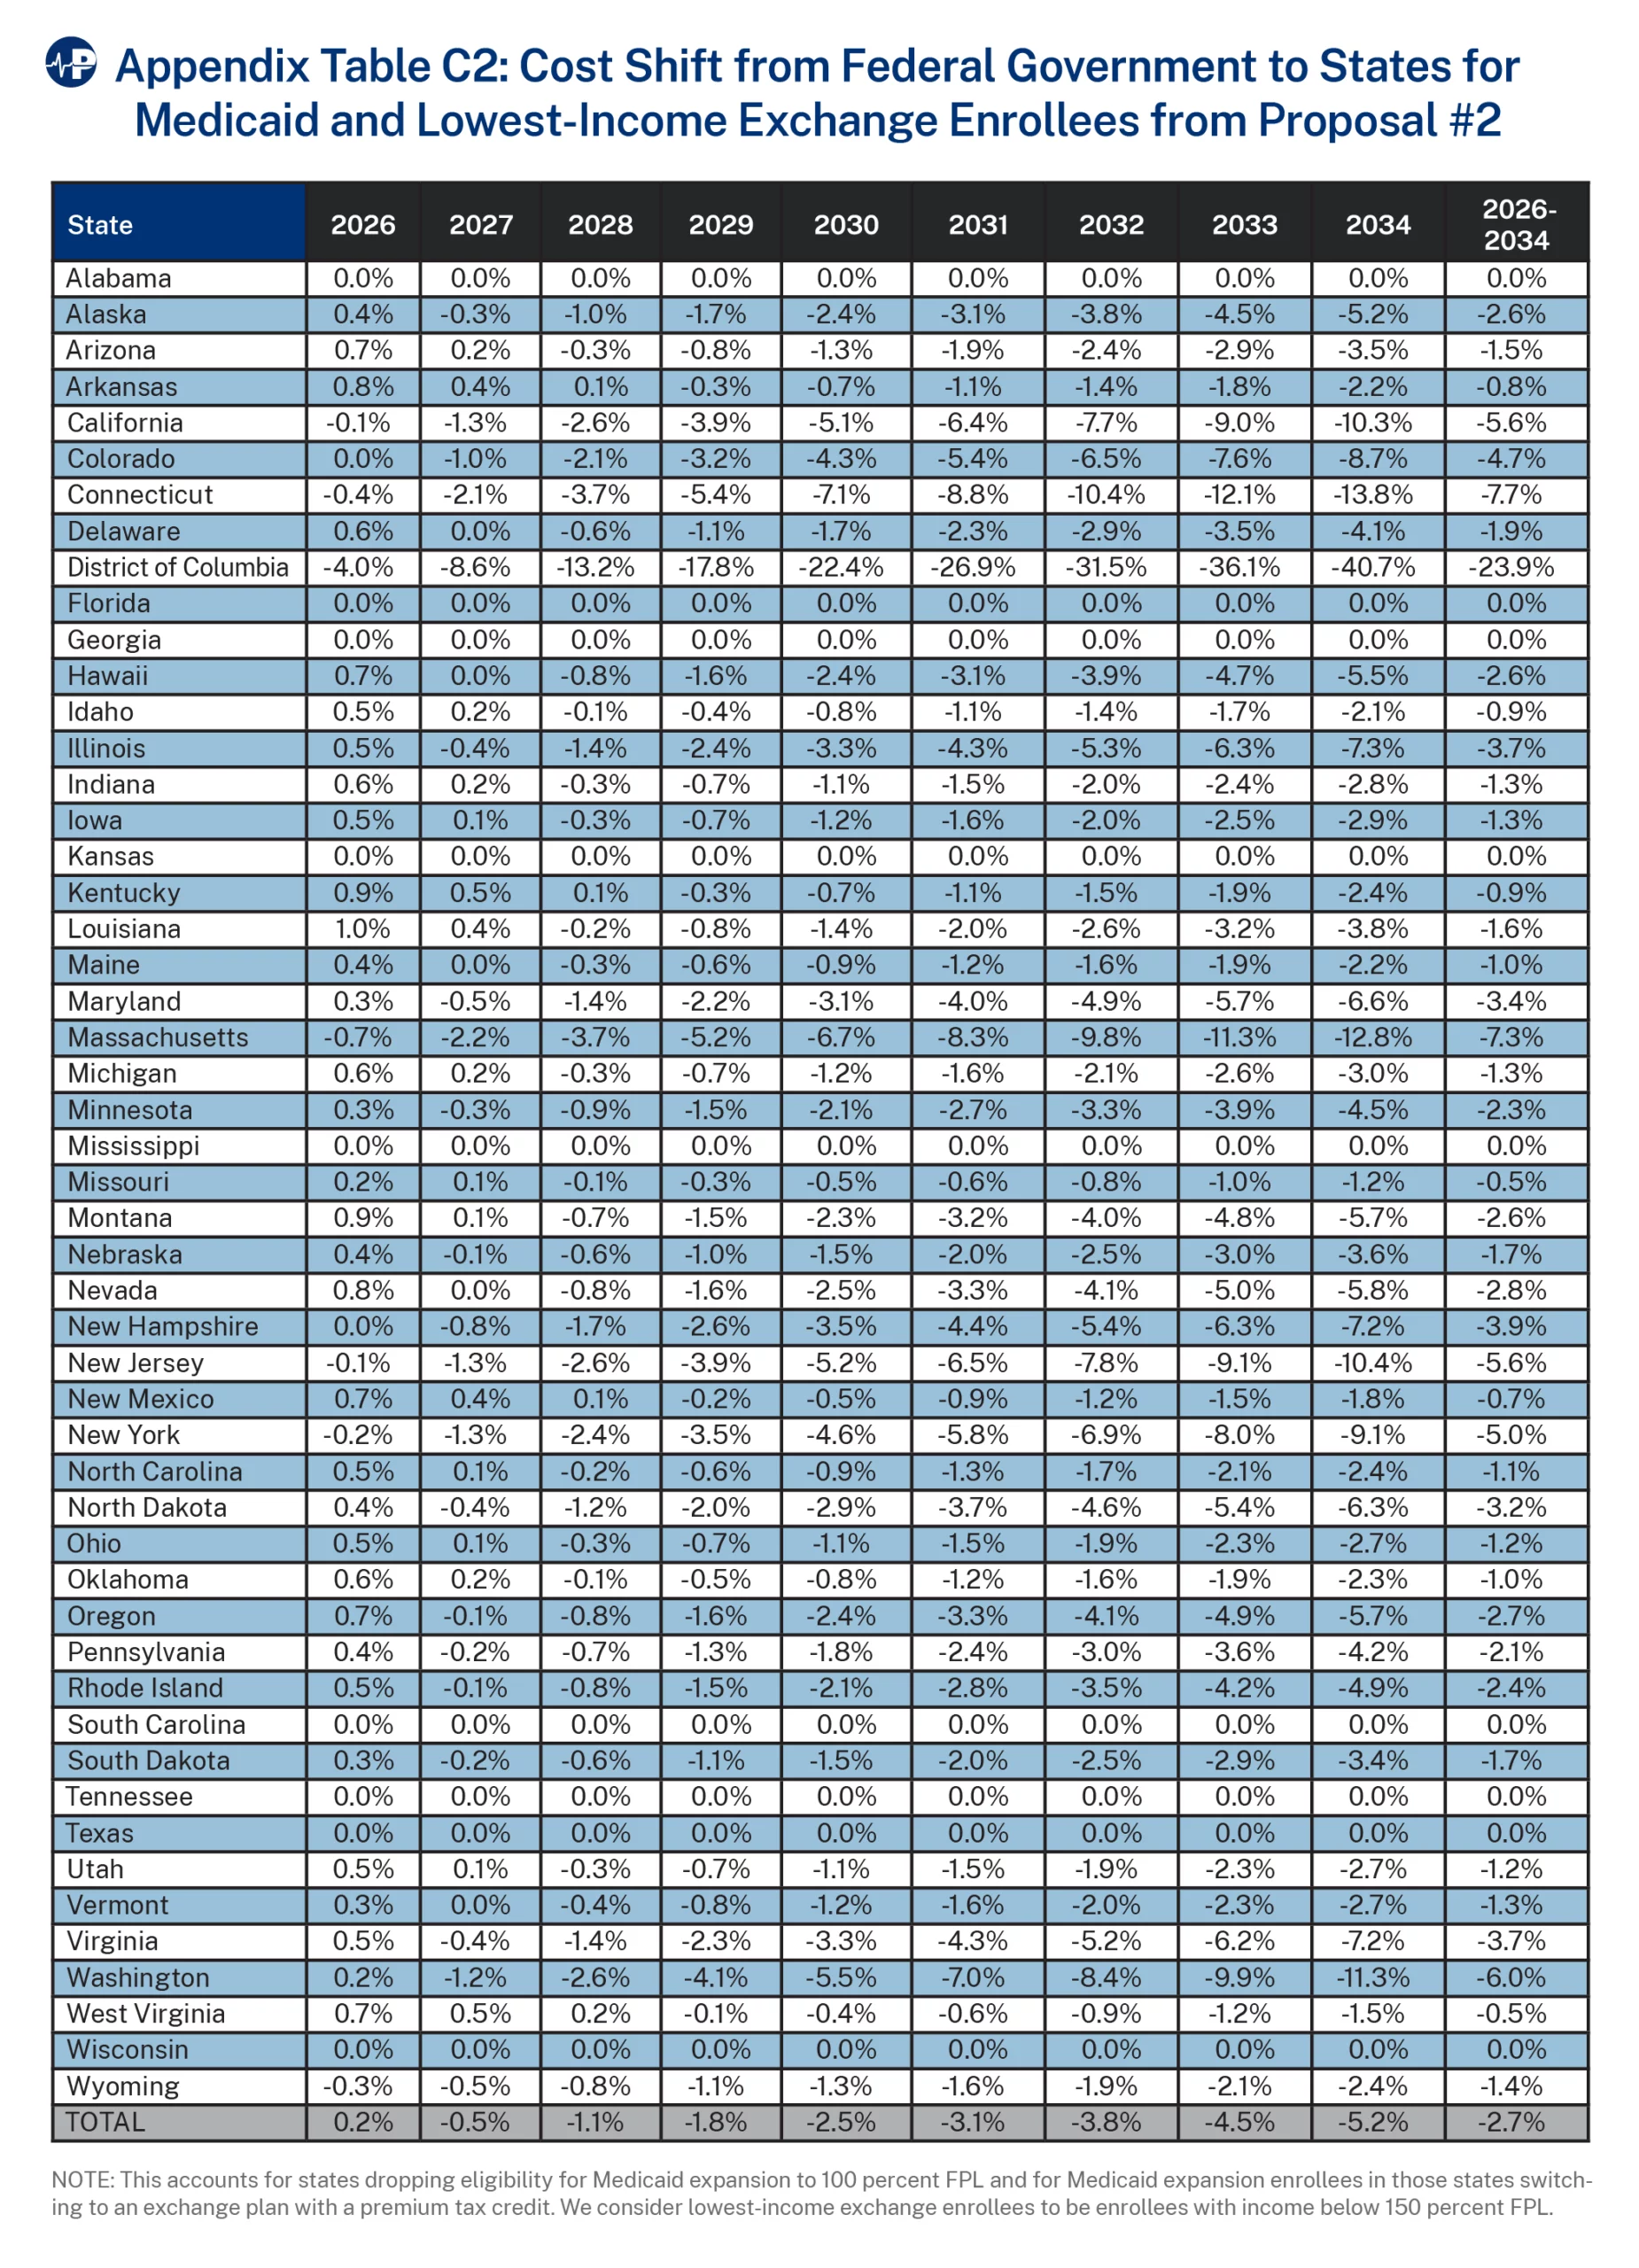
Overall, this proposal shifts about 2.7 percent of the combined costs of Medicaid and the premium tax credit cost for enrollees below 138 percent FPL who switch from Medicaid to the exchanges from the federal government to states over the 2026-2034 period, assuming the same overall coverage level (states maintain their expansions up to 100 percent FPL and no enrollment loss for enrollees above 100 percent FPL switched to the exchanges). Nine non-expansion states have zero additional costs under this proposal. The only non-expansion state with additional costs is Wyoming, because it is affected by the FMAP floor reduction.
For the median state, it is a 1.5 percent cost shift. The median state effect, excluding non-expansion states not affected by the proposal, is a 2.0 percent shift from the federal government to the states. As demonstrated by Appendix C (which shows, by state, the percentage cost shift from the federal government to states), the nation’s wealthiest states would receive the largest reductions in federal Medicaid support. This was an intended effect of the proposals in order to reduce the funding disparity that currently benefits wealthier states.
We do not assume that states change any eligibility requirements from replacing the 50 percent FMAP floor with the FMAPs the formula would produce. This assumption is consistent with how CBO models the removal of the FMAP floor.53 As such, we expect CBO would estimate the coverage effects of proposal #2 similarly to the effects of proposal #1—a decline in Medicaid enrollment of 8.3 million, an increase in exchange enrollment of 4.5 million people, an increase in employer-provided coverage by 0.8 million, and an increase in the number of uninsured by 3.0 million. Because states would likely try to become more efficient if their FMAPs were lower, these estimates are higher than the actual fiscal costs states would incur from removing the 50 percent FMAP floor for the traditional populations.
The jurisdiction most affected by proposal #2 is the District of Columbia, since its FMAP drops from 70 percent to 40 percent over the budget window. Currently, the District of Columbia receives about 2.4 times more than the national average in federal Medicaid spending per person in poverty. After proposal #2 takes full effect in 2034, the District of Columbia would only receive about one-third more in federal Medicaid spending per person in poverty than average.
Proposal #2 would significantly increase overall program equity by reducing the spread between what wealthy states receive in federal Medicaid spending per person in poverty and what poorer states receive. The correlation coefficient between state per capita income and federal Medicaid spending per person in poverty would decline from 0.51 to 0.31 under proposal #2, or from 0.36 to 0.25 if the District of Columbia is excluded. So, while wealthier states would still receive more federal Medicaid spending per person in poverty under proposal #2, the difference would be reduced.
Federal Effects
We estimate that the federal savings from this proposal would amount to $314.2 billion over the 2026-2034 period. Table 7 shows the combined fiscal effect for states and the federal government from proposal #2.

There would be four components of federal savings. Two of them are identical to the savings from proposal #1—the savings from current non-expansion states not adopting expansion ($40.3 billion) and the savings from the shift of people with income above 100 percent FPL from Medicaid to the exchanges ($45.3 billion). The federal savings from the reduction of the 90 percent expansion FMAP for enrollees below 100 percent FPL would be $171.5 billion, which is slightly greater than the corresponding savings from proposal #1, as the end-stage FMAP is lower in 10 states plus the District of Columbia. Finally, there would be an estimated $57.1 billion in federal savings on expenditures from traditional Medicaid enrollees in these 10 states and the District of Columbia with the lowering of the FMAP floor. The last two savings amounts are the mirror images of the costs to states, as they represent a gradual shift in costs from the states to the federal government.
How Would CBO Score Proposal #2
There would be four components of federal savings. Two of them are identical to the savings from proposal #1—the savings from current non-expansion states not adopting expansion ($40.3 billion) and the savings from the shift of people with income above 100 percent FPL from Medicaid to the exchanges ($45.3 billion). The federal savings from the reduction of the 90 percent expansion FMAP for enrollees below 100 percent FPL would be $171.5 billion, which is slightly greater than the corresponding savings from proposal #1, as the end-stage FMAP is lower in 10 states plus the District of Columbia. Finally, there would be an estimated $57.1 billion in federal savings on expenditures from traditional Medicaid enrollees in these 10 states and the District of Columbia with the lowering of the FMAP floor. The last two savings amounts are the mirror images of the costs to states, as they represent a gradual shift in costs from the states to the federal government.

Bounding State Costs and Federal Savings
One of the major assumptions in our paper is that roughly 40 percent of expansion enrollees are in households with income above 100 percent FPL. That assumption is important for our estimates, particularly of state costs. If a greater share of expansion enrollees are above 100 percent FPL, states costs would be smaller, because they save the 10 percent of costs on a larger share of enrollees, and they would pick up an increasing percentage of the costs—from the 90 percent FMAP phasedown—on a smaller share of enrollees. For proposals #1 and #2, Appendix B shows the state costs under assumptions that 30 percent of expansion enrollees are above 100 percent FPL and that 50 percent of expansion enrollees are above 100 percent FPL, along with the costs under the 40 percent assumption we use in the body of the paper. Based on discussions with Medicaid program experts, we believe that this range is the likely bound of state costs, although the 50 percent assumption is more likely than the 30 percent assumption.
Table 9 shows the estimated federal savings, inclusive of all the above effects that CBO would likely include in its projections, based on three different assumptions of the percentage of expansion enrollees with income above 100 percent FPL. The key takeaway is that the amount of federal savings is not nearly as affected by the percentage of expansion enrollees above 100 percent FPL as state costs are. For states, it makes a big difference between saving 10 percent of the cost of enrollees above 100 percent FPL and picking up a gradually increasing share of the cost for enrollees with income below 100 percent FPL because of the phasedown. For the federal government, it saves on both sides with somewhat greater savings from the phasedown of the 90 percent FMAP for enrollees below 100 percent FPL than its savings from spending less on Medicaid than on PTCs for enrollees above 100 percent FPL.

Discussion of Basing Federal Funds on the Number of People in Poverty
As shown earlier in this paper, federal Medicaid expenditures are inequitably distributed across the country. A better way to target federal funds for Medicaid would be to base the distribution on the number of people in poverty in each state, potentially adjusting for state cost-of-living differences. Such an adjustment might also consider age of state populations, because health care costs increase as people age, an adjustment suggested by the Government Accountability Office.54 Any transition to a new Medicaid distribution would need to take place over a lengthy time period, perhaps as long as two decades given the practical difficulties of changing the way the federal government reimburses states through the Medicaid program. A gradual transition would allow states more time to adjust to the new funding structure.
Discussion of Capping the Amount of Total Federal Funding
For more than four decades, many conservative proposals for Medicaid financing reform have envisioned block granting the program—or allocating a set amount of federal funds per state to help finance lower-income peoples’ health care and long-term care needs.55 There are several positive features of such a proposal, and the result would be a much more efficient program with state incentives focused on maximizing value from program expenditures rather than maximizing the receipt of federal dollars. Under fixed allotments, states would have much greater incentives to ensure that only eligible recipients are enrolled and that payment rates to insurers and supplemental payments to health care providers are not excessive.
With a 60 percent FMAP, states need to receive 40 cents of actual value for each dollar of Medicaid spending in order to justify the dollar expenditure. With the 90 percent FMAP, states need to receive only 10 cents of value for each dollar of spending to justify a dollar expenditure on the expansion population. With a fixed amount of money, states would be responsible for 100 percent of the cost of expenditures beyond the federal contribution. Thus, states would need to receive at least $1 in value from a $1 expenditure in order to rationally incur the cost.
Another important benefit of fixed federal allotments is that states would no longer have incentives for financing gimmicks. The only reason that Medicaid financing schemes exist is because they permit states to obtain federal funds from artificial or fake expenditures through the open-ended federal reimbursement. States may still wish to tax health care providers to finance part of Medicaid, but without the open-ended reimbursement of state expenditures, there would not be any more corrupt bargains that permit states to make providers whole—or generally much better than whole—with federal funds obtained through the FMAP structure.
Critics of block grants often argue that the FMAP structure is countercyclical and allocates greater expenditures to states during economically challenging times. This criticism is misplaced for two central reasons. First, the FMAP is an average of three years of state per capita income (after a two-year lag) and thus adjusts too slowly for any meaningful change in economic conditions. Second, as argued in this paper, per capita income is not the best measure of the need that states have for resources to support their Medicaid programs. Third, Congress routinely raises state FMAPs during economic recessions. In the aftermath of the 2008 financial crisis, Congress increased state FMAPs by about 10 percent in the American Recovery and Reinvesment Act. More recently, in the Families First Coronavirus Response Act, Congress increased state FMAPs by 6.2 percentage points (about 10 percent for the state with average per capita state income) for the duration of the public health emergency so long as states did not remove people from Medicaid—even people who no longer met the eligibility criteria.56 Of note, one problem with across-the-board FMAP increases is that they disproportionately benefit wealthy states that have larger programs.57
Some critics of Medicaid block grants say that funding would not be sufficient if a plethora of additional people become eligible for the program. These criticisms led to the development of an alternative to fixed federal allotments: the so-called per capita cap proposal, under which each state would receive a set amount of money per person enrolled in a category—aged, disabled, child, and non-disabled adult. The total federal contribution to states would be the sum of the products of the number of enrollees within each category and the per capita amount for each such enrollee. Such a structure would adjust the contribution to the number of enrollees, but it would also encourage states to enroll people in the program—particularly people who are unlikely to utilize many health care services and ineligible people—and thus could exacerbate improper enrollment in the program. The explosion of improper payments rates in the program that resulted from states eschewing proper eligibility reviews after the ACA’s Medicaid expansion is evidence that eligibility errors would be a real risk under such a program design.58
The development of a block grant or a per capita cap proposal are beyond the scope of this paper. Such a proposal involves three primary sets of policy decisions: (1) how to allocate the federal funds across the states, (2) what requirements to place on states to receive the federal funds, and (3) how to grow the federal funding over time. The discussion in this paper is largely focused on the first of these. Any Medicaid financing reform proposal should phase out the 90 percent ACA expansion reimbursement and should reduce—if not eventually eliminate—the disparity in federal funds received between wealthy and poor states. Moving away from the state per capita income FMAP structure to a structure based on a cost-of-living-adjusted poverty by state would be one way to do so
In a future paper, we will explore the requirements to place on states to receive federal Medicaid funds, which involve determining the people who must be covered by the program and a required set of benefits. We will also model specific proposals that would base federal financing on fixed allotments to states at a growth factor that would achieve comparable levels of federal savings to the two proposals advanced in this paper.
Conclusion
Medicaid policy should not discriminate against the most vulnerable and should not disadvantage poorer states relative to richer states. In Medicaid expansion states, resources have been diverted from traditional Medicaid enrollees—low-income children, pregnant women, seniors, and individuals with disabilities—to the able-bodied, working-age expansion population. The proposals put forward in this paper would end the government’s discrimination against the vulnerable by phasing down the enhanced FMAP for the expansion population so that it reaches parity with a state’s traditional FMAP by 2034. Proposal #2 would also reduce the funding disparity that favors wealthier states by lowering the FMAP floor in the wealthiest states and the District of Columbia. Both proposals would significantly increase private health insurance coverage and reduce federal spending by more than half a trillion dollars over the next decade.
Appendix A
State Baseline Construction
The state-level baseline used CMS-64 data of federal Medicaid expenditures for both the non-expansion enrollees and expansion enrollees in fiscal year 2019 to establish distributions (which sum to one) of federal spending on both non-expansion and expansion enrollees. These distributions remain constant throughout the budget window. These distributions are then applied to the baseline national projections produced by CBO of both non-expansion and expansion expenditures to construct state-level baselines over the budget window. The sum of the state baselines thus matches the national projections from CBO.59
For each state that expanded after 2019, we take the most recently available data for expansion spending and then adjust this spending to produce a spending estimate that reflects the amount the state would have spent had it expanded in 2019.60 This adjustment takes 2022 expansion spending for the state and then reduces the level of spending by the percentage that non-expansion spending grew for the state between 2019 and 2022. Idaho, Missouri, Oklahoma, Tennessee, and Utah receive this adjustment. For states that expanded after 2022—North Carolina and South Dakota—we use estimates from the Urban Institute and perform a similar adjustment to account for 2023 spending levels.61
Two states have serious data reporting issues that we needed to rectify. Vermont does not report per person spending by eligibility category, and North Dakota’s per person spending reporting is not consistent with estimates that use total expansion spending and enrollment. In order to account for these inconsistencies for these states, we use per person spending from the Medicaid and CHIP (MAC) scorecard in our analysis that compares the per person costs of Medicaid with the value of the PTC.62

Appendix B and Appendix C
Appendix B1 shows the state estimates of costs under proposal #1 using three assumptions for the percentage of expansion enrollees with income above 100 percent of FPL. Appendix B2 shows the state estimates of costs under proposal #2 using the same three assumptions. Appendix C1 shows the shift in costs from the federal government to states under proposal #1. The shift in costs accounts for states dropping eligibility for Medicaid expansion to 100 percent FPL and for Medicaid expansion enrollees in those states switching to an exchange plan with a PTC. Appendix C2 shows the shift in costs under proposal #2.


Footnotes
1↑ FMAP_State=1-(Per Capita Income_State )^2/(Per Capita Income_(U.S.) )^2 ×0.45
2↑ There is also an FMAP ceiling at 83 percent, but it is generally not binding.
3↑ Brian Blase, “Evidence Is Mounting: The Affordable Care Act Has Worsened Medicaid’s Structural Problems,” Mercatus Center, September 2016, https://papers.ssrn.com/sol3/papers.cfm?abstract_id=3191503
4↑ Government Accountability Office (GAO), Medicaid: States Use Illusory Approaches to Shift Program Costs to Federal Government, August 1994, https://www.gao.gov/assets/hehs-94-133.pdf
5↑ Brian Blase, “Evidence Is Mounting: The Affordable Care Act Has Worsened Medicaid’s Structural Problems.”
6↑ Michael S. Greve, Federalism and the Constitution: Competition versus Cartels (Arlington, VA: Mercatus Center at George Mason University, 2015), quoted in Blase, “Evidence Is Mounting.”
7↑ Department of Health and Human Services, Office of the Assistant Secretary for Planning and Evaluation, “Poverty Guidelines,” https://aspe.hhs.gov/topics/poverty-economic-mobility/poverty-guidelines
8↑ Arizona, Arkansas, California, Colorado, Connecticut, Delaware, the District of Columbia, Hawaii, Illinois, Iowa, Kentucky, Maryland, Massachusetts, Minnesota, Nevada, New Jersey, New Mexico, New York, North Dakota, Ohio, Oregon, Rhode Island, Vermont, Washington, and West Virginia expanded Medicaid on January 1, 2014. Other states expanded later: Michigan (4/1/2014), New Hampshire (8/15/2014), Pennsylvania (1/1/2015), Indiana (2/1/2015), Alaska (9/1/2015), Montana (1/1/2016), Louisiana (7/1/2016), Virginia (1/1/2019), Maine (1/10/2019 with coverage retroactive to 7/2/2018), Idaho (1/1/2020), Utah (1/1/2020), Nebraska (10/1/2020), Oklahoma (7/1/2021), Missouri (processing applications beginning 10/1/2021 with coverage retroactive to 7/1/2021), South Dakota (7/1/2021), and North Carolina (12/1/2023).
9↑ Brian Blase, “Evidence Is Mounting: The Affordable Care Act Has Worsened Medicaid’s Structural Problems.”
10↑ Updated to correctly state findings from original source: KFF, “Medicaid Income Eligibility Limits for Other Non-Disabled Adults, 2011-2023,” https://www.kff.org/medicaid/state-indicator/medicaid-income-eligibility-limits-for-other-non-disabled-adults/
11↑ Brian Blase and David Balat, “Is Medicaid Expansion Worth It? A Review of the Evidence Suggests Targeted Programs Represent Better Policy,” Texas Public Policy Foundation, April 2020, https://tinyurl.com/mstxpcsf; and Brian Blase and Drew Gonshorowski, “Resisting the Wave of Medicaid Expansion: Why Florida Is Right,” December 2023, https://paragoninstitute.org/wp-content/uploads/2023/12/Resisting-the-Wave-Florida-Medicaid.pdf.
12↑ Amy Finkelstein, Nathaniel Hendren, and Erzo F. P. Luttmer, “The Value of Medicaid: Interpreting Results from the Oregon Health Insurance Experiment,” Journal of Political Economy 127, no. 6 (2019): 2836-2874.
13↑ Blase and Balat, “Is Medicaid Expansion Worth It?”
14↑ Blase and Balat, “Is Medicaid Expansion Worth It?”
15↑ Charles Blahous and Liam Sigaud, “The Affordable Care Act’s Medicaid Expansion Is Shifting Resources away from Low-Income Children,” Mercatus Center, December 13, 2022, https://www.mercatus.org/research/research-papers/affordable-care-acts-medicaid-expansion-shifting-resources-away-low-income
16↑ Walter Hsiang et al., “Medicaid Patients Have Greater Difficulty Scheduling Health Care Appointments Compared with Private Insurance Patients: A Meta-Analysis,” Inquiry 56 (2019), https://www.ncbi.nlm.nih.gov/pmc/articles/PMC6452575/
17↑ Markus Bjoerkheim, Kofi Ampaabeng, and Liam Sigaud, “The Effect of the Affordable Care Act’s Medicaid Expansion on the Mental Health of Already-Enrolled Medicaid Beneficiaries,” Mercatus Center, July 19, 2023, https://www.mercatus.org/research/working-papers/effect-affordable-care-acts-medicaid-expansion-mental-health-already
18↑ Blahous and Sigaud, “The Affordable Care Act’s Medicaid Expansion.”
19↑ Blahous and Sigaud, “The Affordable Care Act’s Medicaid Expansion.”
20↑ Sarah Miller and Laura Wherry, “Health and Access to Care During the First 2 Years of the ACA Medicaid Expansions,” New England Journal of Medicine 376 (2017): 947-956, https://www.nejm.org/doi/full/10.1056/NEJMsa1612890
21↑ Charles Courtemanche et al. “The Affordable Care Act and Ambulance Response Times,” Journal of Health Economics 67 (2019), https://www.sciencedirect.com/science/article/abs/pii/S0167629618300523
22↑ Hsiang et al., “Medicaid Patients Have Greater Difficulty Scheduling Health Care Appointments.”
23↑ Brian Blase and Aaron Yelowitz, “The ACA’s Medicaid Expansion,” Mercatus Center, November 25, 2019, https://www.mercatus.org/research/research-papers/acas-medicaid-expansion
24↑ John Holahan et al., “The Cost and Coverage Implications of the ACA Medicaid Expansion: National and State-by-State Analysis,” Urban Institute, November 28, 2012, https://www.urban.org/research/publication/cost-and-coverage-implications-aca-medicaid-expansion-national-and-state-state-analysis; Brian Blase and Drew Gonshorowski, “Resisting the Wave of Medicaid Expansion: Why Florida Is Right,” Paragon Health Institute, December 2023, https://paragoninstitute.org/wp-content/uploads/2023/12/Resisting-the-Wave-Florida-Medicaid.pdf.
25↑ Blase and Yelowitz, “The ACA’s Medicaid Expansion.”
26↑ HHS, Office of Inspector General, California Made Medicaid Payments on Behalf of Non-Newly Eligible Beneficiaries Who Did Not Meet Federal and State Requirements, December 2018, https://oig.hhs.gov/oas/reports/region9/91702002.pdf
27↑ CMS, “2019 Estimated Improper Payment Rates for Centers for Medicare and Medicaid Services (CMS) Programs,” November 18, 2019, https://www.cms.gov/newsroom/fact-sheets/2019-estimated-improper-payment-rates-centers-medicare-medicaid-services-cms-programs
28↑ CMS, “2019 Estimated Improper Payment Rates.” The true improper payment rate was both inaccurate and artificially low in both of these reports. The Obama administration stopped eligibility audits, so the prior year’s improper payment rate (the 2018 report) did not include how states were assessing eligibility in any state. And only one-third of states were audited for eligibility in the 2019 report. If CMS had done eligibility audits of every state, it is likely that the national improper payment rate would have been upwards of 25 percent.
29↑ Blase and Yelowitz, “The ACA’s Medicaid Expansion.”
30↑ Blase and Yelowitz, “The ACA’s Medicaid Expansion.”
31↑ Blase and Yelowitz, “The ACA’s Medicaid Expansion.”
32↑ CMS, Medicaid and CHIP 2013 Improper Payments Report, https://www.cms.gov/Research-Statistics-Data-and-Systems/Monitoring-Programs/Medicaid-and-CHIP-Compliance/PERM/Downloads/2013MedicaidandCHIPImproperPaymentsReport.pdf
33↑ CMS, “PERM Error Rate Findings and Reports,” https://www.cms.gov/research-statistics-data-and-systems/monitoring-programs/medicaid-and-chip-compliance/perm/permerrorratefindingsandreport
34↑ CMS, “2019 Estimated Improper Payment Rates for Centers for Medicare and Medicaid Services (CMS) Programs.”
35↑ The per capita income amounts are calculated using the three most recent calendar years of data available from the Department of Commerce, which are three to five years earlier than the fiscal year in which the formula applies. For example, the 2021 FMAP covers October 2020 through September 2021 and uses calendar year data from 2016, 2017, and 2018. This three-year average is designed to smooth adjustments over time.
36↑ These calculations are for states with FMAPs of 50 percent and 75 percent, respectively. These calculations ignore state budget gimmicks that effectively increase the federal share of expenditures.
37↑ According to the Committee for a Responsible Federal Budget, “The Government Accountability Office (GAO) and the Medicaid and CHIP Payment and Access Commission (MACPAC) have both estimated that the ‘real FMAP,’ averages around 5 percentage points higher after accounting for the impact of financing schemes that shift costs to the federal government. Specifically, MACPAC estimated that in 2018 creative financing shifted federal matching costs 5.4 percentage points higher overall – by up to 2 percentage points for 11 states, 2 to 4 percentage points for 18 states, 4 to 6 percentage points for 12 states, and more than 6 percentage points for 10 states.” Committee for a Responsible Federal Budget, Time to Fix Medicaid Financing Schemes,” June 23, 2023, https://www.crfb.org/papers/time-fix-medicaid-financing-schemes
38↑ Liam Sigaud, “Why Average Income Isn’t a Good Way to Distribute Federal Medicaid Funds to State,” Open Health Policy, August 4, 2023, https://www.openhealthpolicy.com/p/why-average-income-isnt-a-good-way
39↑ In 2019, Maine’s per capita income was $50,728, and Nevada’s was $52,602.
40↑ In 2019, Florida’s FMAP was 60.9 percent, and Wisconsin’s was 59.4 percent.
41↑ A portion of the state share of the cost of the ACA expansion population for many states does not represent a real cost to the state. States have employed financing gimmicks for decades that effectively mean that the federal government provides reimbursement on artificial state expenditures. Thus, the 10 percent figure is an upper bound of state costs of the ACA Medicaid expansion population and thus an upper bound on the savings from the movement of enrollees with income above 100 percent FPL from Medicaid to the exchanges.
42↑ We chose 40 percent after consulting with several Medicaid program experts, including those at the Congressional Budget Office.
43↑ To estimate this amount, we started with CBO’s estimate of Medicaid expansion spending in 2025 and inflatedthat amount by CBO’s projections in per expansion enrollee cost growth.
44↑ We assume that per enrollee expenditures are the same for people above and below 100 percent FPL.
45↑ For this estimate, we calculated the difference in per person costs between an expansion enrollee and the average PTC if that person were enrolled in an exchange plan. To calculate the average PTC, we estimate an age rating distribution for the expansion population from the 2019 American Community Survey from the U.S. Census Bureau and apply this to the average benchmark premium for a 21-year-old. We apply growth assumptions from CBO’s Medicaid and federal subsidy baselines.
46↑ The actuarial value of a plan is the expected percentage of total spending reimbursed by the plan for the average enrollee.
47↑ Brian Blase and Drew Gonshorowski, “The Great Obamacare Enrollment Fraud,” Paragon Health Institute, June 2024, https://paragoninstitute.org/wp-content/uploads/2024/06/The-Great-Obamacare-Enrollment-Fraud_FOR_RELEASE_V2.pdf
48↑ Blase and Gonshorowski, “The Great Obamacare Enrollment Fraud.”
49↑ Blase and Yelowitz, “The ACA’s Medicaid Expansion.”
50↑ This includes the 10 percent state share plus the costs that states would save relative to proposal #1’s phasedown of the 90 percent FMAP.
51↑ Total federal savings reflect one-quarter of the federal cost of states maintaining expansion under Proposal #1. This accounts for the sunsetting of the 90 percent expansion FMAP, returning all enrollees to the standard FMAP rate for their respective states. These calculations assume those expansion enrollees above 100% FPL (about 40 percent of all expansion enrollees) will be transferred to the exchanges and receive federally-subsidized coverage.
52↑ Several factors influence coverage transitions, including administrative procedures and knowledge of program availability. Based on our conversations with experts, including those at CBO, we believe that this estimate is close to what CBO would assume if modeling this proposal.
53↑ Of note, we do not include any interaction with employer-sponsored insurance. Some of these individuals in these categories would gain access and enroll in employer-sponsored insurance. Thus, the 4.5 milloin people estimate of the increase in the number of uninsured is an upper bound.
54↑ Under proposal #2, we moved the FMAP floor to 40 percent for the highest per capita income jurisdiction (the District of Columbia). We then applied a linear interpolation based on state per capita income between the District and a 50 percent FMAP to obtain the FMAP floors for the other wealthy states that would currently have FMAPs below 50 percent if not for the 50 percent floor.
55↑ CBO, “Reduce Federal Medicaid Matching Rates,” in Options for Reducing the Deficit, 2023 to 2032—Volume I: Larger Reductions, December 7, 2022, https://www.cbo.gov/budget-options/58624
56↑ GAO, Medicaid Formula: Differences in Funding Ability Among States Often Are Widened, July 2003, p. 31, https://www.gao.gov/assets/gao-03-620.pdf#page=36.44; and William J. Scanlon, Director, Health Systems Issues, GAO, letter to Thomas J. Bliley Jr., Chairman, House Commerce Committee, June 10, 1996, https://www.gao.gov/assets/hehs-96-164r.pdf.
57↑ The first Medicaid block grant was proposed by President Reagan, in his 1982 budget. In 1995, Congress, after Republicans captured both houses of Congress in the 1994 Republican wave election, passed Medicaid block grants. That legislation was vetoed by President Clinton. In 2017, the U.S. House of Representatives passed legislation that contained much weaker aggregate caps on Medicaid spending for certain categories of enrollees with the FMAP structure working underneath.
58↑ The Families First Coronavirus Relief Act increased the standard FMAP by 6.2 percentage points for each state so long as the state complied with the continuous coverage requirement. This requirement included only removing people from the rolls if they requested to be removed, moved out of state, or died. The FMAP increase was phased out during 2023 after the passage of the Consolidated Appropriations Act of 2023. CMS, “Medicaid Program; Temporary Increase in Federal Medical Assistance Percentage (FMAP) in Response to the COVID-19 Public Health Emergency (PHE); Reopening of Public Comment Period,” 87 Fed. Reg. 58456 (Sep. 7, 2022), https://www.federalregister.gov/d/2022-20973/p-16; Emilie Stoltzfus, “Temporary Federal Medical Assistance Percentage (FMAP) Increase for Title IV-E Foster Care and Permanency Payments,” Congressional Research Service, January 9, 2023, https://crsreports.congress.gov/product/pdf/IN/IN11297.
59↑ Brian Blase, “A Smarter Approach to Offering States Federal COVID-19 Relief Funds,” National Review, March 13, 2020, https://www.nationalreview.com/2020/03/a-smarter-approach-to-offering-states-federal-covid-19-relief-funds/
60↑ Brian Blase and Joe Albanese, “America’s Largest Health Care Programs Are Full of Improper Payments.” Paragon Health Institute, December 4, 2022, https://paragoninstitute.org/medicaid/americas-largest-health-care-programs-are-full-of-improper-payments/
61↑ We assume that no current non-Medicaid expansion states adopt expansion. The topline was otherwise constructed to match CBO’s national estimates.
62↑ We use 2022 expansion spending data and adjust according to the states’ non-expansion growth between 2019 and 2022.
Related Research

Author


Acknowledgements
The authors are most grateful to Liam Sigaud and Niklas Kleinworth for exceptional work contributing to the development of the policy proposals and in reviewing the paper, particularly the cost and savings estimates. We are also grateful for reviews and helpful comments from Aaron Yelowitz, Gary Alexander, Doug Badger, Jonathan Ingram, Hayden Dubois, Theo Merkel, and Emma Gallutia.