

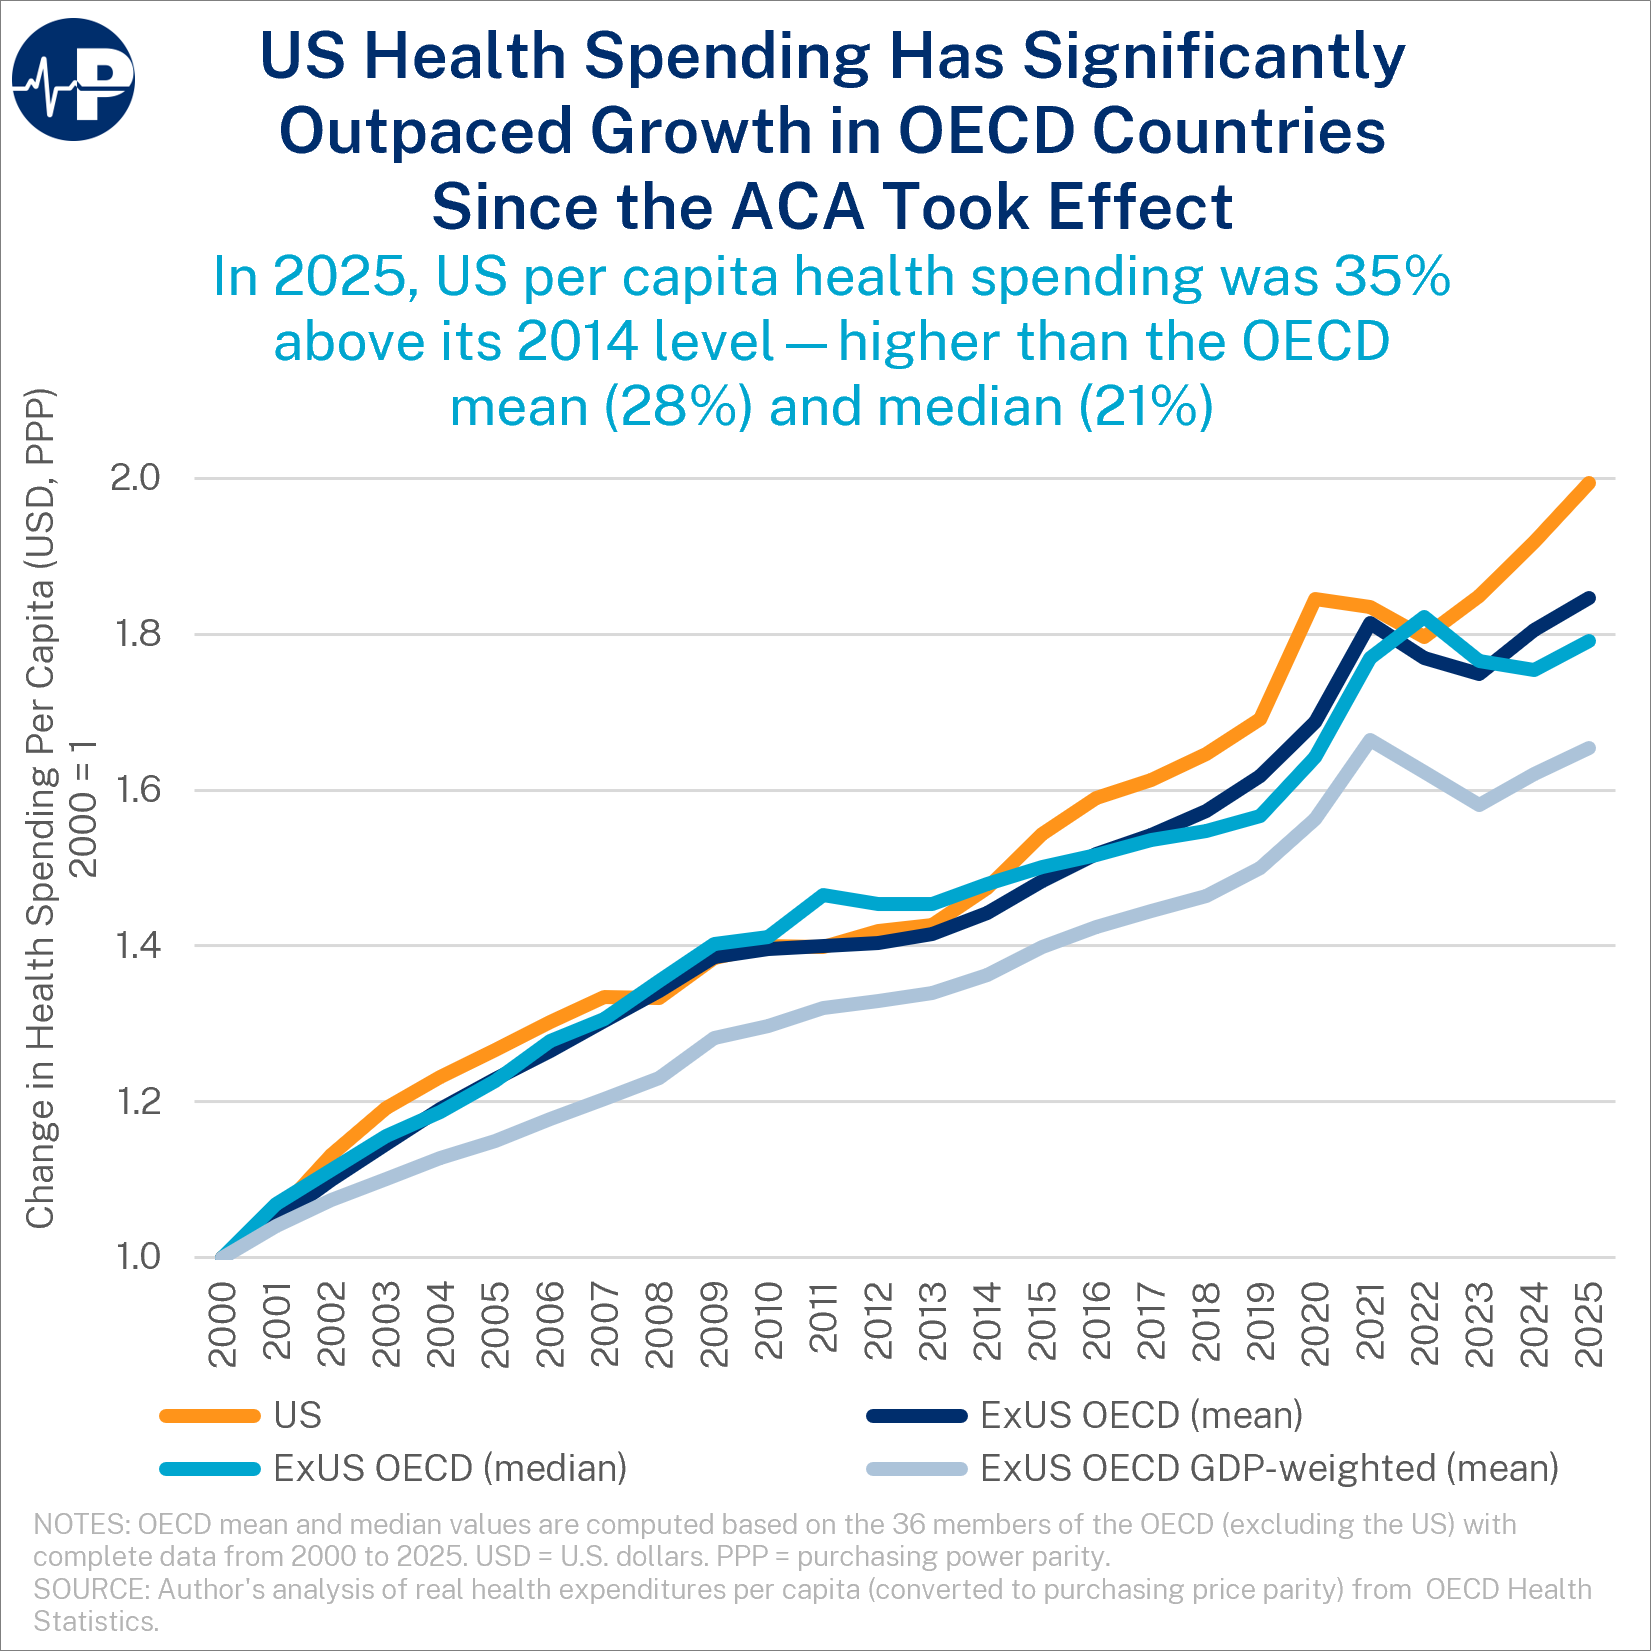

One of the recurring claims made about the Affordable Care Act (ACA) is that it “bent the cost curve.” The evidence usually offered is the slowdown in U.S. health spending growth that began around 2010, when the law was enacted. (The actual slowdown began several years prior to then.) But attributing causality based on such a pre/post comparison is simplistic and often misleading. What if broader, global forces would have dampened the growth of U.S. health spending even in the absence of the ACA?
One way to test the ACA’s role is to compare the trajectory of U.S. health spending against other high-income countries that did not enact similar major health policy changes in or around 2010. This PIC indexes real per capita health spending (converted at purchasing power parity) to its 2000 level for the United States and for the 36 other OECD countries with complete data through 2025.
By 2025, U.S. spending per person had roughly doubled relative to 2000. The comparison countries grew about 85 percent at the mean and about 80 percent at the median. Weighting by GDP (so that Germany and Japan count for more than Iceland), per capita health spending in the rest of the OECD grew about 65 percent.
Two features of the figure are crucial for assessing the ACA’s impact.
First, growth in per capita health spending from 2000 to 2010 was virtually identical in the U.S. (40 percent) and across other OECD countries (mean of 40 percent, median of 41 percent). The series continued to track closely through 2013, when per capita health spending in the U.S. was 43 percent higher than in 2000, the OECD mean was 42 percent above its 2000 level, and the OECD median had grown 45 percent.
Second, from 2014 onward U.S. spending growth accelerated and pulled away from the comparison group of other OECD countries, and the gap has continued to widen through 2025. This timing coincides precisely with the implementation of the ACA’s principal coverage provisions which have substantially increased federal health spending. By 2019, the U.S. was 69 percent above its 2000 level, while the OECD mean had grown 62 percent and the median had risen 57 percent.
Admittedly, other OECD countries do not constitute a perfect control group. Different countries faced a range of macroeconomic conditions, deployed a variety of cost containment measures to address health costs, and adopted different fiscal policies in response to the pandemic. Despite these limitations, it is notable that the divergence in health spending between the U.S. and other OECD countries occurred just as the ACA entered full implementation. Looking across countries, this pattern is more consistent with the ACA increasing health spending than decreasing it.
While the ACA almost certainly reduced cost pressures within Medicare through its hospital payment reductions, these savings were more than offset by increased spending elsewhere — namely, through the expansion of Medicaid, generous exchange subsidies, and accelerated industry consolidation spurred by the law’s regulatory burdens. This trajectory of higher spending was further exacerbated by the COVID-19 pandemic and subsequent Biden administration policies that emphasized enrollment over proper eligibility determinations. While U.S. health spending surged at the onset of the pandemic in 2020, international responses briefly narrowed the spending gap in 2021 and 2022 before U.S. per capita spending re-accelerated from 2023 to 2025, reestablishing a widening divergence from international peers.