
Theo Merkel
Theo Merkel is the Director of the Private Health Reform Initiative and a Senior Research Fellow for the Paragon Health…
Reforming Government. Empowering Patients.
Navigation
This paper assesses the accuracy of federal methods for identifying primary care shortages and suggests updates to better reflect today’s workforce and demographics.
What This Research Paper Covers
The federal government has been designating communities as underserved or with a shortage of primary care providers since the 1970s. These designations are used to place primary care providers in these communities via the National Health Service Corps or to encourage the establishment of federally certified Rural Health Clinics or Community Health Centers/Federally Qualified Health Centers.
This paper examines whether the methodology used to determine whether a shortage exists is up to date and reflects the primary care workforce available throughout the United States. This paper also explores the policy implications of having outdated or obsolete methodologies and makes recommendations.
What We Found
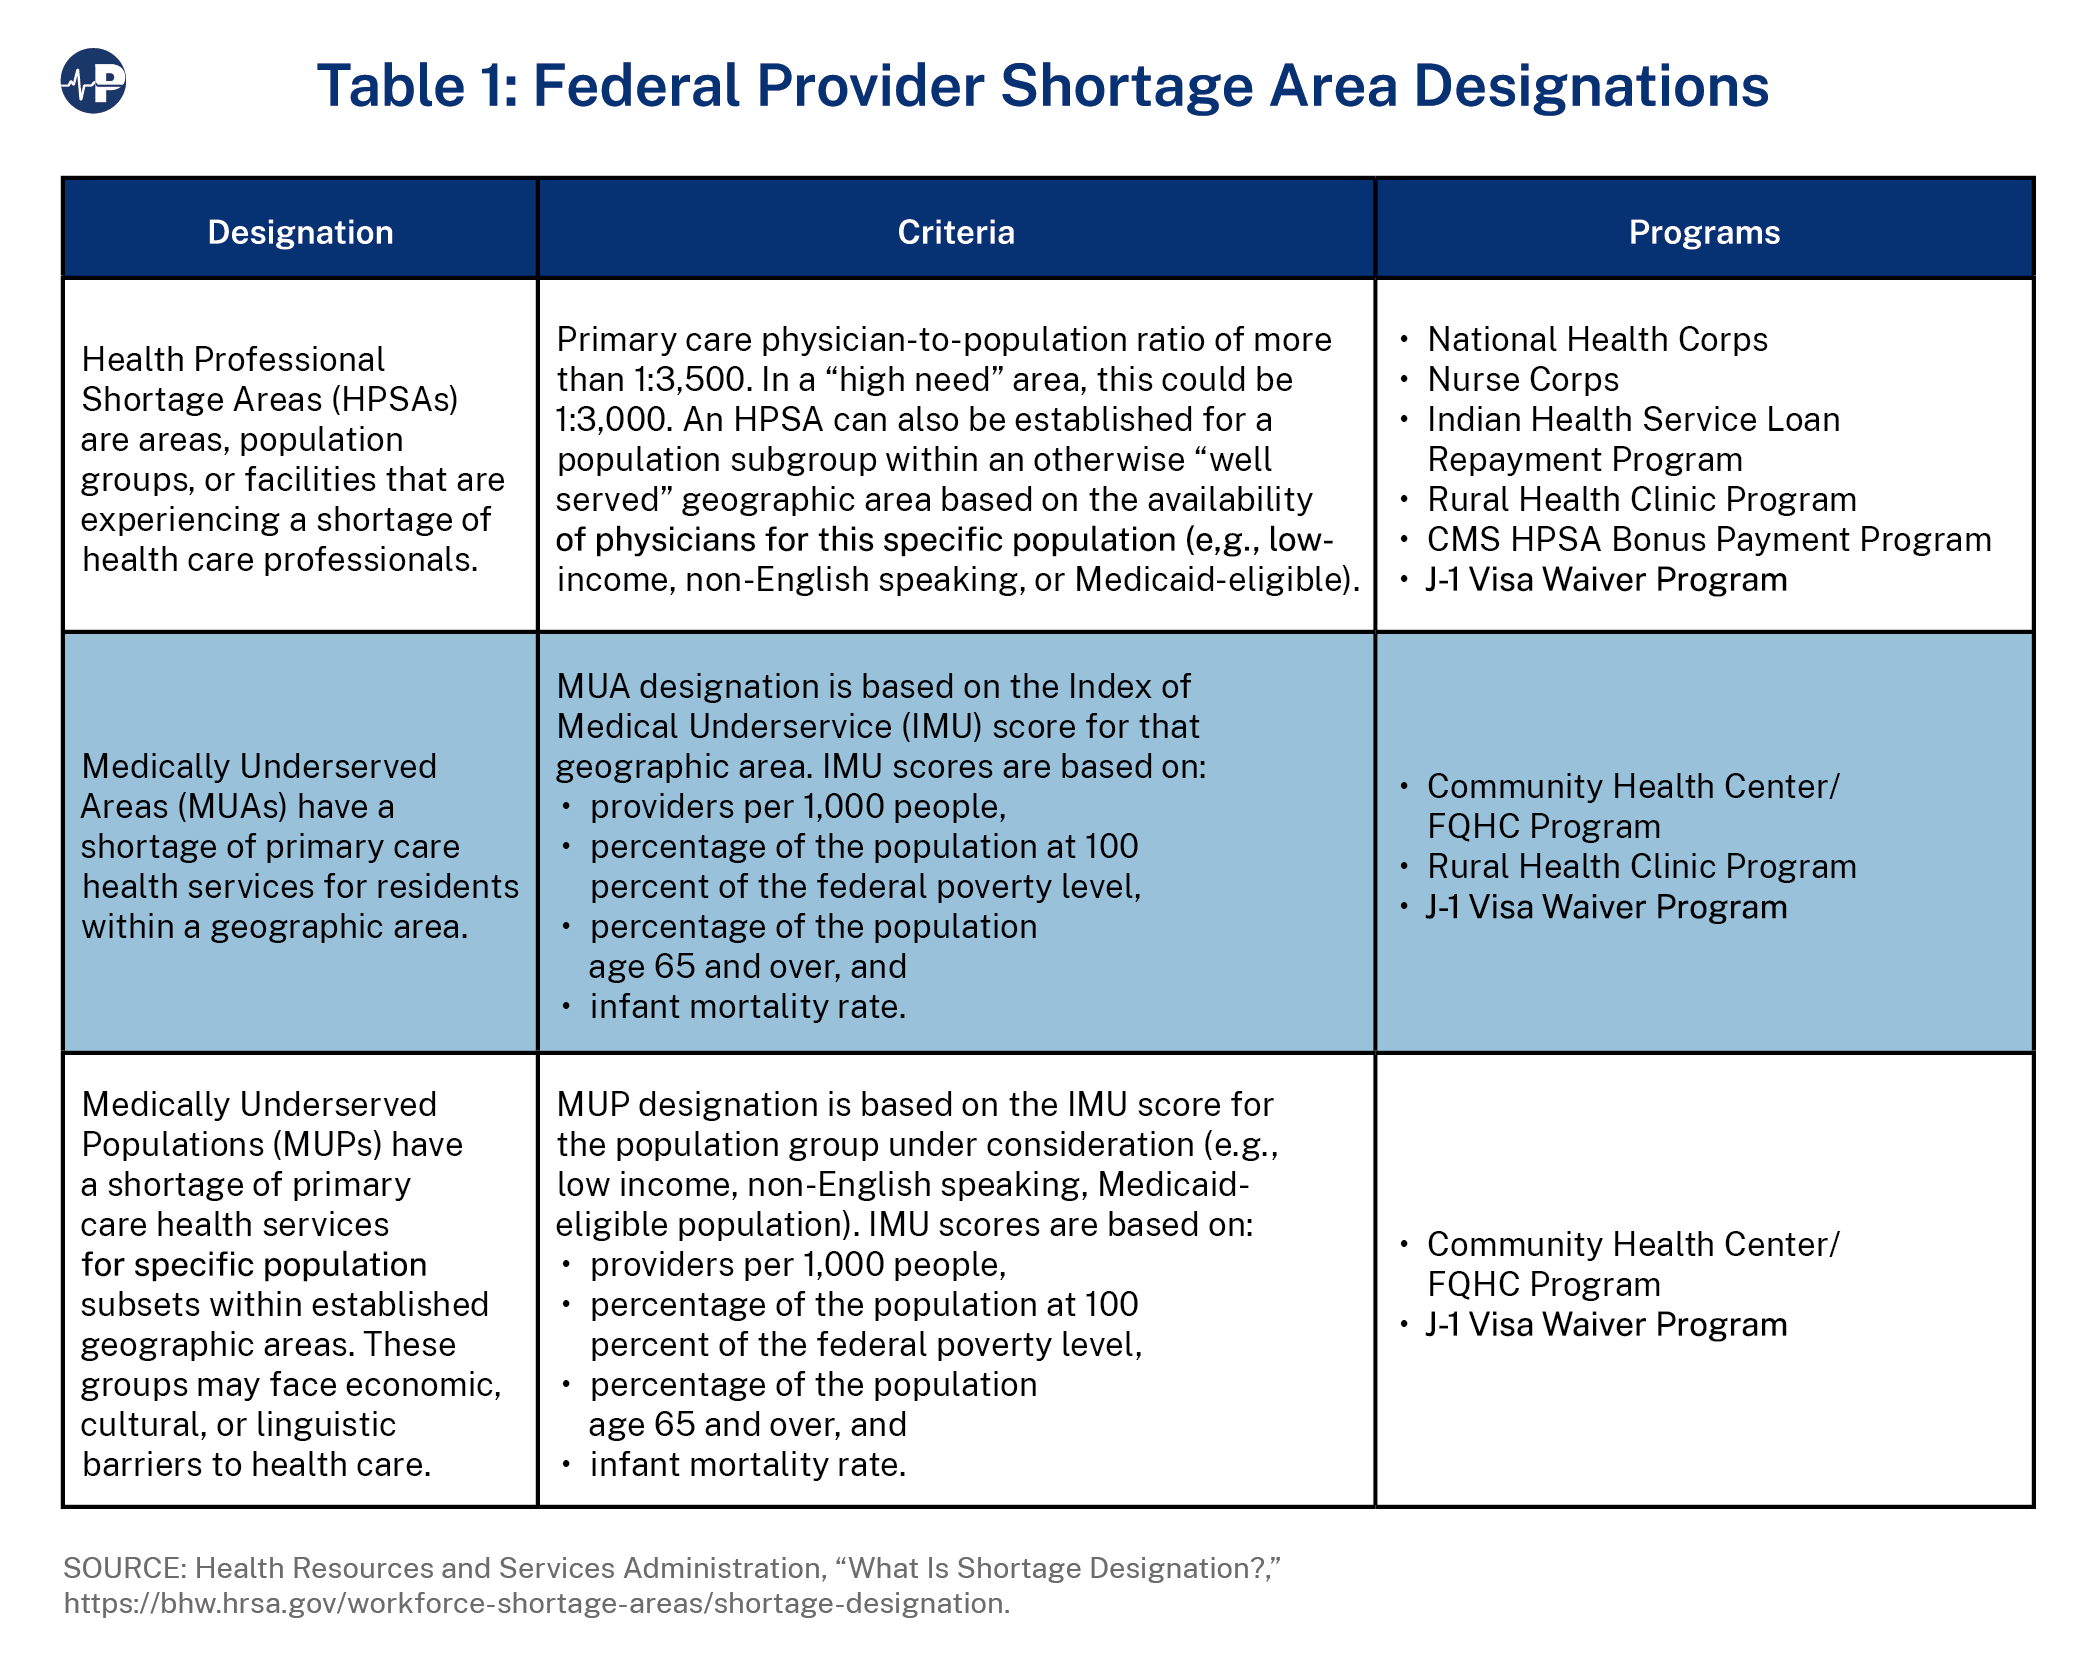
The shortage area designations used by the federal government—Health Professional Shortage Areas (HPSAs) and Medically Underserved Areas/Populations (MUA/P)—reflect the primary care workforce that was available in the mid-1970s.
In addition, thousands of communities designated by the federal government as underserved in the 1970s, 1980s and 1990s have not been re-evaluated since they were initially classified as MUA/P.
If the federal government revised the HPSA/MUA/MUP methodologies to include the primary care workforce available in 2024, thousands of communities currently designated as underserved would see their shortage area classification removed. Furthermore, if the federal government updated the designations for thousands of communities that were last reviewed more than 30 years ago, many communities would no longer be designated as underserved due to changing workforces and demographics in those communities.
Contrary to popular belief, the United States actually has more physicians per 10,000 population today than it has ever had. In addition, patients now have full benefit of the nearly 600,000 currently practicing nurse practitioners (NPs) and physician assistants/associates (PAs) in the United States.
Why It Matters
The federal government commits billions of dollars each year to support a wide range of health professionals in their educational training in exchange for those individuals agreeing to work in shortage areas upon completion of their training. In addition, billions of taxpayer dollars are spent on supporting Rural Health Clinics and Community Health Centers/Federally Qualified Health Centers in communities where they may not be needed.
This is an unnecessary expenditure of taxpayer dollars and directs resources away from communities that are truly underserved and in need of assistance.
In the 1970s, the federal government began creating programs to address reported shortages of physicians. Chief among these were the Community Health Centers (CHCs) program, the National Health Service Corps (NHSC) program, and the Rural Health Clinics (RHCs) program.
However, the methodology the federal government uses to determine whether a community or population has a shortage of primary care medical personnel has been largely unchanged since it was adopted in the 1970s. In addition, thousands of communities and populations the federal government classifies as underserved remain on the medically underserved list despite the fact that the Medically Underserved Area/Population (MUA/P) designation has not been reviewed or updated since their initial designations in the 1970s, and thousands more have not been updated in the past 30 years.
The failure to update the metrics used to determine eligibility for these programs and the underlying methodology threaten the effectiveness and efficiency of increasing access to primary care in shortage areas.
The NHSC, established in 1970 (Emergency Health Personnel Act of 1970, P.L. 91-623), initially provided scholarships to physicians and dentists in exchange for agreeing to practice in shortage areas. In subsequent years, Congress authorized other health professionals—nurse practitioners (NPs), physician assistants (PAs), psychologists, dental hygienists, and more—to receive scholarships and authorized loan repayment to pay off debt in later years as an alternative to a scholarship.
From fiscal year (FY) 2011 through FY2020, the NHSC offered more than 48,000 loan repayment agreements and scholarship awards.1 Scholarships and loans cover the costs of education (tuition, housing, fees, etc.) for recipients, who agree to serve one year in qualified Health Professional Shortage Areas (HPSAs) for each year of scholarship. Loan recipients serve a minimum of two years in HPSAs in exchange for having their loans forgiven. NHSC loan recipients can sign up for additional years as long as they have outstanding qualified debts.
The federal Community Health Centers program (42 U.S.C. §254b) was created in 1975 to provide grants to private, nonprofit medical facilities to cover the cost of providing care to underserved communities or populations. In exchange for these grants, CHCs agree to see all patients regardless of their ability to pay. In 1991, CHCs were also classified as Federally Qualified Health Centers (FQHCs), which allowed them to receive center-specific cost-based payments for care delivered to Medicare and Medicaid patients. The Medicaid cost-based payment methodology was changed to a prospective payment methodology in the 1990s, and the Medicare center-specific cost-based payment methodology was replaced by a cost-per-visit methodology as part of the Affordable Care Act (P.L. 111-148; P.L. 111-152; see Exhibit 1).
A CHC must be located in a federally recognized medically underserved area (MUA) or serve a medically underserved population (MUP), and the entity must be governed by a community board, a majority of which are patients at the CHC.
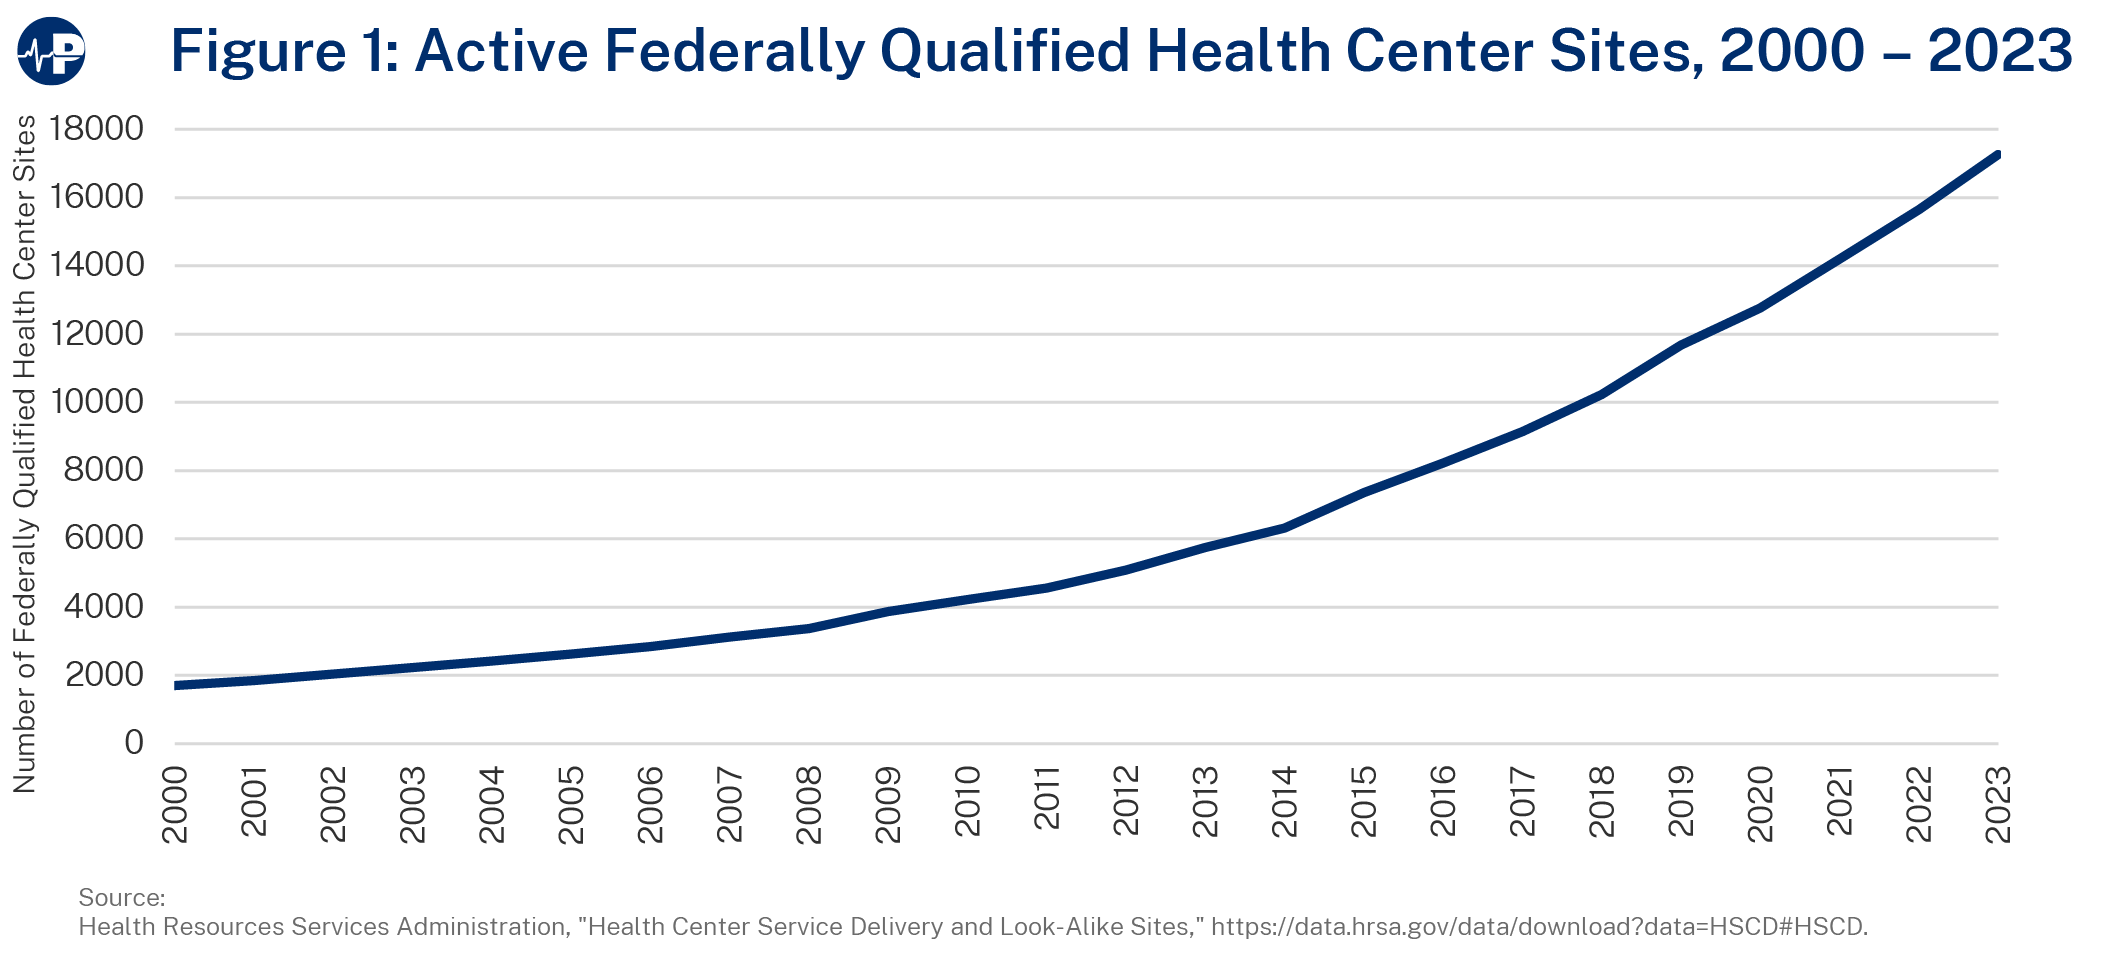
As of December 31, 2023, of the more than 17,000 FQHC sites, only 11,845 (less than 70 percent) are enrolled in Medicare. Below is a figure of FQHCs and look-alikes2 between 2000 and 2023.
The Rural Health Clinics program, established in 1977 (P.L. 95-210), certifies private medical facilities (nonprofit or for-profit) providing primary care services in rural areas designated by the federal government as underserved (HPSAs or MUAs). RHCs receive special Medicare and Medicaid payments and are required to utilize PAs, NPs, or nurse midwives in the delivery of care.
Initially, RHCs owned and operated by hospitals received uncapped cost-based reimbursement for care provided to Medicare and most Medicaid patients, whereas RHCs owned by entities other than hospitals received capped cost-based payments (the lesser of actual cost per visit or the statutory per visit cap) for care provided to Medicare and Medicaid patients. The per visit cap was set by statute. In 1995, RHCs owned by hospitals with more than 50 beds were placed under the per visit cap, and only RHCs owned by small (under 50 beds) hospitals continued to receive uncapped payments.
In 2020, Congress extended the capped cost-based payment method to all RHCs, regardless of ownership.
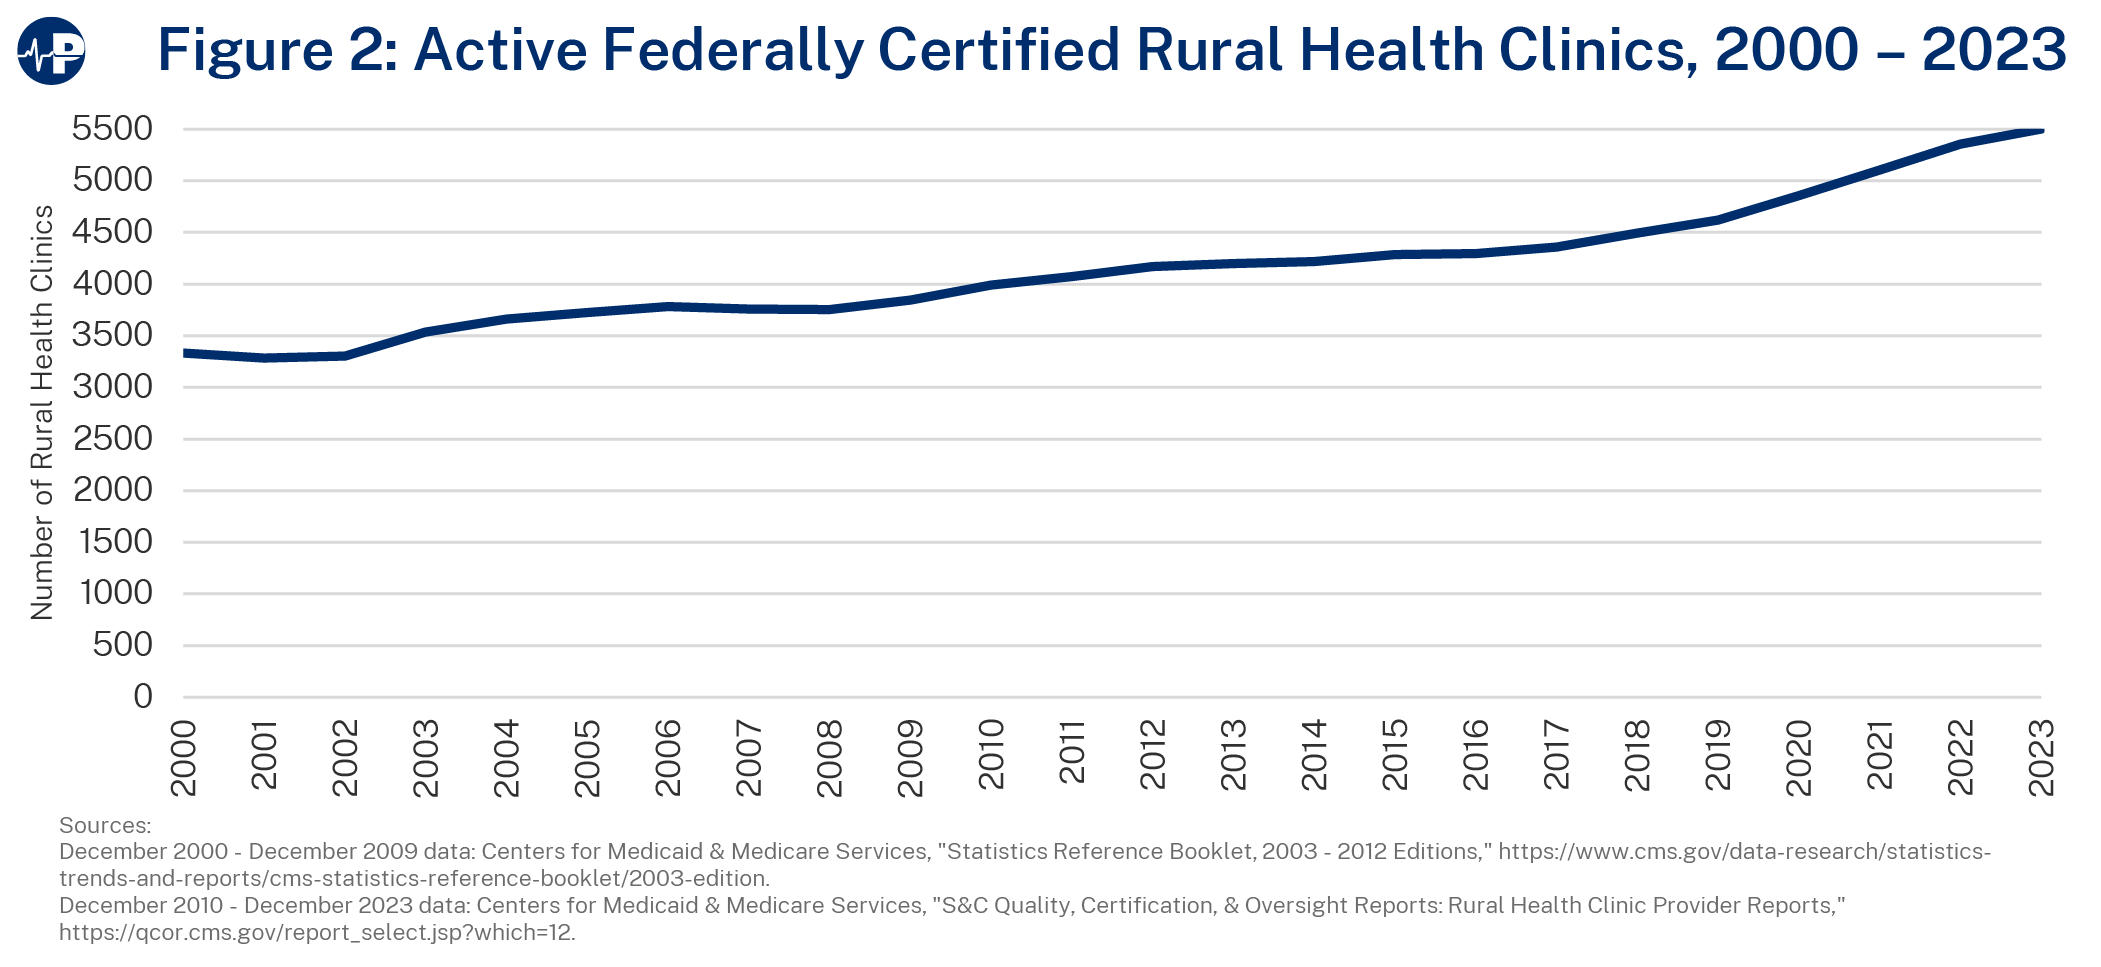
As of December 31, 2023, there were 5,503 federally certified RHCs. Unlike CHCs, RHCs do not receive any grant money to provide care to uninsured or underinsured individuals, although most RHCs report providing free or reduced cost care to low-income patients.
The Medicare, Medicaid, and SCHIP Benefits Improvement and Protection Act of 2000 (P.L. 106-554) changed RHC and FQHC Medicaid payments from cost-based to a clinic/center-specific prospective payment methodology. The clinic/center-specific rate was determined by taking the total costs of Medicaid covered services furnished by the center/clinic during FY1999 and FY2000. The total costs were then divided by the total number of all Medicaid visits during the two fiscal years.
In addition, states were authorized to develop alternative Medicaid payment methodologies for RHCs and FQHCs. However, most have opted to use the prospective payment methodology. See Medicaid and CHIP Payment and Access Commission, “Medicaid Payment Policy for Federally Qualified Health Centers,” December 2017, https://www.macpac.gov/wp-content/uploads/2017/12/Medicaid-Payment-Policy-for-Federally-Qualified-Health-Centers.pdf.
In order to properly place NHSC-obligated providers or locate CHCs or RHCs in areas of need, the federal government needed to develop a methodology for determining whether a community or population was experiencing a shortage of providers or health services and how severe that shortage was relative to other communities of need. In 1971, Congress authorized the creation of Critical Health Manpower Shortage Areas (later renamed HPSAs) and in 1975 established criteria for MUA/Ps.
HPSA designations were to place NHSC-obligated providers, whereas MUA/MUP designations were used to place CHCs. The RHC program, authorized in 1977, was authorized to use either HPSAs (geographic and population) or MUAs (but not MUPs) to place RHCs.
By law, the Department of Health and Human Services (HHS) must annually review and, as necessary, revise designations for HPSAs.3 However, there is no requirement that MUAs/MUPs be updated.
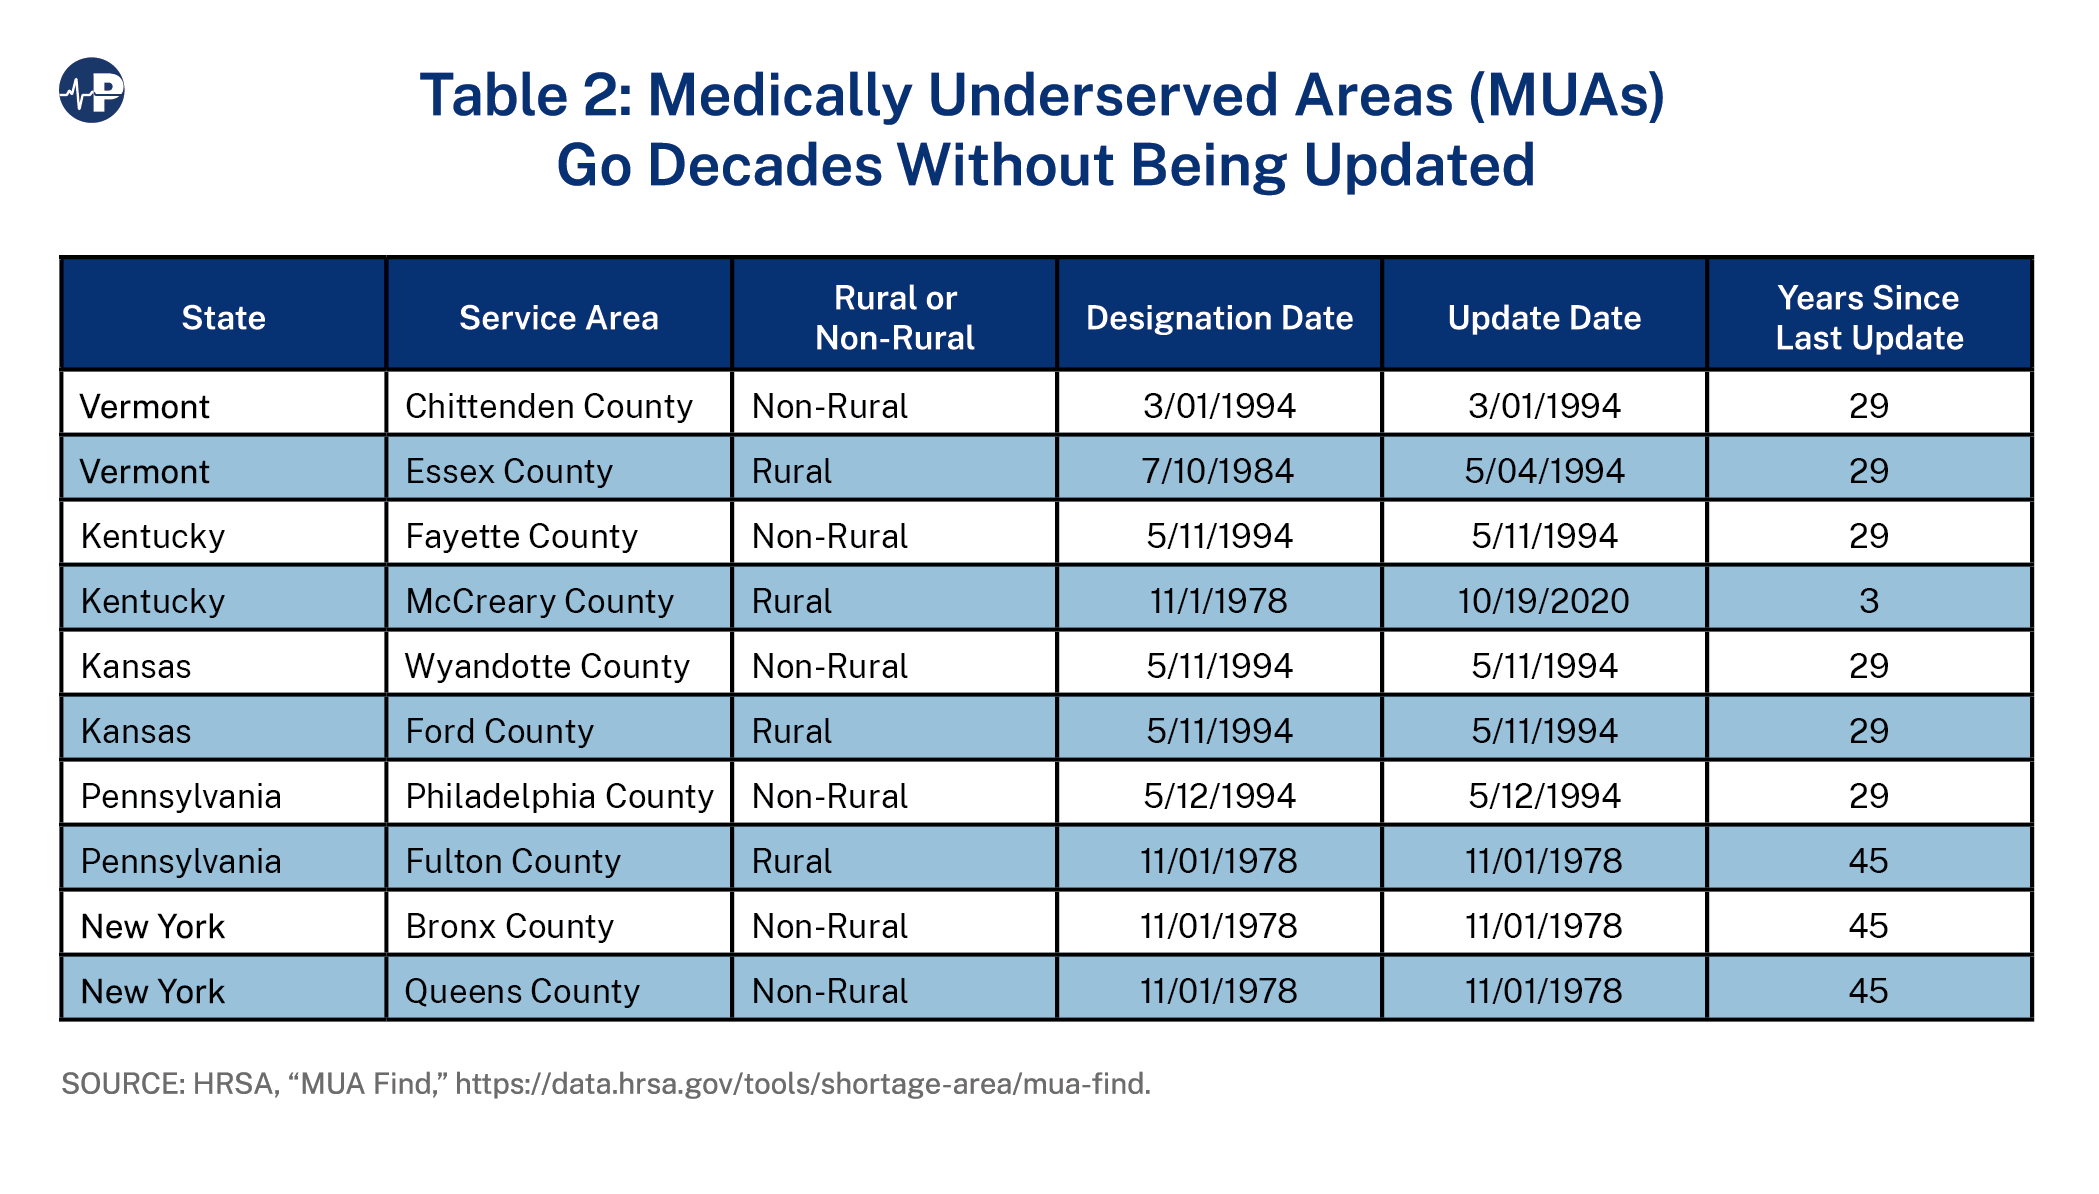
Thousands of MUAs/MUPs continue to be listed as shortage areas based on designations that were reviewed only within the past several decades. Based on the Health Resources and Services Administration (HRSA) MUA look-up tool,4 the last significant updating of MUAs/MUPs appears to have occurred in the mid-1990s (Table 2). However, it is clear that this did not involve all MUAs/MUPs, as many have not been reviewed since their creation in the 1970s and 1980s. In a 1995 report, the Government Accountability Office cited this failure to regularly update the MUA/MUP list as a major deficiency.5 The report states that HHS officials said that the department “no longer reviews the list of MUAs to decide whether any should be dedesignated.”
Some states have voluntarily updated their MUA/MUP designations, but most have not.
Below is a sampling of rural and non-rural MUA designations in five states indicating when the designations were originally approved and when they last updated.
As long as an area remains on the MUA/MUP list, CHCs serving those communities remain eligible for CHC grant money, and RHCs in those communities maintain RHC status. Should an area lose their MUA/MUP designation, the CHC would no longer be eligible to receive grant money. RHCs have, since the inception of the program, been allowed to remain RHCs despite the loss of the shortage area designation (MUA or HPSA). It is believed this grandfather clause was included to prevent a “yo-yo effect” of clinics going on the RHC list and coming off it multiple times.
The “yo-yo effect” occurs when a community is successful at bringing a health care provider into the community by virtue of a federal program (such as NHSC, RHC or CHC) based on a shortage designation, only to lose the ability to continue to participate in that program by virtue of its success. Absent this grandfather provision, an RHC physician could alter the physician-to-population ratio such that the area was no longer an HPSA, thus terminating eligibility for RHC designation. The clinic would likely close, once again pushing the community back into a shortage but re-establishing their eligibility for an RHC.
Despite dramatic changes in the health care workforce in the United States over the past 50 years, primary care HPSA designations—and, to a lesser extent, MUA/MUP designations—continue to rely upon the primary-care-physician-to-population ratio of a community to determine whether a shortage exists.6
When the shortage area designations were established in the 1970s, there were far fewer PAs and NPs than there are today, they were not authorized to practice in many states, and their respective scopes of practice tended to be very limited. Thus, it made sense at that time to exclude them from the provider-to-population calculation.
Moreover, when evaluating whether a shortage exists, the analysis excludes “federal physicians; physicians with NHSC or J-1 visa waiver obligations; or physicians engaged solely in administration, research, or teaching.”7
The number of providers in the United States (both primary care and specialty) has grown far faster than the U.S. population has over the past 50 years.
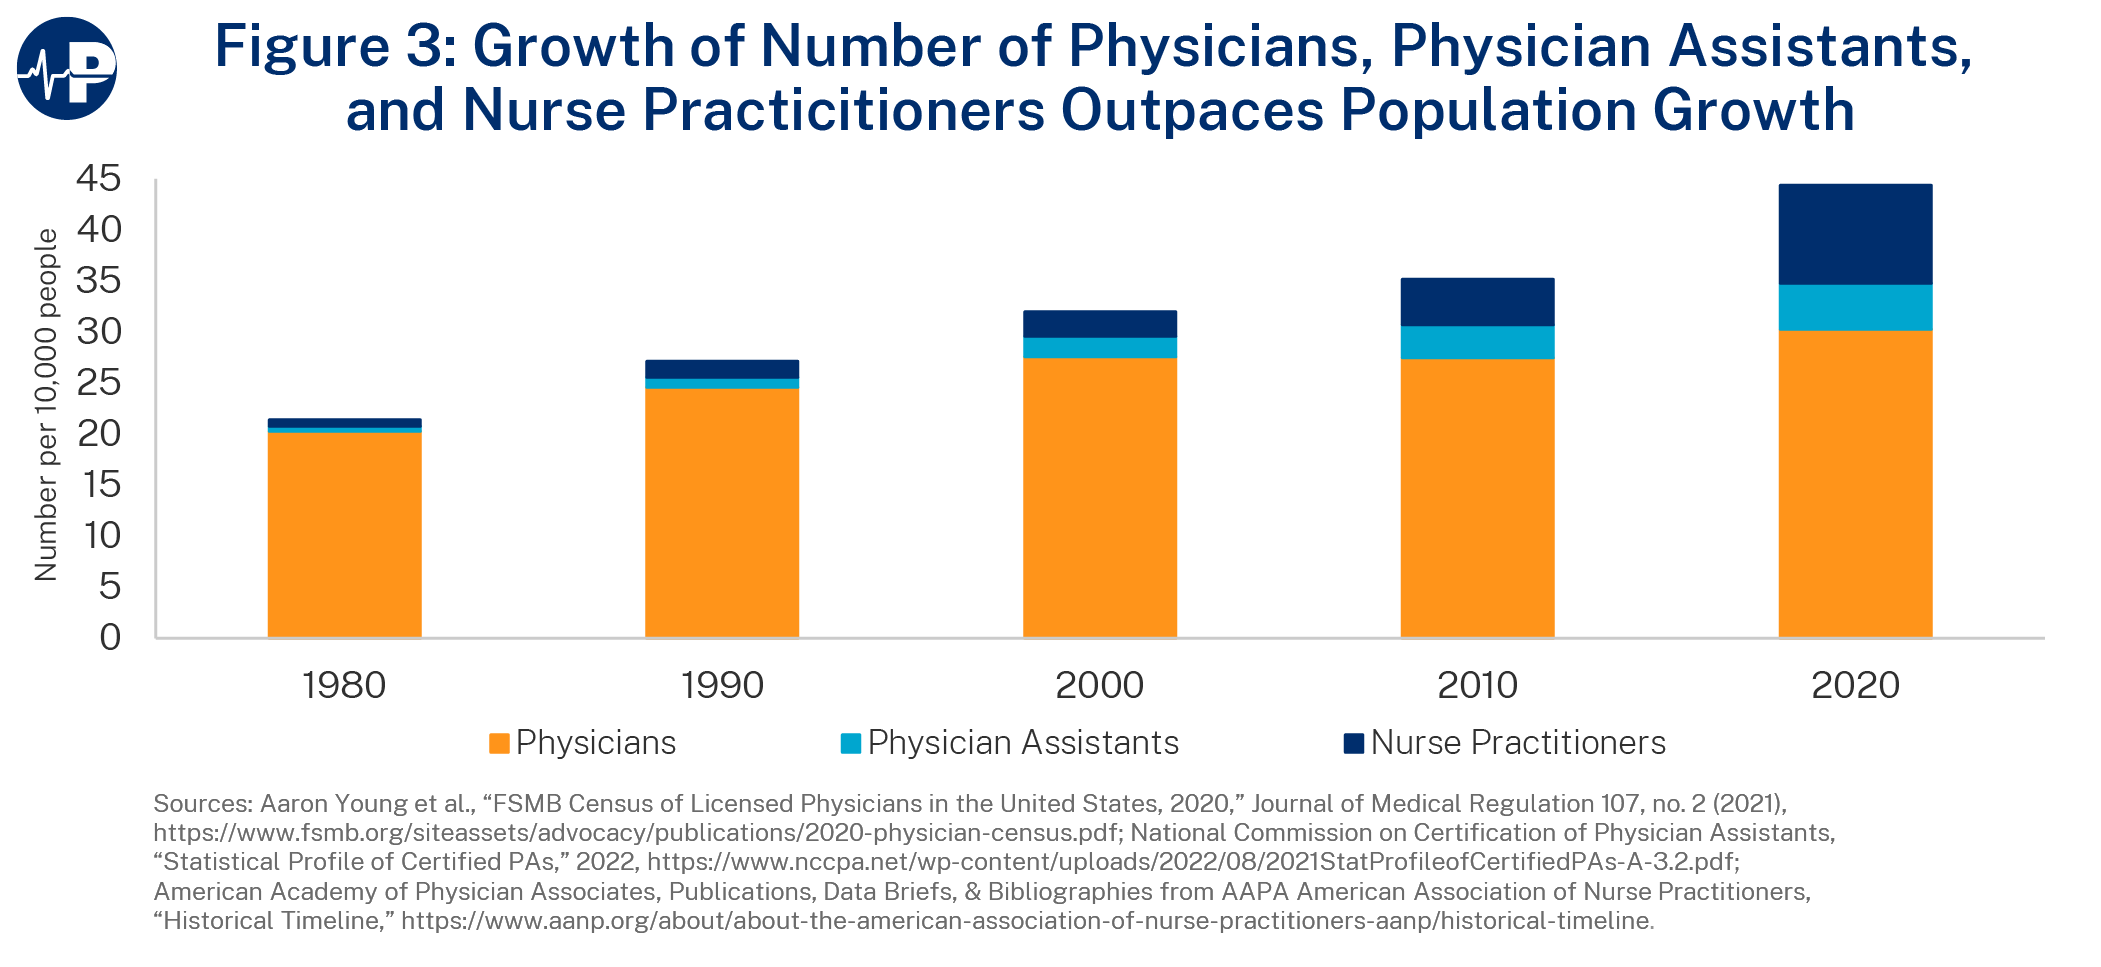
When the numbers of physicians, PAs, and NPs practicing in the United States are combined, the nation has the highest number of diagnostic/treatment professionals in its history both in terms of absolute numbers as well as when calculated on a “per 10,000 population” basis.
The growth in the number of health professionals has far exceeded the growth of the U.S. population. Between 1980 and 2020, the U.S. population grew by 31 percent.8
Meanwhile, the number of physicians in the United States, over that same period, has more than doubled, and the ratio of physicians has gone from 20.3 per 10,000 population to 30.3 per 10,000 population.
There are also nearly 600,000 PAs and NPs available to provide care that was previously the exclusive purview of physicians. Unlike in the 1970s, PAs and NPs can practice in all 50 states; their services are covered by Medicare, Medicaid, and most commercial insurers; their scope of practice has dramatically expanded, with all states authorizing either independent practice or remote practice from the supervising or collaborating physician; and all states include prescriptive authority for PAs and NPs within their respective scopes of practice.
These professions were barely a blip on the health professions radar screen 40 years ago (0.66 NPs and 0.48 PAs per 10,000 population). A study in The BMJ found that in 2019, NPs or PAs accounted for a quarter of all healthcare visits in the United States.9
In 1998, 2008, and 2011, HRSA sought to update and modernize the shortage area designation process. The 1998 and 2008 modernization attempts were done via a notice of proposed rulemaking (NPRM).10 In each of these instances, HRSA withdrew the proposed rules after receiving hundreds of overwhelmingly negative comments from individuals and stakeholders. The primary concern was that significant numbers of areas would lose their shortage designations if the methodologies were updated. For most stakeholder groups, this would mean their continued participation in the NHSC, CHC, and potentially RHC programs could be terminated.
According to a 1998 HRSA study, if the HPSA/MUA/MUP lists were simply updated (i.e., using the data and methodology available in 1998), 300 counties and 8 million persons would no longer be in shortage areas. Furthermore, HRSA determined that 23 percent of existing MUAs would lose their designations, while 9 percent of HPSAs would lose designation.
Finally, the analysis noted that the relevant conditions in some of these MUAs had improved.
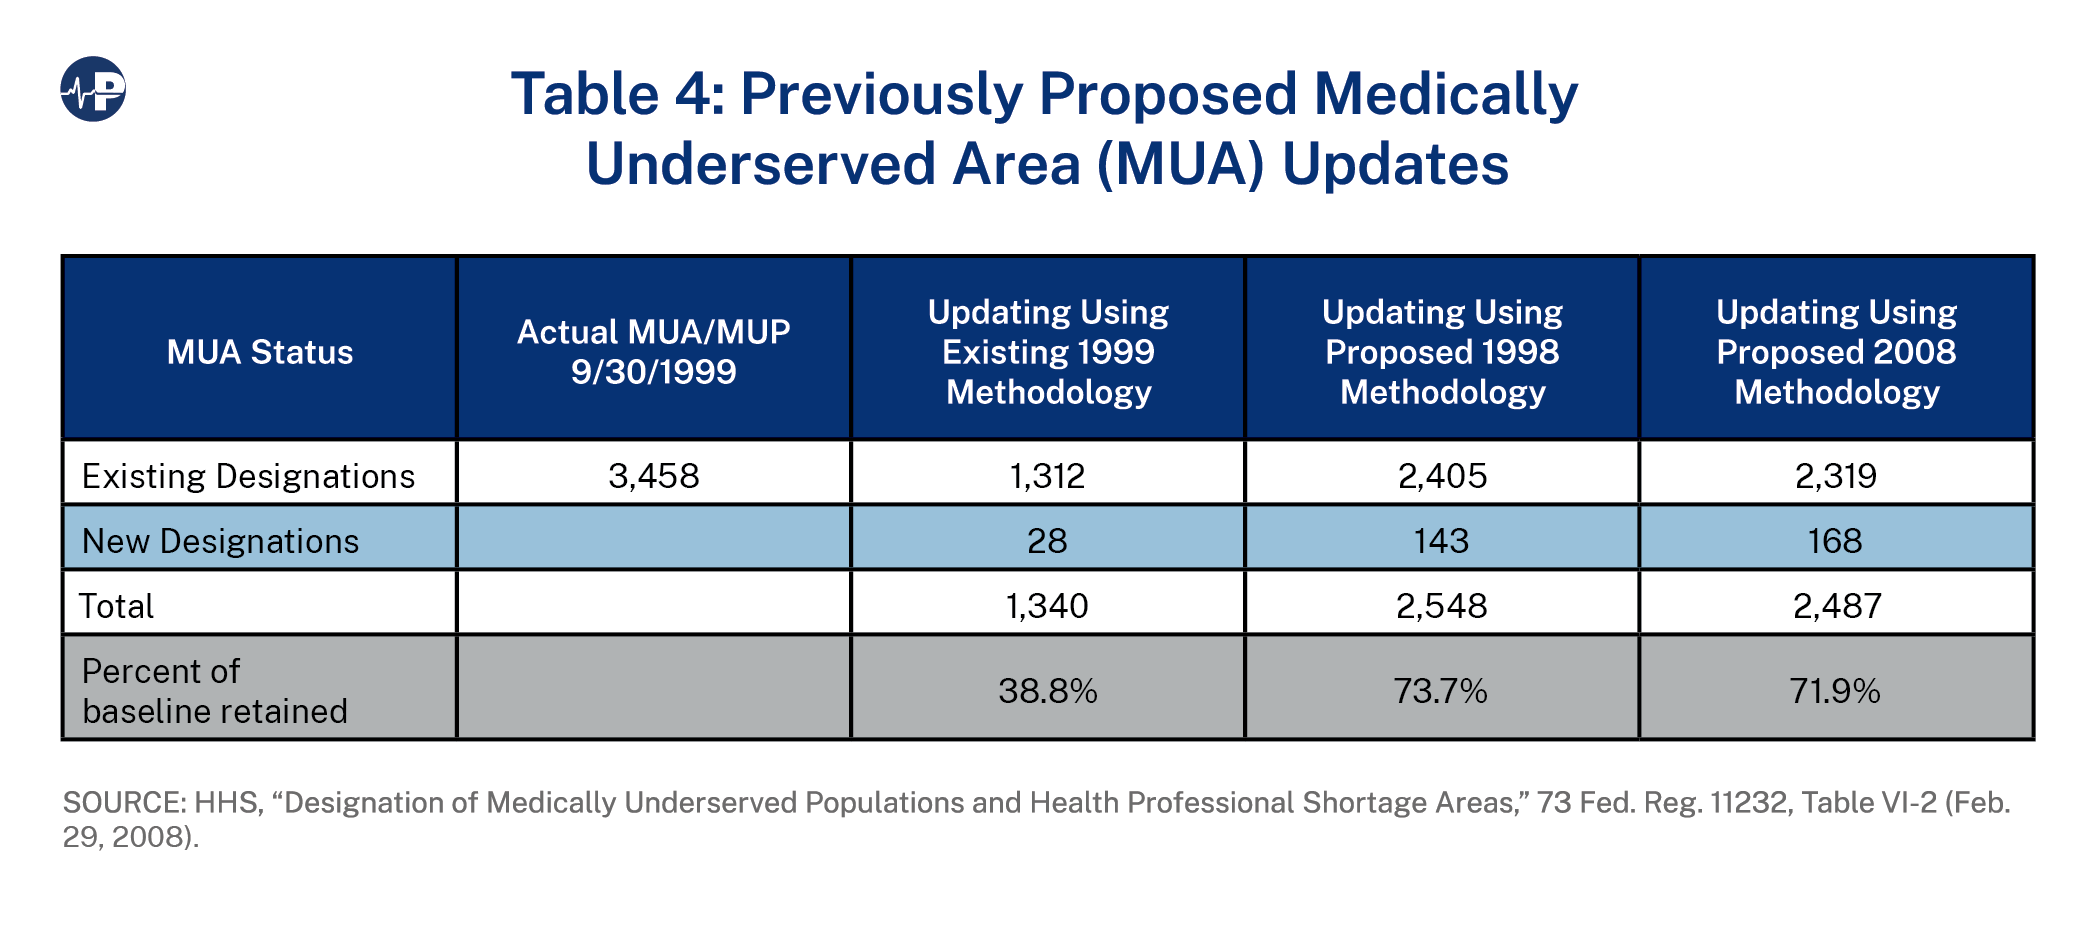
By 2008, the impact of simply updating the MUA/MUP shortage area lists using the existing criteria was even more dramatic. HRSA determined that only 1,312 out of 3,458 (38 percent) of the areas or populations would retain their MUA/P designations. However, 28 additional counties would be newly designated. Another way to look at this is that without any updating, there were an estimated 95 million people living in MUAs/MUPs, but after updating, there would be an estimated 32 million people living in MUAs/MUPs.
In 2011, in response to a mandate in the Affordable Care Act, HRSA once again sought to update and reform the shortage area designation methodology, but this time, instead of using the traditional NPRM process, it used a negotiated rulemaking (NRMC) process.11 Unlike the two NPRMs, the NRMC did not include any analysis of the impact of simply updating the HPSA/MUA/MUP methodology.
Under the NRMC mechanism, the agency appoints a negotiated rulemaking committee (NRC) primarily made up of stakeholder organizations that have an interest in the shortage area designation process. The NRC attempts to reach consensus on reforms that are then presented to the HHS secretary for consideration. If the secretary agrees with the recommendations of the NRC, the Secretary will publish them as an interim final rule. Notably, stakeholder organizations on the NRC must agree that they will not comment negatively on the interim final rule.
It is notable that under the stakeholder-driven NRMC process, most existing designations would have been retained, and millions of people would have been newly determined to be in shortage areas. For example, at the time of the NRC’s deliberations, 33.4 million people resided in HPSAs. Under the NRC’s proposed methodology, hundreds of communities with an estimated population of 12 million people would have lost their designations, although others with a population of 20.5 million people would have been newly eligible for HPSA designation. As a result, there would have been a net increase in the number of people residing in HPSAs of 8.5 million.
Similarly, for MUAs/MUPs, 71 million people were living in areas designated as MUAs in 2011, 16 million resided in communities that would have lost their designations, but 48 million people resided in areas that would have been newly eligible, so there would have been a net increase in the population residing in underserved areas of 32 million people.
Nothing came of the work of the NRMC, however, as HHS Secretary Kathleen Sebelius chose not to act on the NRMC recommendations.
While each of the proposed revisions (1998, 2008, and 2011) took very different approaches on how best to modernize the shortage area designation methodologies, one consistent feature was the inclusion of PAs and NPs in the provider-to-population ratios.
The following numbers are taken from impact analysis charts produced by HRSA as part of the 2008 NPRM process. They show the impact on the number of HPSAs and MUAs by simply updating or applying the proposed methodologies put forward in 1998 and 2008. The baseline for these charts is 1999.
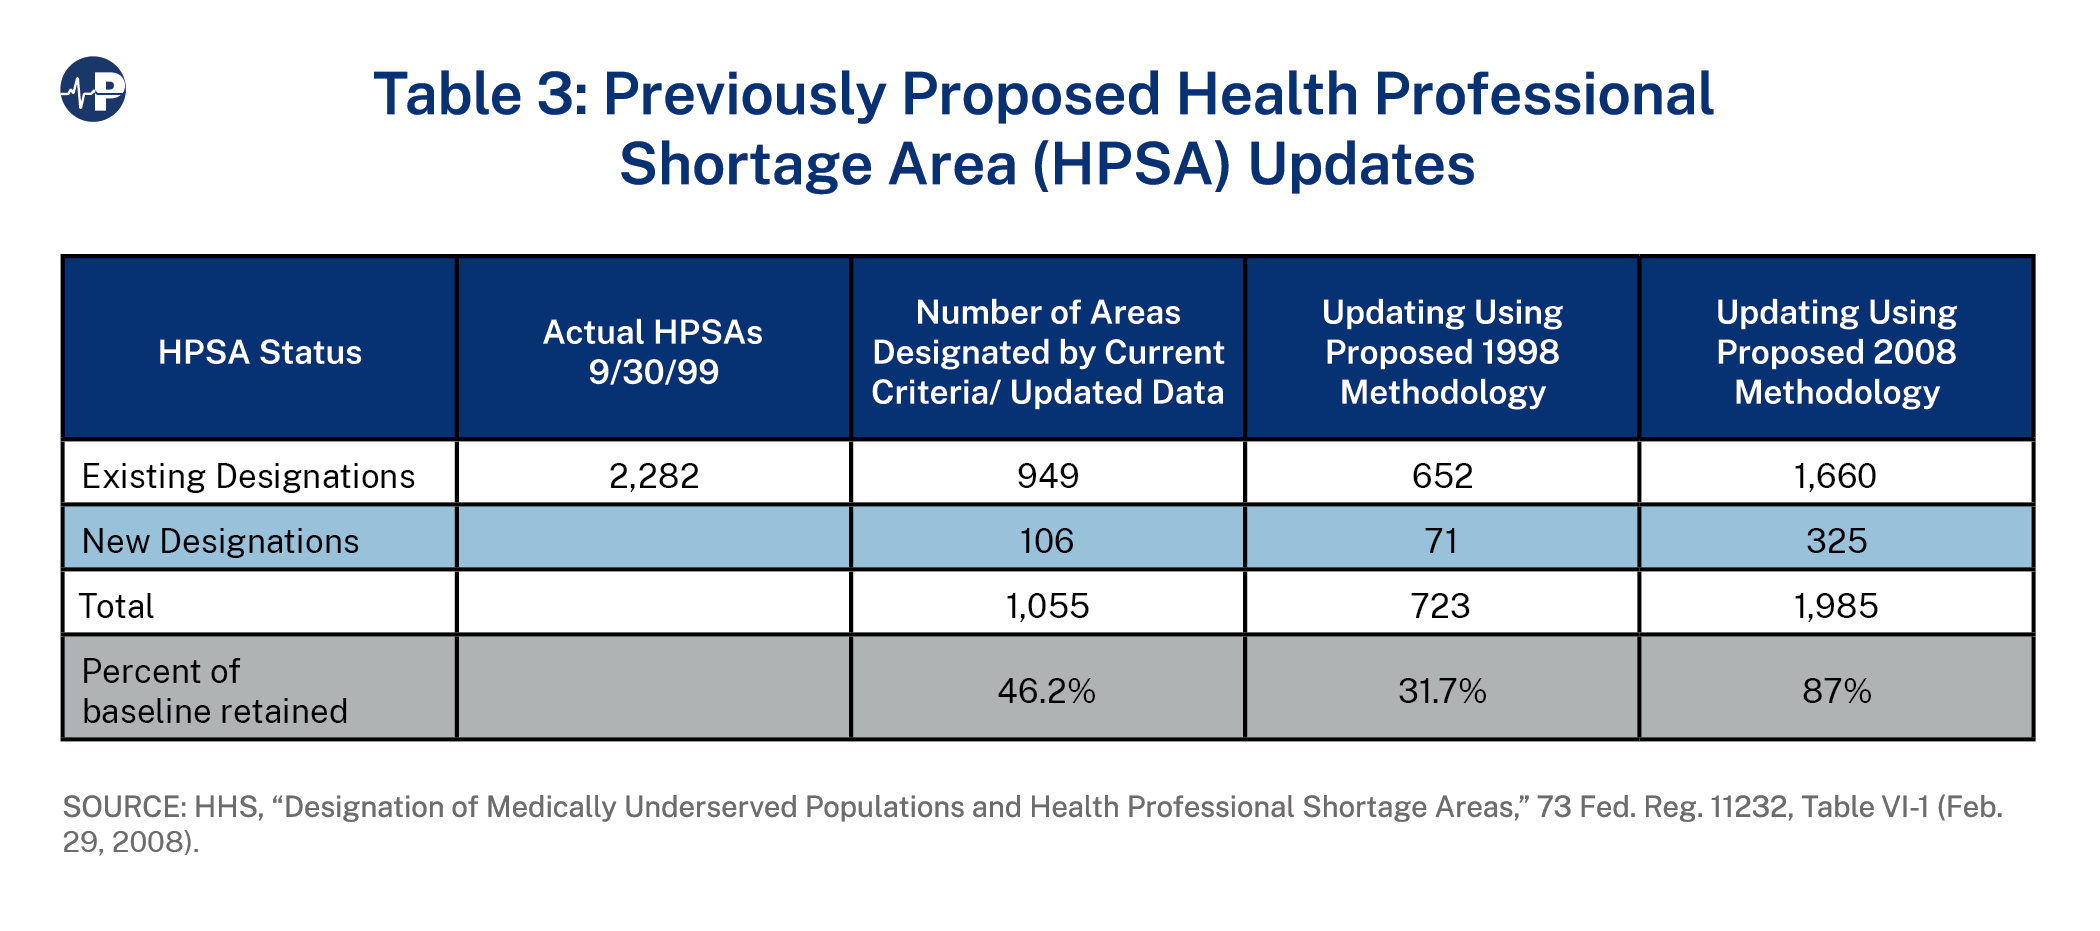
Because neither the proposed rules nor the NRC recommendations were adopted, only physicians continue to be considered when determining whether an area or population is underserved, and the federal government continues to list thousands of communities as “underserved” when they are no longer experiencing a shortage.
The failure to update and modernize the shortage area designation methodology and process has directed resources (money and workforce) to areas and populations where they are less in need and resulted in the expenditure of billions of dollars in communities that likely did not need that money to ensure the availability of primary care.
In addition, the programs that address the shortages are unable to demonstrate their contributions to eliminating access challenges as the shortage area numbers rarely decrease.
It is therefore reasonable to ask: Are NHSC primary care providers still necessary, and if so, where? Are CHCs still necessary, and if so, where? Are RHCs still necessary, and if so, where?
In a country as vast as the United States, with widely disparate locations that have dramatically different care needs, there will always be interest from policymakers in maintaining access to care in remote areas and areas that are least attractive to health providers. The programs mentioned in this paper have long been part of the institutional fabric of the American health care system, but a failure to update even the most fundamental criteria to reflect changes in workforce over the past 50 years makes them much less targeted and effective.
As the data from the 1998 and 2008 NPRMs demonstrate, the failure to update the MUA/MUP list has resulted in thousands of communities and millions of people being identified as “underserved” when this is no longer the case. The federal government had previously mandated the periodic updating of all HPSAs. Updating MUAs/MUPs on the same time frame as HPSAs is necessary to prevent the MUA/MUP lists from becoming outdated in future years.
It makes no sense to continue to exclude NPs and PAs from the provider-to-population ratio calculations. With nearly 600,000 PAs and NPs practicing in the United States and more than 600 NP or PA programs, their numbers are only going to increase. It is highly likely that within a few years, there will be more NPs and PAs combined in the United States than physicians—something that would have seemed impossible when the HPSA/MUA methodologies were adopted in the 1970s.
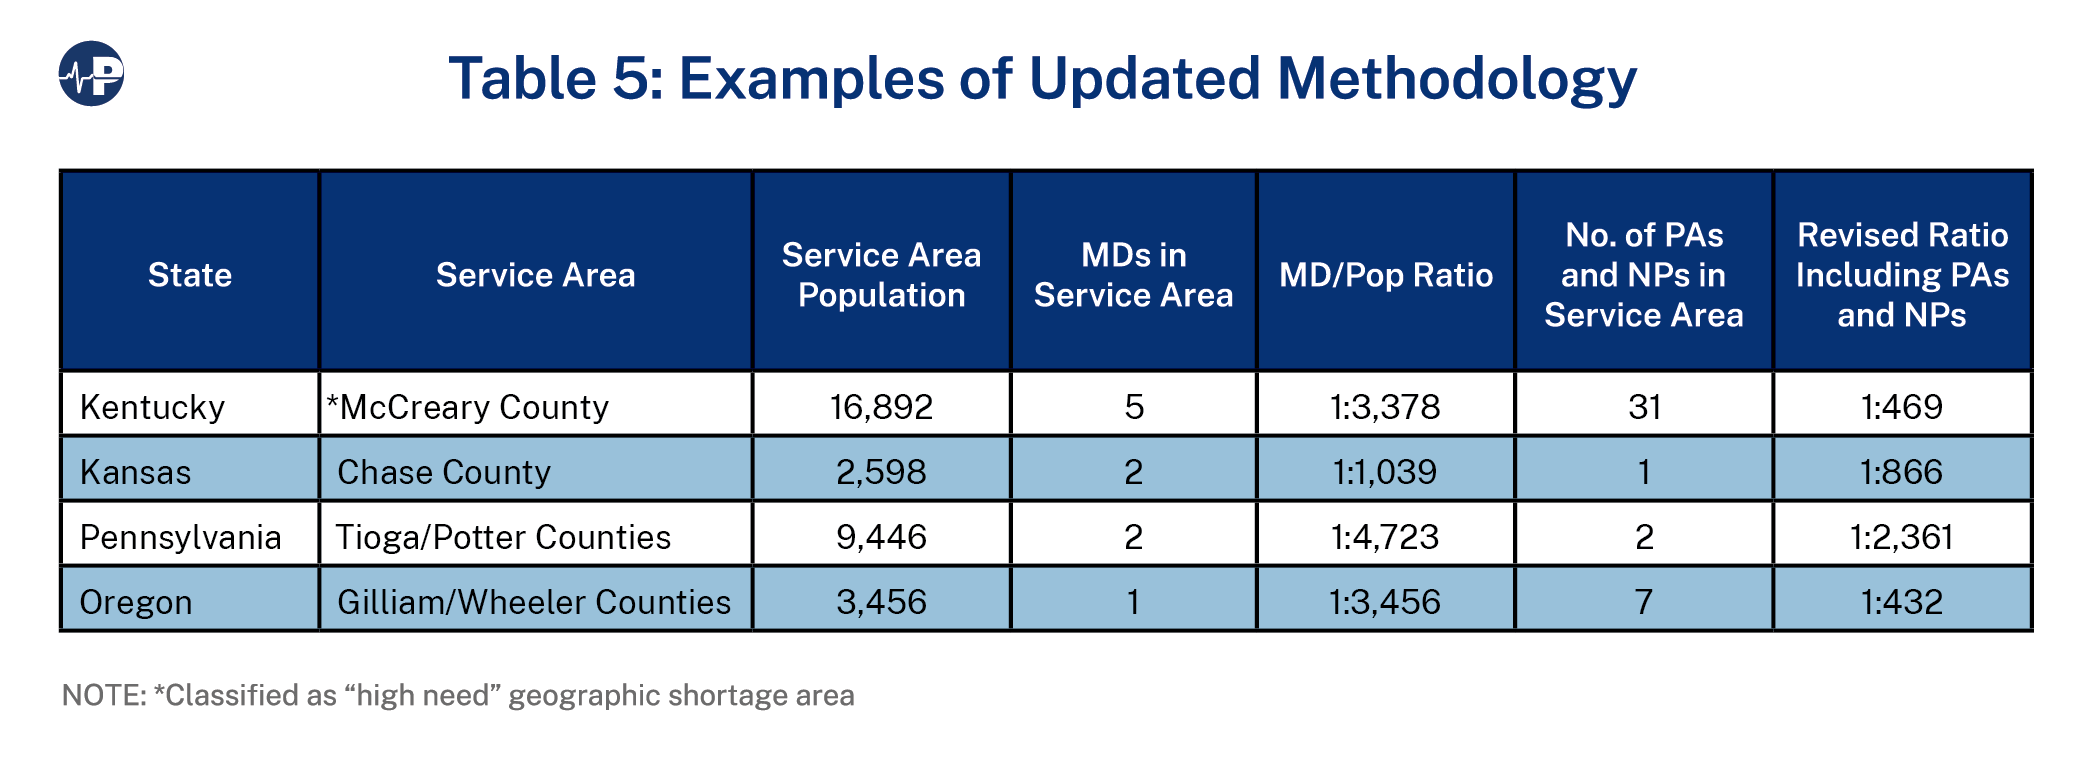
Although a nationwide analysis of the impact of including NPs and PAs in the HPSA or MUA calculations is unavailable, some examples of how it might impact some communities in different regions of the country are displayed in Chart 6.
For example, according to HRSA, the western area of Tioga County and the eastern area of Potter County (referred to as the Westfield Service Area) in Pennsylvania constitutes a Rational Service Area.
A Rational Service Area is:
According to the CMS National Plan and Provider Enumeration System12 directory, there are two family medicine physicians serving the Tioga/Potter County Service Area, which has a combined population of approximately 9,446. This produces a physician-to-population ratio of 1:4,723. One of these physicians works at an FQHC in Westfield, and the other works at an RHC in Westfield. Because the ratio is above 1:3,500, the area would continue to qualify as a geographic HPSA.
The National Plan and Provider Enumeration System (NPPES) is the mechanism by which the Centers for Medicare and Medicaid Services assigns a National Provider Identifier to any health professional or organization that does or may submit a claim for services to Medicare or Medicaid and most commercial insurers. Although the NPPES directory is not an infallible source of provider workforce in a particular region, in these rural communities, it would be highly unlikely that a provider would be available to see patients without enrolling in Medicare—something that must occur if the provider wishes to submit claims to Medicare, Medicaid, or most commercial insurers.
There is also one full-time PA and one part-time NP at the FQHC in Westfield and a part-time PA at the RHC in Westfield.
As displayed in Table 5, if the Tioga/Potter ratio is rerun including these three individuals (two full-time equivalents), the revised ratio for the Tioga/Potter County HPSA would be 1:2,361, and it would no longer be on the HPSA shortage area list.
There is also a designated MUA in this part of Tioga/Potter Counties. The Deerfield Service Area MUA designation was used to approve the FQHC in Westfield. The Deerfield MUA was established in May 1994 and has not been updated since it was established 40 years ago.
The Index of Medical Underservice (IMU) score for the Deerfield Service Area is listed as 59.7, just below the minimum threshold for MUA designation of 62. Because the physician-to-population ratio used to calculate the IMU is based only on physicians, it appears quite likely that by including the RHC and the two full-time equivalents (PA and NP), the IMU score would rise above the 62-point threshold, resulting in loss of the MUA for Deerfield.
This scenario is a perfect example of the yo-yo effect mentioned earlier. A much-needed FQHC and RHC in this area would result in the area losing its shortage area designations and potentially these facilities. However, by using the second calculation excluding the physicians and PAs working in the RHC or FQHC, the area would still be a shortage area and thus qualify for the “special need” MUA/HPSA mentioned below.
As noted, it may make sense for policymakers to preserve HPSA/MUA designations in certain areas to prevent the yo-yo effect.
Rather than attempt to change the criteria for participation in these programs, HRSA should establish a Special Need MUA/HPSA.
As part of the updating/review process, HRSA would do the initial provider-to-population review as is done currently (but with PAs and NPs now added to the mix). Then, for all those communities that would lose their designations, HRSA would conduct a second calculation but this time remove any physicians, PAs, or NPs who were in that service area as a result of the NHSC, RHC, or CHC programs.
If, after this second review, a community were still no longer underserved, it would be de-designated as such, and participation in any programs would be subject to the criteria of those programs.
If, however, after the second review, a community would have been underserved, the service area would be classified as “Special Need MUA/HPSA.” Those facilities and professionals in that service area that rely on an MUA/HPSA designation as a condition of participation would continue to be eligible based on the Special Need MUA/HPSA designation. This would address the yo-yo effect.
Applying the proposed special needs calculation for the Tioga/Potter service area would classify the area as a Special Needs HPSA/MUA, because all of the providers in this service area are there because of either the RHC program or the FQHC program. The facilities would maintain their status, but no new RHCs or FQHCs would be established in this area, and the NHSC would not seek to place obligated service providers in this service area.
Updating and reforming the methodologies the federal government uses to designate areas as MUAs or HPSAs is long overdue. The reforms recommended in this paper are simple, straightforward, and relatively easy to implement.
To be sure, some stakeholders who are fundamentally opposed to any change in the status quo would be vocal in their opposition to these modest recommendations. But policymakers should do a better job of identifying need to ensure that resources are directed to populations and areas that are truly MUAs, MUPs, or HPSAs (geographic or population).
Bill Finerfrock
Prior to his retirement in 2022, Mr. Finerfrock worked in and with the U.S. Congress and federal agencies on health policy matters for more than 45 years.
Finerfrock is the Co-founder of the National Association of Rural Health Clinics (NARHC) a non-profit organization representing the interests of federally certified Rural Health Clinics and the patients they serve. He served as NARHC’s Executive Director from its inception in 1991 until his retirement in 2022. He currently serves on the Board of Directors of the NARHC Research and Education Foundation.
From January1, 2014 until July 2022, Finerfrock was also the owner of Capitol Associates, a government relations and health policy consulting firm based in Alexandria, Virginia. Prior to taking ownership of the company, he was a senior vice president of the firm, specializing in rural health, health workforce and Medicare and Medicaid payment policy.
Finerfrock is also on the Board of Directors of Movement Is Life (MiL), a non-profit multi-disciplinary organization seeking to eliminate health disparities among women in muscle and joint health, due to race, ethnicity gender, or geography.
In his spare time, Finerfrock serves as the Springfield Representative and Vice Chair of the Fairfax County Healthcare Advisory Board.
Finerfrock is a 1977 graduate of Penn State University. He has a degree in Political Science.