


Introduction
Medicare’s rapidly rising costs present a significant public policy problem. Without reforms to put it on a more sustainable trajectory soon, significant benefit cuts or tax increases will be necessary. It is vital that policymakers understand the reality of Medicare’s financing structure and fiscal challenges.
Background
Medicare is a federal entitlement program that pays for health care services for about 65 million elderly and disabled Americans. Medicare is divided into four parts:
- Part A covers hospital, post-acute care benefits, and nursing home care;
- Part B covers other medical benefits like outpatient and physician care;
- Part C, or Medicare Advantage, administers Part A/B/D benefits via insurance plans; and
- Part D administers prescription drug benefits, also through insurance plans.
All Medicare benefits, including those covered in Part C, are paid out of two so-called trust funds:
- The Hospital Insurance (HI) Trust Fund finances Part A benefits and is funded primarily by payroll taxes, which typically comprise about 85 to 92 percent of the trust fund’s income.1 From 1970 to 2022, the share of total Medicare spending paid from the HI Trust Fund fell from 70 to 38 percent.
- The Supplemental Medical Insurance (SMI) Trust Fund finances Part B and Part D Rather than payroll taxes, its primary income sources are beneficiary premiums for these services and general tax revenue. Between 1970 and 2022, premiums have gone from 50 percent of SMI Trust Fund expenditures to 26 percent. Meanwhile, general tax revenue has risen from 49 to 75 percent.
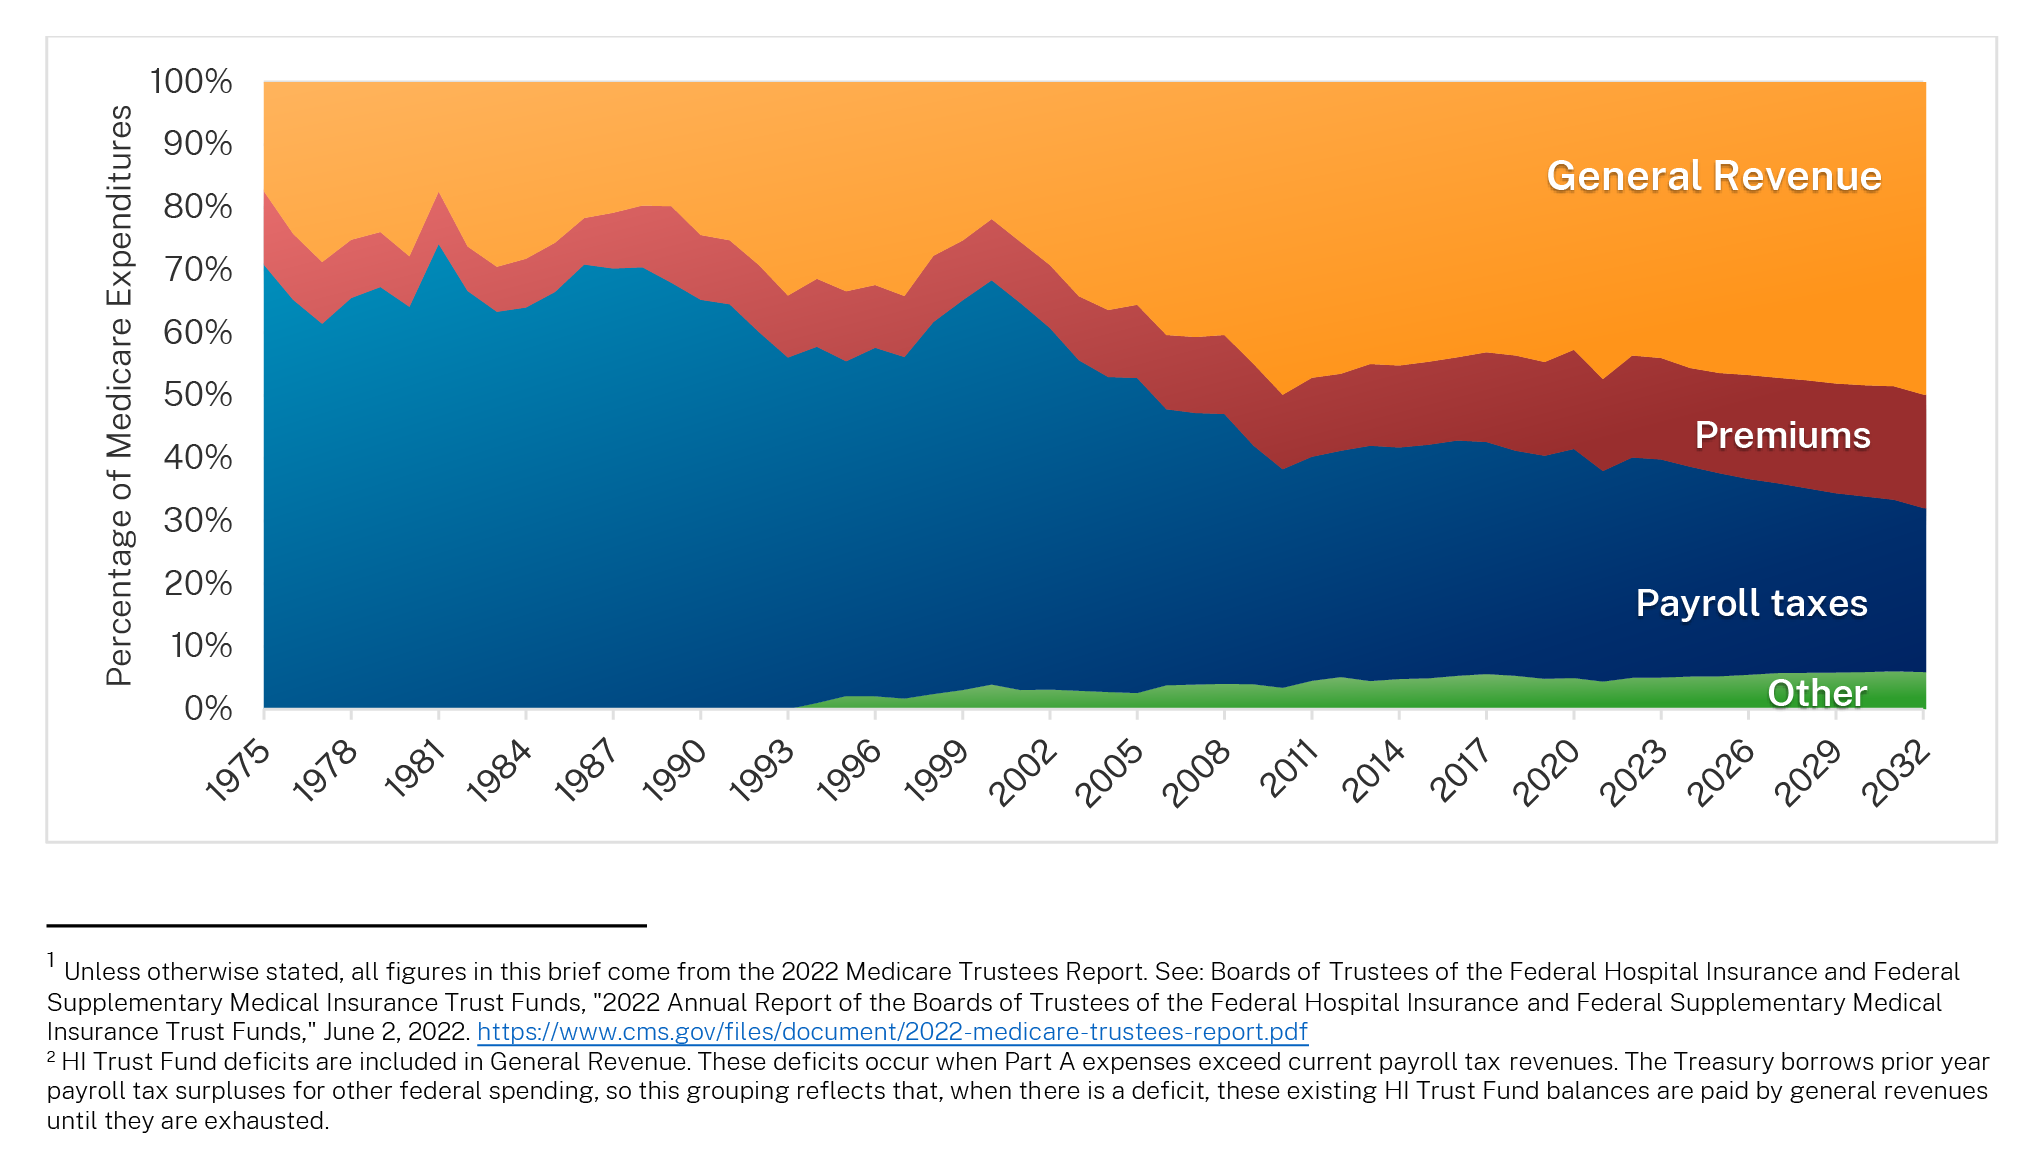
Figure 1 shows the expenditure growth of each type of Medicare benefits from 1975 through 2022, with projections for 2023 through 2032. The green line shows the level of dedicated funding to the Medicare program, which is payroll tax revenue and beneficiary premiums. Transfers from general revenue, including federal borrowing, must largely make up the difference to meet current commitments.
Figure 2 shows the source of Medicare revenues from 1975 through 2022 with projections after 2022.
Frequently Asked Questions
Why is Medicare cost growth a problem?
Medicare spending is growing as a share of the economy. From 1970 to 2022, it rose from 0.7 to 3.7 percent of GDP and is projected to reach 6.0 percent by 2046. Part B, which is mostly funded by general revenue transfers, is growing rapidly. Medicare’s cost growth directly diverts tax dollars from other programs. By contributing to federal debt, it will also increase interest payments and could eventually compromise the government’s ability to borrow absent large benefit cuts or tax increases.
Didn’t seniors already pay into their benefits with their payroll taxes?
No. Medicare is funded in a pay-as-you-go manner, since its benefits are almost entirely funded by current tax and premium revenues. Beneficiaries generally receive much more than what they pay in; a single worker with average income turning 65 in 2020 is expected to receive $257,500 in Medicare benefits (net of premiums) and pay $99,000 in Medicare payroll taxes over the course of a lifetime.2 Despite its name, the HI Trust Fund does not save surplus revenues. The Treasury borrows them for other expenses and pays for Part A benefits with general revenues, crediting them to the trust fund.3
What happens when the HI Trust Fund runs out of money?
When Part A expenses exceed revenues, the HI Trust Fund’s balances decrease. When it is depleted (referred to as “insolvency”), it will only be able to finance benefits with current revenues. When this happens (projected around 2031), the trust fund will only be able to finance about 89 percent of Part A benefits. While insolvency only refers to Part A, the program as a whole has serious fiscal challenges.
How will Medicare’s financing structure impact future beneficiaries?
Medicare’s pay-as-you-go funding structure means it becomes less sustainable when a smaller pool of taxpayers is supporting it. From 1980 to 2008, each beneficiary was supported by about four workers; this fell to about 2.9 workers in 2022 and will fall to 2.5 workers by 2030. This will make it harder to contain program costs and avoid a fiscal crisis. Simply maintaining the solvency of the HI Trust Fund does not fix this problem.