Joe Albanese
Joe Albanese is a Senior Policy Analyst with Paragon Health Institute. He comes to Paragon with several years of federal…
Reforming Government. Empowering Patients.
Navigation
The paper argues for enhancing Medicare through Medicare Advantage (MA), emphasizing its benefits in providing more efficient, choice-driven, and cost-effective healthcare coverage compared to traditional fee-for-service Medicare, alongside policy recommendations to improve MA’s performance and regulatory parity.
What This Paper Covers
Medicare Advantage (MA) offers a distinct public-private structure for delivering health care coverage. There are major shortcomings in the government-managed model of traditional fee-for-service (FFS) Medicare, whereas MA’s emphasis on competition and patient choice have made it the most popular form of Medicare coverage. Policy changes to improve MA’s efficiency and flexibility, while guaranteeing regulatory and spending parity with FFS, can ensure that continued growth leads to organic, long-term improvement in Medicare as a whole.
This paper summarizes the flaws of FFS, describes MA’s structure, highlights key issues in the debate about MA, and recommends a package of policy changes to protect and enhance choice for Medicare beneficiaries and maximize beneficial competition.
What We Found
Research about MA suggests that it is able to provide more choice, better health outcomes, and lower costs to its enrollees than FFS can. MA is already able to deliver core and supplemental Medicare benefits more efficiently than FFS can. However, some aspects of its current design have led to questions about its overall costs and government restrictions on effective and innovative coverage.
Why It Matters
Over 60 million Americans rely on Medicare for health care coverage, over half of whom are in MA. Policy changes to FFS are politically difficult to achieve and would have limited success within its existing structure. MA, on the other hand, offers higher value care, more competition, and enhanced patient choice and is therefore an ideal vehicle for Medicare reform. Policy changes will help to improve plan competition, beneficiary choice, and programmatic efficiency. They will also allow MA’s continued growth to offer a viable alternative to the flawed FFS program. Policymakers should avoid imposing restrictions that would limit seniors’ access to the program.
Policy Suggestions
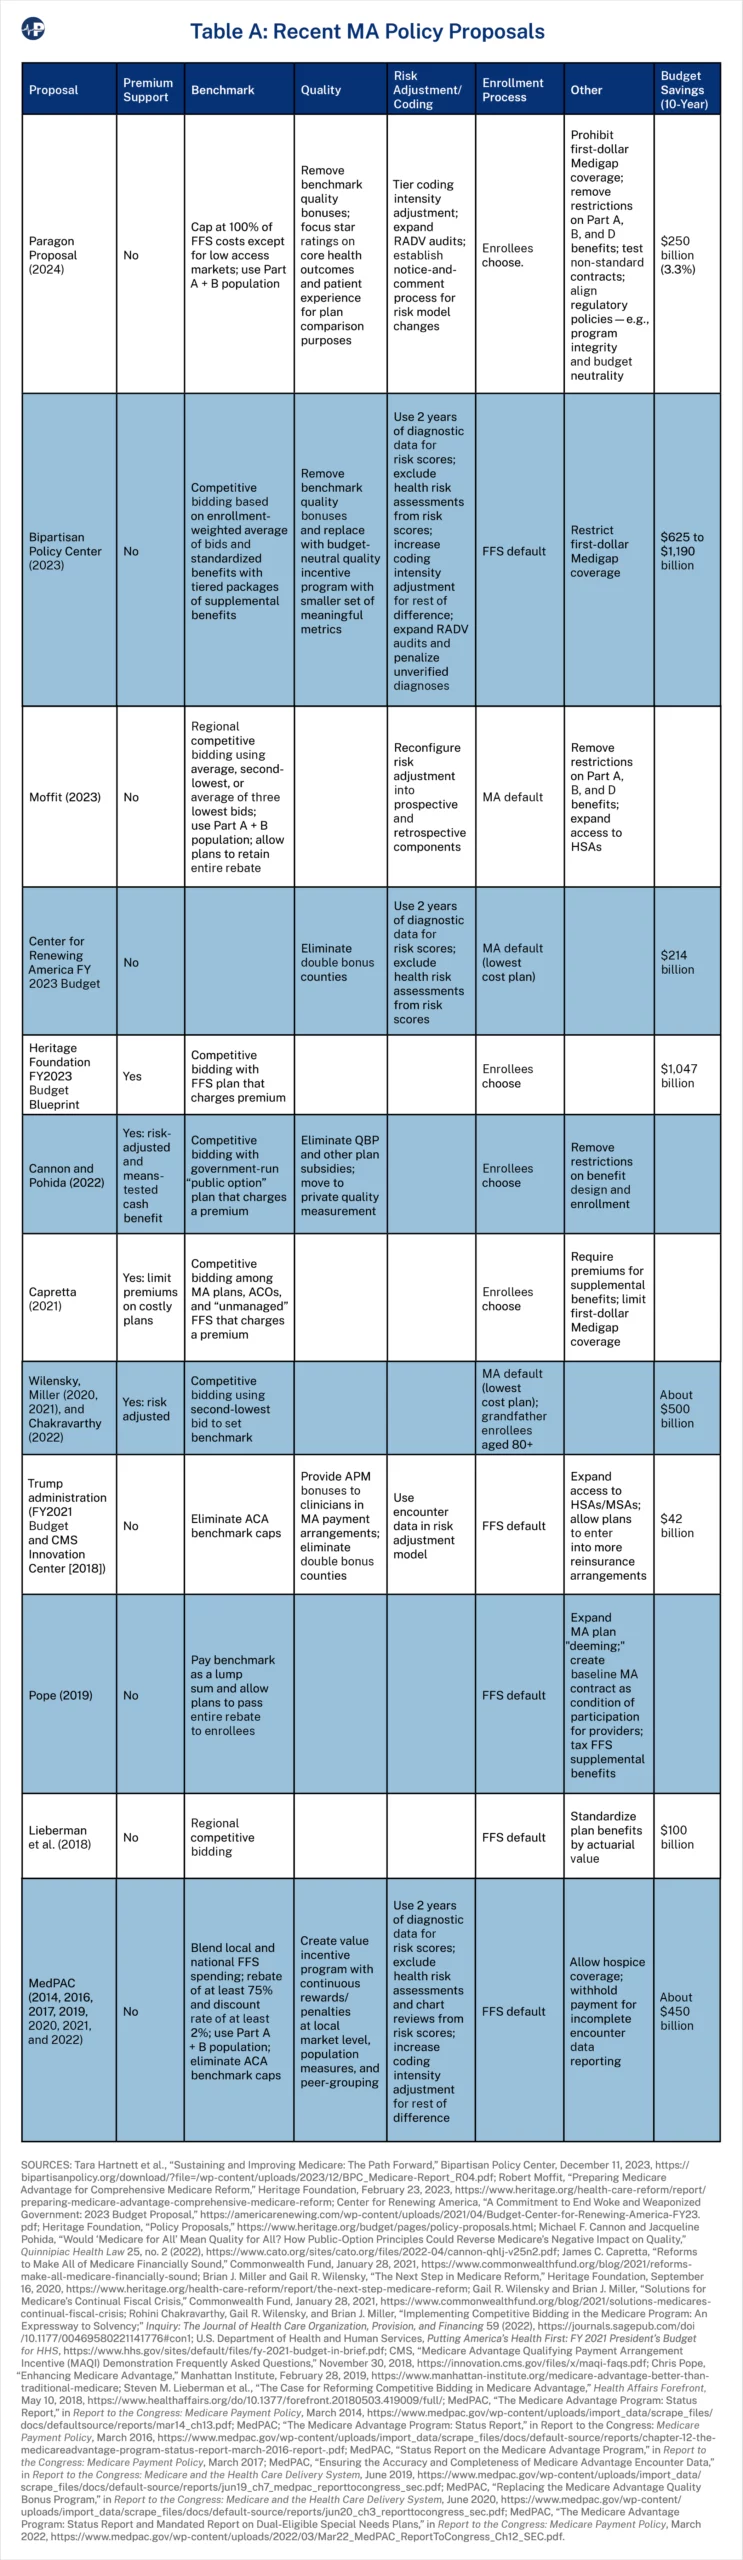
This paper recommends a unified package of attainable policies that aims to yield savings of $250 billion over 10 years (3.3 percent of MA spending), improve MA coverage, and advance regulatory parity with FFS:
Medicare is the largest federal health care program in terms of spending, with annual expenditures of over $900 billion in 2022. This exceeds national defense and is second only to Social Security among government programs.1 In 2022 it accounted for more than a fifth of national health expenditures.2 Providing health care coverage to elderly and disabled Americans has become increasingly expensive as the retired population and medical costs in the United States have continued to grow, with spending growth exacerbated by misguided government policies. But Medicare’s significance is not only a matter of dollars and cents. Over 60 million individuals are enrolled in the program, which gives the federal government tremendous influence over their health and well-being, as well as the health care system overall. Managing it efficiently and effectively is therefore of essential importance to many seniors and their families.
Under traditional fee-for-service (FFS) Medicare, the federal government directly pays for health care expenses, including hospital stays as well as outpatient and other medical costs (in Medicare Parts A and B, respectively). It makes coverage decisions, sets payment rates, and regulates care through the Centers for Medicare and Medicaid Services (CMS). However, roughly half of Medicare beneficiaries are now choosing to receive their coverage from private insurance plans through Medicare Part C, also called Medicare Advantage (MA). Between 2007 and 2023, the share of Medicare beneficiaries enrolled in MA rose from 19.5 percent to 48.5 percent, and CMS projects it will cross 50 percent in 2024.3
The growth of MA has shifted the center of gravity in the Medicare program. MA has been able to innovate in the payment and delivery of services by managing the excessive utilization of services and by offering supplemental benefits and cost-sharing reductions, improving upon Medicare’s original design. It is one of the best vehicles for improving patient choice and health care delivery that currently exists in federal health programs.
Even with these strengths, there are still policy changes that can allow MA to operate more efficiently and effectively. Part I of this paper outlines the current state of Medicare, critiques its structure, describes principles for programmatic changes, and describes how MA can drive systemic improvements in the program. Part II summarizes the structure and opportunities for improvement in MA, highlights the overall debate on MA, and offers policy recommendations, namely:
This package of policies would improve MA’s efficiency, quality, and advance regulatory and spending parity between it and FFS as it continues to grow. In order to achieve the objective of ensuring access to MA for beneficiaries, these policies are constructed as a unified package, as separating individual provisions without appropriate trade-offs could undermine the package’s balance of policy impacts.
The first part of this paper describes shortcomings in traditional Medicare both in terms of operational management and also in terms of the principles underlying its design. Addressing both is crucial to improving Medicare.
Medicare was enacted in 1965 to provide health care coverage to seniors in order to minimize the financial burden of health expenses to those who had exited the workforce. Lawmakers later expanded Medicare to people with disabilities and certain illnesses. While these beneficiaries are the constituency most directly impacted by the program, direct government control over health care financing has allowed parties other than patients to influence the program’s policymaking process. Industry interests, the technocratic choices of bureaucrats, and the political considerations of lawmakers lead to decisions that reduce health care quality, increase costs, and reduce access, despite these stakeholders often purporting to be advocating for enrollees’ best interests.
Government Price Setting
Medicare’s administrative rate-setting method is key to understanding the downstream problems with quality and innovation in the rest of the health care sector (as Exhibit 1 shows). Despite the trappings of scientific rigor over this process, government dictation of prices to providers, manufacturers, and others leads to a variety of market distortions and resource misallocations.
Medicare’s payments are often based on detailed formulas that represent, at best, an educated guess about the underlying cost of providing care, let alone what a market-bearing price would be. All third-party payers face difficulty in determining the value of health care to the consumer in terms of balancing cost and quality. But in the private market, prices emerging from negotiation or competition are a better indicator of value, as they must account for both demand- and supply-side factors, and consumers can choose among options. By contrast, government decisions depend more on the choices of public officials, who tend to be procedural, consensus-driven, and risk-averse rather than organic, objective, and innovative.
For example, Medicare’s use of different payment systems for different settings of care create obvious opportunities for gaming that policymakers have been slow to address. On average, hospitals receive twice as much as independent physician offices do for the same services. This “site-of-service differential” leads to excessive payments for hospital care, which in turn drives more market consolidation from hospitals acquiring independent physician practices so that they can charge more due to increased negotiating leverage.4
Medicare’s centralized process of payment updates also creates numerous known and unknown cases of mispricing. Setting prices too high or too low mismatches the supply and demand of services, leading to waste or reduced access to care, respectively.5 Overspending on health care is a particularly dire risk to the federal government’s fiscal stability. Federal health spending is projected to grow from around 6 percent of the economy to over 9 percent over the next 30 years, and reductions in federal health spending are needed in the next decade to ensure their long-term sustainability without painful benefit cuts or tax increases.6 The Office of Management and Budget projects that Medicare will grow from 11.9 percent of federal outlays in 2022 to 18.5 percent in 2033.7 Furthermore, the Medicare trustees project that the Hospital Insurance Trust Fund will become insolvent in 2031, which will necessitate an 11 percent cut in Part A spending.8
Politicized Payment
Medicare’s payment systems allow politics to impact resource allocation in the health care sector. The process of establishing coverage and payment is complex and opaque, which established stakeholders are better able to navigate to obtain more influence. Various carveouts catering to politically powerful groups have seeped into Medicare over time. Indeed, the Supreme Court has ruled that payments to participating providers qualify as a program “benefit,” not only to compensate them for services within the program but for guaranteeing their financial viability in general.9 This means beneficiaries are not always the primary focus of policymaking efforts.
Excessively stringent rules or stingy payment can certainly reduce access to care by making it less attractive for providers to participate in the program. But in some cases, efforts to increase compensation can look more nakedly political. For example, Medicare’s hospital payment systems include numerous add-on payments to facilities with higher purported costs or lower revenues, such as teaching hospitals. But such policies leave room for favoritism. One historical account reported that lawmakers purposefully offered “overly generous” funding to teaching hospitals based on “totally made-up number[s]” in order to win political support for other policy changes.10 This has resulted in higher spending as well as an expectation that poorly targeted federal subsidies should be the primary method of managing the health care workforce.11
The size and scope of Medicare means that its policies significantly influence the rest of the U.S. health care sector. A few ways it does this include the following:
Policymakers should be mindful of how their decisions on Medicare can distort private actors’ behavior. The intended effects of a policy may not necessarily align with its actual direct or indirect effects.
This dynamic plays out across the program. As Medicare’s scope grows, the incentive to secure favorable treatments or carve-outs likewise increases. Gearing Medicare policies toward providers can sometimes be an end in itself rather than a means of improving quality or access to care for beneficiaries.
Obstacles to Quality Improvement
Medicare’s FFS administrative pricing reflects an obsolete 1960s model of health care coverage. Even when policymakers have enacted legislative and regulatory changes, they have appended them on top of Medicare’s inefficient original structure, which is not conducive to innovation.
Outside of the health care sector, producers compete on both price and quality, which encourages them to improve value for consumers. However, Medicare generally pays based on the number and types of services (and the type of provider offering the service) regardless of the quality it provides. Policymakers have attempted to move from this “fee-for-service” structure to “value-based” payment with quality improvement programs. These efforts have spawned a complex array of quality metrics for different providers, as well as a cottage industry devoted to developing, maintaining, and evaluating them—with little to show for it besides increased clinician burden.12
CMS has also tried to test alternative payment models outside of its traditional reimbursement policies with the goal of lowering costs or improving quality. After more than a decade, most of these models have failed to do this, while efforts to promote more “accountable care” have also had mixed results.13
While policymakers often acknowledge the managerial shortcomings inherent to the current structure of FFS, CMS continues to maintain a centralized role in micromanaging health care delivery with siloed models and quality initiatives. A prevailing technocratic mindset leads policy experts to believe that pulling the right levers and incrementally tweaking policies will sufficiently improve Medicare without creating too much disruption. If past is precedent, minor changes cannot redeem an approach that is flawed at its root.
Paternalism
The political and expert class tend to approach health policy with an attitude that more government rules are in patients’ best interest, even if it reduces their choices. For example, policymakers may think that shopping for care or coverage should be restricted because it is too complex or burdensome for some individuals. This mentality may be based on benevolent motives, but is ultimately paternalistic.
One example is that Medicare will not reimburse doctors for performing over one thousand procedures outside inpatient hospital settings, which are often more expensive than ambulatory settings and may expose the patient to hospital-borne infections.14 CMS forbids any service from being performed in an ambulatory surgical center unless it decides to add it to a list of covered procedures. CMS, along with stakeholders such as hospital associations, justifies these rules by citing the risks of delivering such services to the “typical Medicare beneficiary.”15 But these restrictions prevent doctors from making site-of-service decisions based on their clinical expertise, patient preferences, and individual circumstances, instead directing them to the more expensive inpatient setting. In these instances federal officials are making health care decisions on behalf of millions of beneficiaries on the basis of a generalized assessment of risk.
Even when CMS does decide to remove misguided regulations, it can take years to consider, propose, enact, and implement such changes. Rather than organically responding to changes in the health care sector, CMS decisions are accountable to the public only to the extent its officials are persuaded by stakeholder comments or compelled by Congress, the courts, or presidential appointees to change. For example, CMS decided to remove hip and knee replacement procedures from the inpatient-only list nearly two decades after it first created that list, which led to a significant shift in those procedures to lower-cost ambulatory care settings and reduced Medicare spending.16 That shift may have happened much sooner if CMS had not imposed restrictions on the decisions of medical practitioners and patients in the first place. These policies may be stifling other unknown innovations too.
Unlike in the private insurance market, where individuals have more freedom to choose among coverage options, Medicare enables officials in a single agency to make one-size-fits-all decisions for tens of millions of people nationwide. Trusting patients to make the best decisions for themselves, in consultation with their doctors, is crucial to improving federal health programs.
Instead of mismanaging resources, favoring incumbent stakeholders, stifling innovation, and undervaluing choice, the best way to manage Medicare is to empower beneficiaries to make their own decisions. Policymakers can accomplish this by pursuing policies consistent with four principles:
What do these principles mean?
First, a patient-driven approach to Medicare—and to health care in general—respects that individuals have different preferences and needs. The health care market contains private providers, suppliers, and insurance plans seeking to win over the business of beneficiaries. Policies that directly or indirectly constrain consumers’ choices may limit access to the care that best meets their needs and limit competition that would otherwise drive prices down and quality up.
Second, patients are in the best position to determine the value of health care for themselves, with the support of those who know them and their circumstances best. While these decisions are not simple, giving consumers more control over the financing of health care allows them to put these preferences into practice by making trade-offs based on concrete parameters.
Third, market prices provide information that central planners cannot possibly know about the value of goods and services, and the opportunity costs of resources, by accounting for individual preferences. Government interventions in a market politicize prices and distort resource allocation. For example, price ceilings that are set below market prices typically lead to shortages and decreased quality, because consumers consumer more at artificially low prices while firms have less incentive to offer quality services at below-market rates.
Finally, maximizing value requires proper incentives to get the best quality of care at the lowest cost. Entities that have access to relevant data, the ability to demand changes to costs or quality, and the economic requirement to meet consumer needs can help consumers and patients maximize value.
Enacting major legislative changes to federal entitlement programs is a notoriously difficult task. It may therefore seem like the prospect of aligning with the above principles is slim.
Fortunately, a mechanism for market competition and patient choice already exists in Medicare Advantage. It enables enrollees to shop for the plan that best meets their needs and incentivizes those plans to manage their resources efficiently. MA has grown to cover half of Medicare beneficiaries, and it represents the best and most realistic vehicle for moving the entire program in a more patient-driven direction.
This does not mean policymakers should simply step back and hope for these trends to continue. There are opportunities to improve upon MA. Some of its shortcomings are endemic to the Medicare program generally, such as the outsized influence of CMS regulation on the health sector. Others are specific to the program’s unique design, such as distortions in financing. Supporters of MA can make it even more sustainable and innovative while preventing skeptics from imposing policy changes that will limit the program’s growth. Improving MA’s existing structure would be the best and most practical approach to significant Medicare reform.
The second part of this paper provides more detail about how MA functions, discusses the key issues and public debate surrounding MA’s strengths and opportunities for improvement, and concludes with policy recommendations.
MA provides enrollees with, at minimum, the Part A and B coverage of traditional Medicare through private insurance plans. These plans may not impose more cost-sharing than FFS does on an actuarial basis. Beyond this, MA plans have wide-ranging differences in benefit design and governance. They often cover core benefits at lower cost than FFS does and pass the savings along to enrollees in the form of supplemental benefits, such as hearing, vision, and dental, that are not available in FFS, as well as paying back a portion to the federal government. CMS regulations also require MA plans to cap out-of-pocket costs for enrollees, unlike FFS.
Since replacing the previous Medicare+Choice program in 2006, MA has steadily grown to about half of all Medicare beneficiaries. The Congressional Budget Office (CBO) expects enrollment to reach 56 percent of Medicare beneficiaries in 2033, although it had previously underestimated MA’s enrollment. In 2022, enrollment was nearly 30 million people, about 2.7 times higher than the 11 million CBO projected in 2012.17 This growth occurred despite the fact that FFS is the default enrollment option for newly eligible beneficiaries and despite various changes to the program over time. For example, the Affordable Care Act (ACA), reduced payments to plans by about $136 billion from 2010 to 2019 (according to initial estimates) benchmark recalculations, tying supplemental benefits to quality ratings, and reductions to risk adjustment payments.18
The Bidding Process
In FFS, the federal government reimburses providers directly in an open-ended, volume-based manner. However, in MA, plans receive monthly fixed (or “capitated”) payments from the government based on their numbers of enrollees.
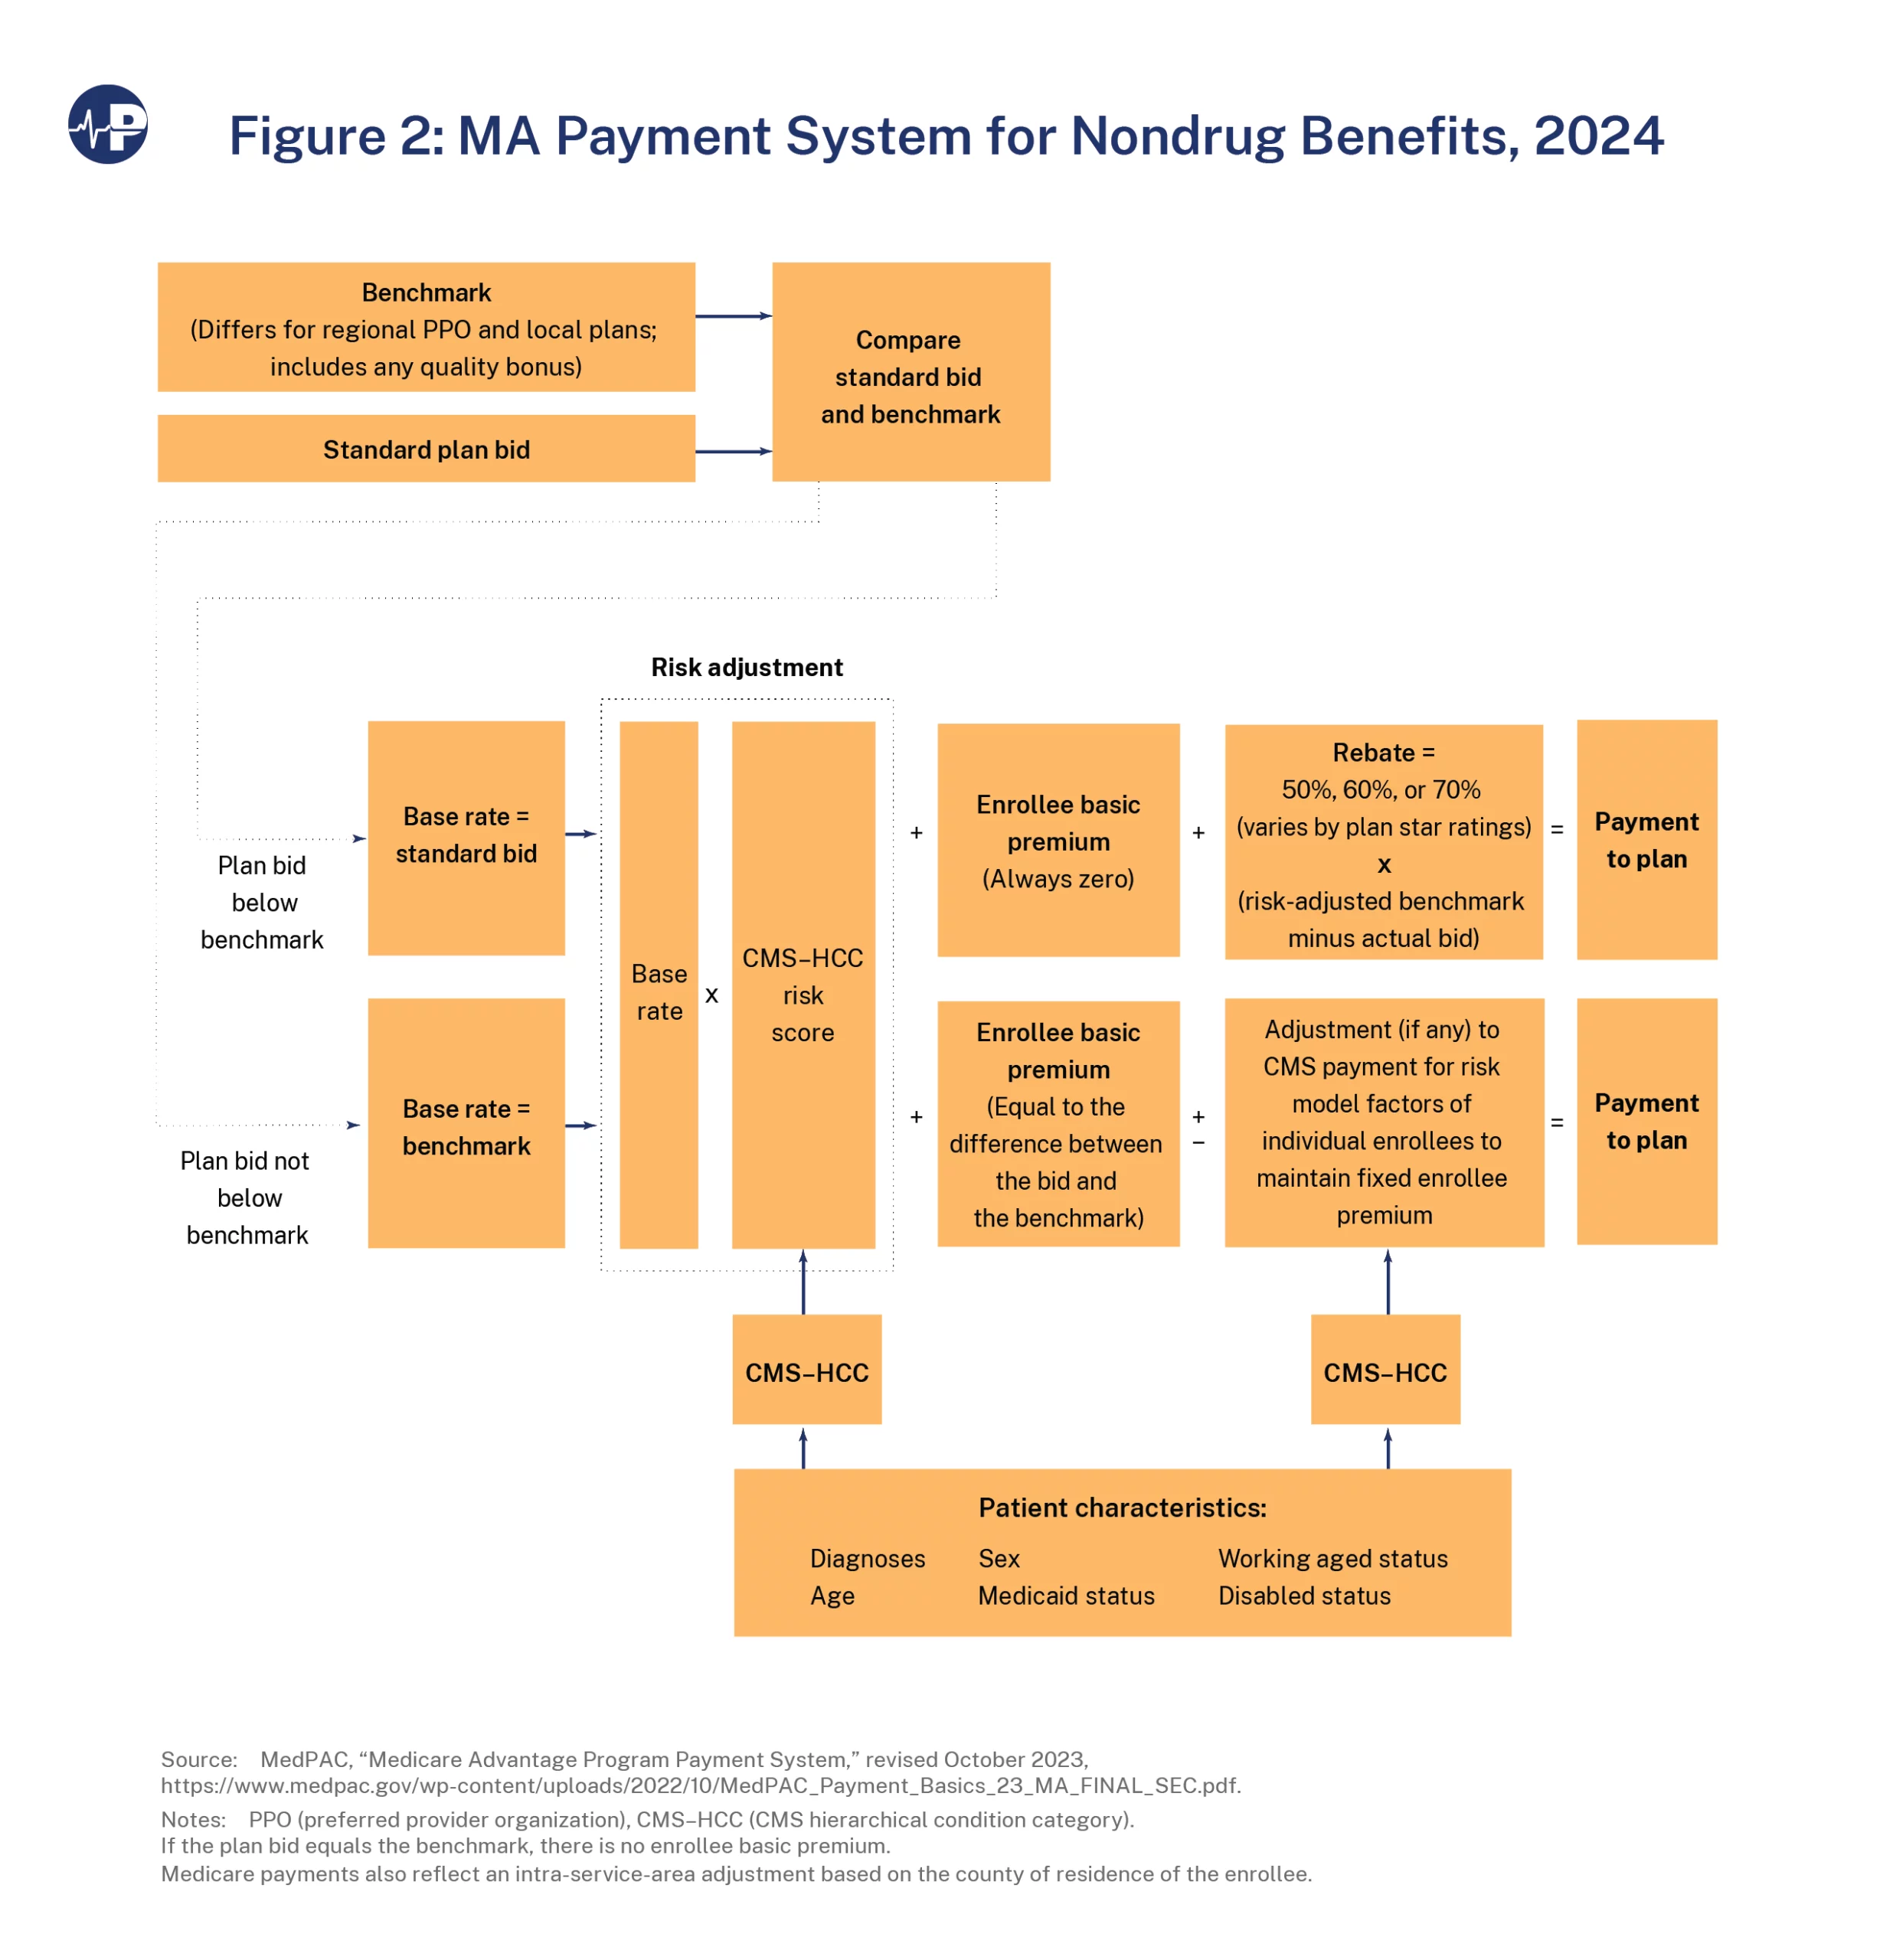
CMS determines government payments through a process by which the plans “bid” to offer Part A and B benefits in a specific market area (typically a county) at a particular cost.19 These bids are compared against a county benchmark based on FFS expenditures. There are four benchmark levels—95, 100, 107.5, or 115 percent of projected per-beneficiary FFS spending in that county in that year. Counties with higher FFS expenditures receive lower benchmarks and vice versa; for example, counties in the highest quartile of FFS spending get a 95 percent FFS benchmark, and counties in the lowest quartile of FFS spending get a 115 percent benchmark. This is intended to control spending in areas with high FFS costs while incentivizing access in less costly ones. When counties change quartiles year over year, the benchmark is averaged over two years.20
Next, CMS compares plans’ bids to the benchmark for that market area. If a plan bids below the benchmark, indicating it can offer Part A and B benefits at a lower cost than FFS, then the bid becomes its base payment rate. If the plan bids at or above the benchmark, the payment rate is set at the benchmark, with the remainder of the cost paid by enrollees through higher plan premiums. This makes it more likely that consumers will avoid less efficient plans.
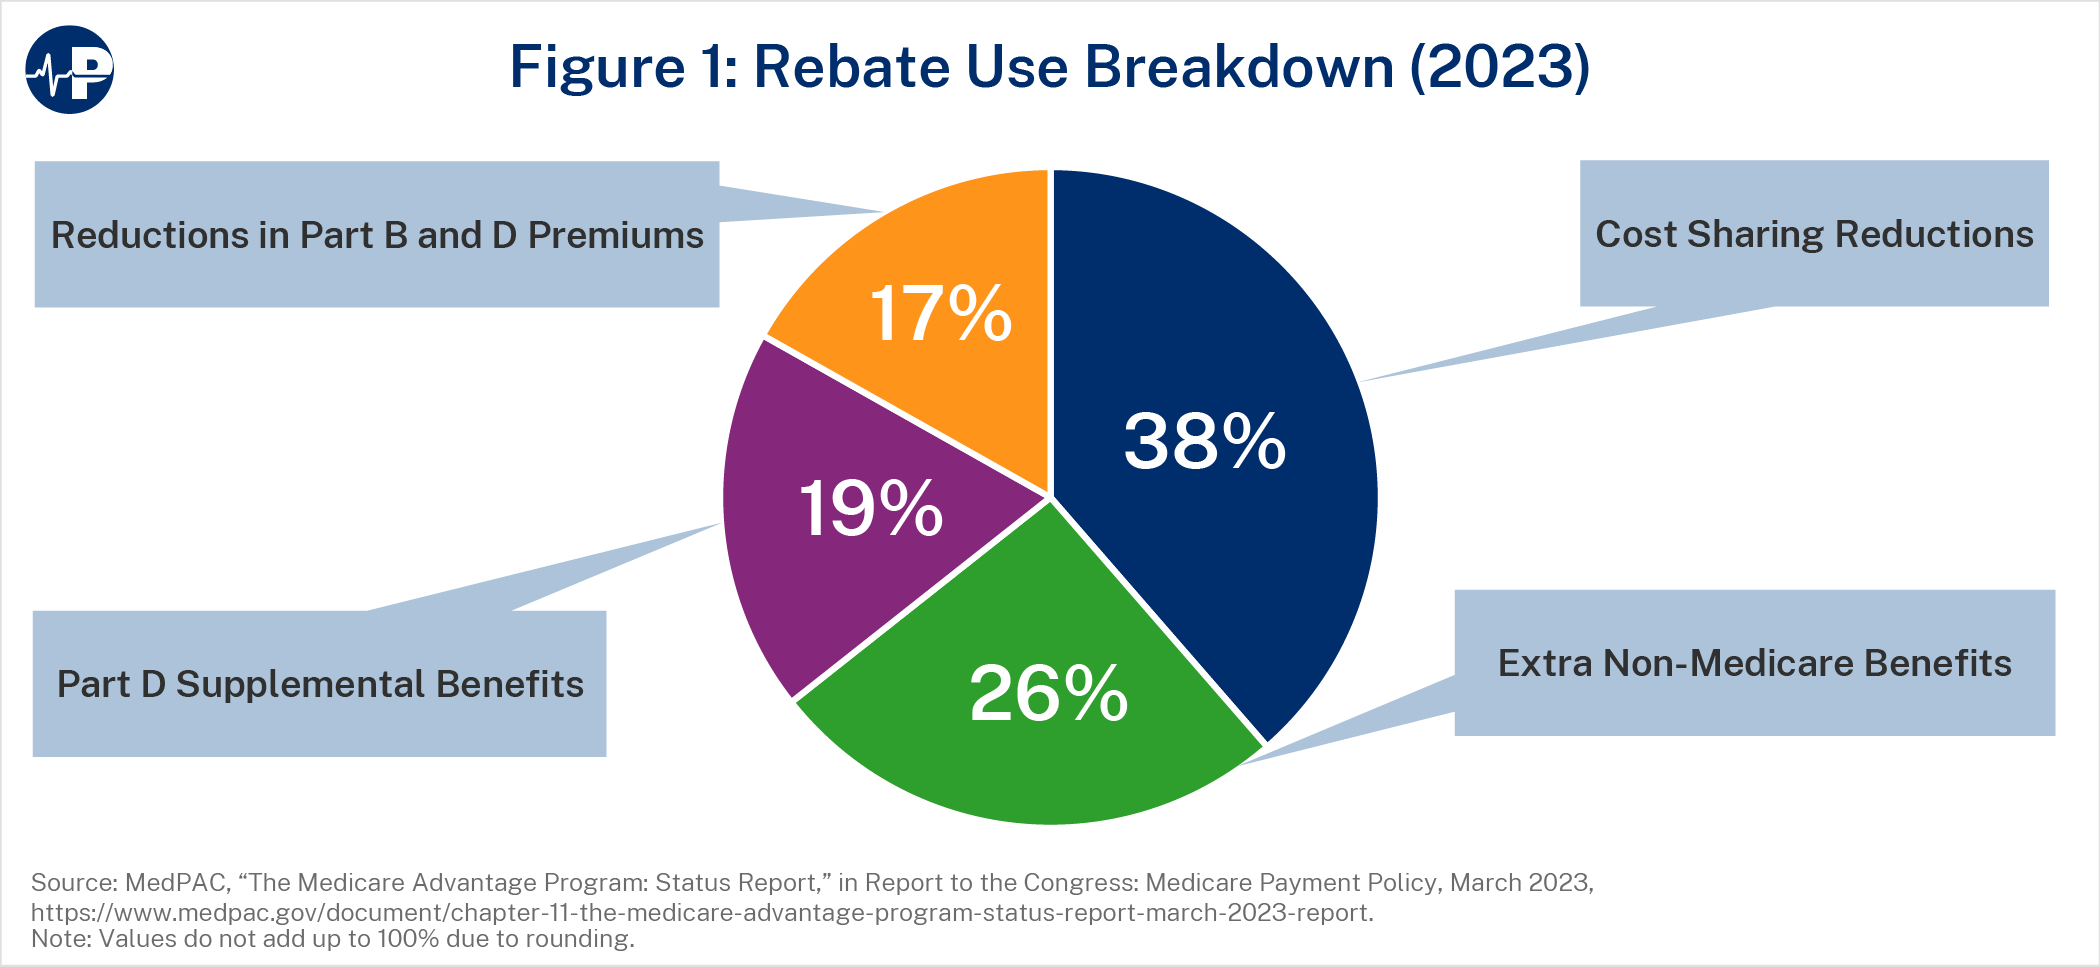
After accounting for quality bonuses and risk adjustment (described below), a plan that bids below the benchmark receives a rebate equal to a percentage of the difference between its bid and the quality- and risk-adjusted benchmark (its “pass-through” rate), with the federal government retaining the rest. Plans must use rebates to provide enrollees with supplemental benefits or reduce their premiums. Supplemental benefits do not need to align with FFS benefits and can include cost-sharing reductions; coverage for hearing, vision, or dental services; and gym memberships. Figure 1 illustrates the average breakdown of rebates in 2023.21
Quality Bonus Program and Risk Adjustment
Within MA, the Quality Bonus Program (QBP) evaluates plans based on quality measures based on clinical processes, health outcomes, or customer experience. CMS calculates plan performance on these metrics and assigns plans star ratings between 1 and 5 in half-star increments. The QBP rewards plans with higher star ratings in two main ways. First, plans with 4.0 or more stars receive 5 percent higher benchmarks (or 10 percent higher for plans in “double bonus” counties).22 Second, plans with higher ratings also receive larger rebate passthrough rates. Plans with star ratings of 3.5 or below retain 50 percent of the difference between their bids and the FFS benchmarks, those with 4.0 stars keep 65 percent, and those with 4.5 or 5.0 stars keep 70 percent. Both the higher benchmarks and the higher pass-through rates increase the size of rebates and enable plans to offer more supplemental benefits, which helps to attract enrollees.
The last factor in setting MA plan payments is risk adjustment. This is the process by which CMS increases payments for plans with enrollees who are expected to have higher health care costs. Risk adjustment is intended to eliminate plans’ incentives to attract only healthier patients who will use fewer services. Medicare calculates relative enrollee risk based on age, sex, disability, Medicaid status, and health condition. This “risk score” modifies plan benchmarks to account for estimated cost differences, and \ this adjusted benchmark determines rebates.23 The process of determining MA payment rates is summarized by Figure 2 below.
CMS Regulations
Although CMS delegates many responsibilities to private plans within MA, it retains a powerful oversight role through a combination of statutory, regulatory, and sub-regulatory policies. Some of these policies apply to other commercial health insurance plans as well, but MA plans’ direct participation in a government health care program increases the extent of CMS’s authority over them. For example, MA plans must seek pre-approval for advertisements, meet minimum network adequacy requirements, and spend at least 85 percent of premium revenues on health care claims rather than administrative expenses or profits (known as a medical loss ratio (MLR)). These brief examples demonstrate that plans do not necessarily have total freedom to manage their enrollees’ coverage
The Advantages of Medicare Advantage
MA plans face incentives to be efficient because they compete with other carriers to attract enrollees and face financial risk if their enrollees’ costs exceed the capitated payments they receive. Plans yield greater efficiencies by employing flexibilities to contain costs with practices such as utilization management or provider network configuration. By contrast, FFS rarely employs methods such as prior authorization and allows enrollees to see any providers who meet its conditions of participation—regardless of the quality of the provider or the value of the service or treatment. Given the prevalence of low-value care in the health care sector (estimated at roughly a quarter of expenditures), MA’s flexibilities have a significant upside.24
MA tends to outperform FFS on various metrics, including achieving better health outcomes.25 Specifically, studies show that MA is associated with more preventive care visits, fewer admissions and shorter lengths of stay in hospitals, and generally lower health care costs. Some have also found higher quality of care in MA on metrics such as mortality after hospitalization.26 Other studies found that MA performed comparably on some utilization measures, such as total hospital days and use of select low-value services such as cancer screenings or imaging services, but worse on some condition-specific measures, such as potentially avoidable hospitalizations for ambulatory care-sensitive conditions among black enrollees and urinary incontinence among long-stay skilled nursing facility residents.27
In terms of lower health care costs in MA, there are two potential causes: lower per-unit prices for items and services and less utilization. Numerous studies have found that MA and FFS pay similar rates for services such as hospital care (with some studies finding slightly lower or higher hospital rates), whereas other commercial payers tend to have much higher prices.28 Likely a main reason for this is that FFS reimbursement policies, including the requirement that out-of-network prices not exceed those in FFS, strongly influence MA payment rates. However, plans still have the ability to negotiate with providers or exclude them from their networks entirely.29 As a result, MA plans can secure discounts below FFS levels for certain services, although policies in FFS—such as freezes in physician payment updates, the use of competitive bidding for durable medical equipment, and the incorporation of private payer rates for clinical laboratory services—may impact these differentials.30 MA pricing is not as accurate an indicator of the value of health care as might exist in a competitive market without government distortions, but enrollee choice and financial incentives make voluntary transactions among private actors a better approximation of economic value than government price-setting. Reforms to decouple Medicare prices from the current administratively determined method, such as adopting more private sector payment data, may be a long-term way to encourage plans to undertake more effective negotiations with providers or conduct more analysis of the value of individual services.31
The most significant way that MA plans contain costs however is by reducing the volume and intensity of health care services. This can be due to achieving better health outcomes among their enrollees and making use of the policy flexibilities that allow them to control utilization. One example is the different utilization of post-acute care in FFS and MA. As mentioned above, the different payment systems in FFS, including post-acute care providers, leads to more care higher-cost facilities than necessary. MA enrollees tend to have less post-acute care utilization overall than in FFS, particularly in inpatient rehabilitation facilities and long-term care hospitals that can have higher FFS rates than acute care hospitals.32
Cost savings from lower utilization can have important implications for Medicare’s overall finances. An Avalere Health study commissioned by America’s Health Insurance Plans (AHIP) found that Medicare Part A’s insolvency date would shift from 2031 to 2048 if FFS had similar utilization levels as MA.33 Even beyond such hypotheticals, MA utilization may already have spillover effects in FFS and the rest of the health care system: Researchers have found that greater MA penetration is associated with lower overall Medicare costs. One study found a 0.7 percent reduction in standardized FFS spending per enrollee with every percentage point increase in MA penetration, while another found that MA uptake is associated with lower FFS post-acute care spending without increasing hospital readmissions, an effect that was even greater in areas with accountable care organization (ACO) penetration.34 This synergy with ACOs reflects particularly favorably on MA given that it has been estimated to have 22-26 percent lower spending than ACO programs in traditional Medicare, with differences driven by less outpatient hospital utilization in MA plans.35
In short, MA requires private plans to operate within a framework of fixed payments that attempt to account for plan costs, plan quality, and enrollee risk. Competition among plans drives them to offer more generous, personalized benefits at lower cost to beneficiaries and to lower bids by reducing unnecessary costs. These extra benefits of MA have led millions of additional beneficiaries to vote with their wallets and choose MA rather than FFS. However, as the next section will show, there are opportunities to improve the program.
Spending in MA Versus FFS
MA’s overall costs have been discussed as a potential driver of Medicare spending. As MA enrollment is projected to continue increasing, this question will be crucial for maintaining Medicare’s overall fiscal sustainability.
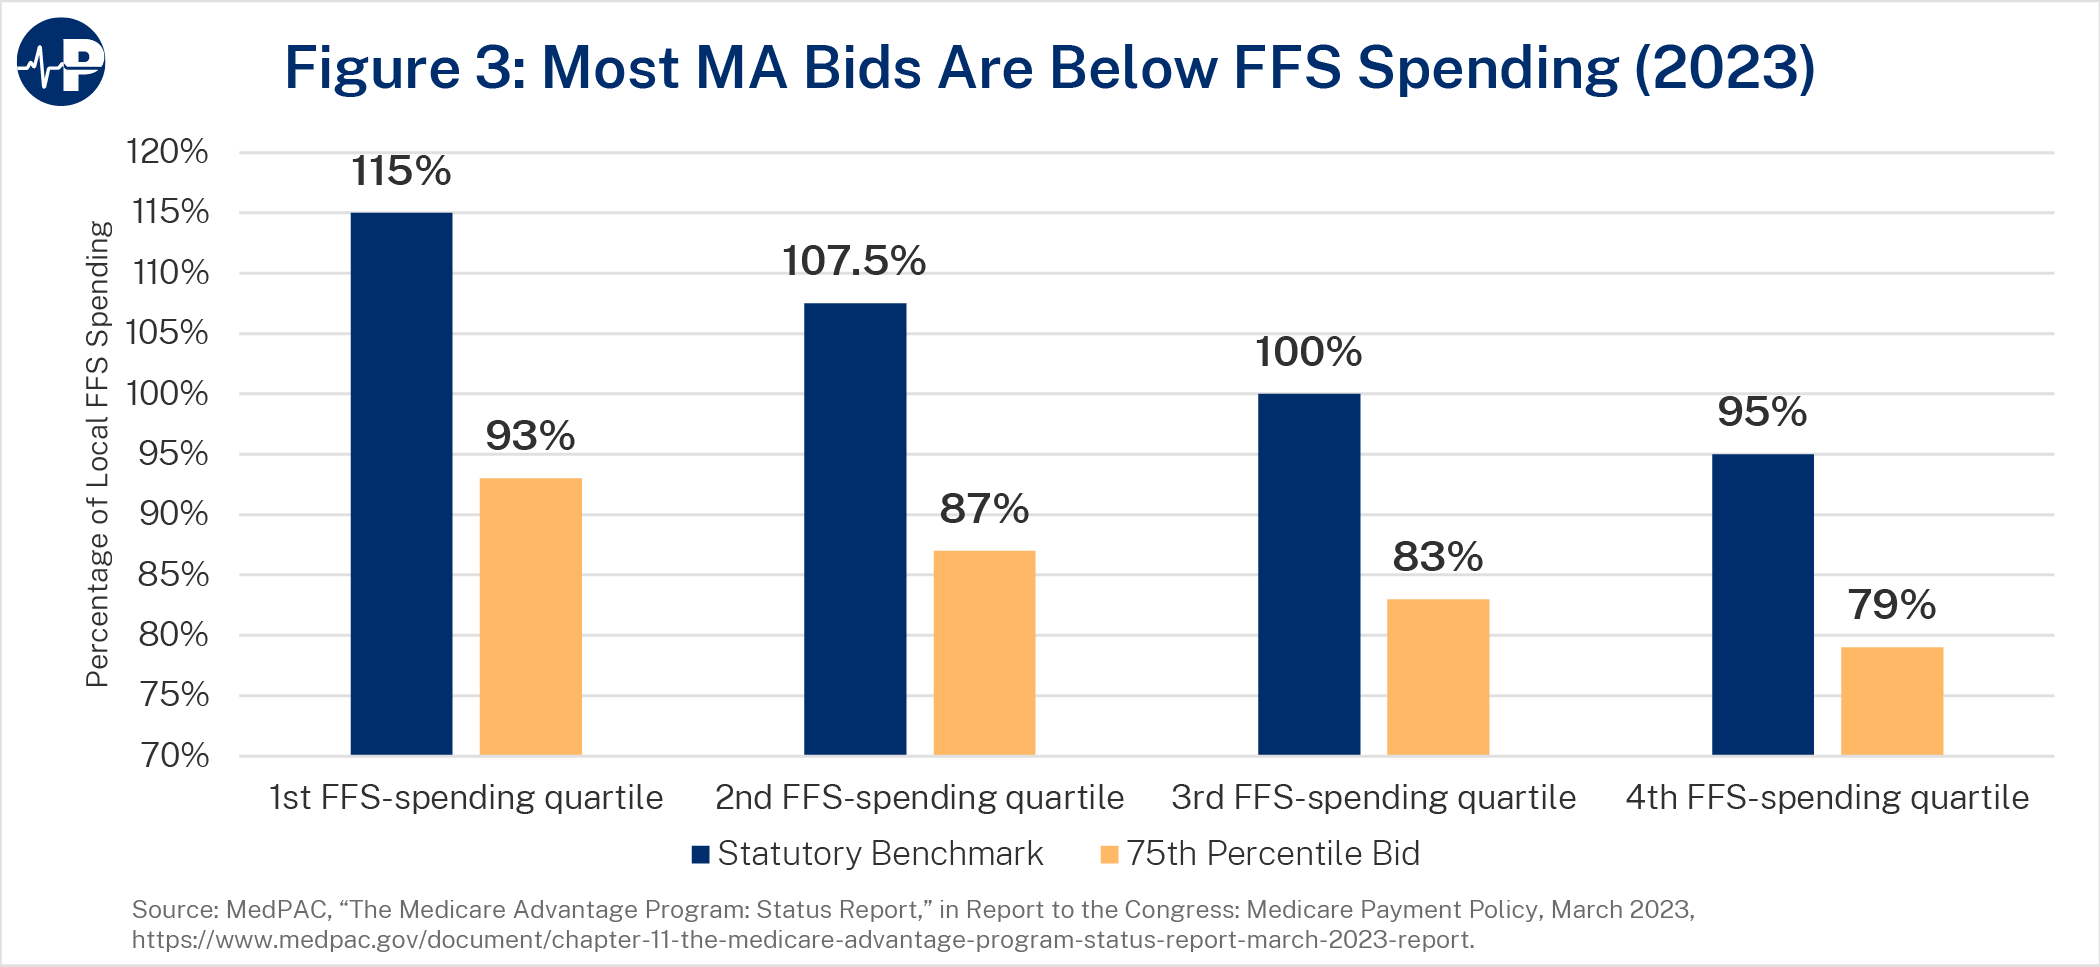
As noted above, one of the advantages of MA is that enrollees have lower health care expenditures relative to those in FFS. A 2017 study found that health care spending for MA enrollees is about 25 percent lower than for FFS enrollees in the same county with the same risk score due to lower utilization.36 A 2021 Milliman study commissioned by the Better Medicare Alliance found that MA spending on Part A and B benefits and administrative costs (including profit margins for MA plans) was about 86 percent of FFS for those items.37 MA plan bids have also reached a record low. On average, plans can deliver basic Part A and B benefits at 83 percent of FFS costs based on their bid levels (87 percent after accounting for risk adjustment payments). Figure 3 below shows that average bids fall below FFS costs in every county benchmark quartile.38
However, some argue that aggregate MA expenditures do not reflect these health care savings. For example, the Medicare Payment Advisory Commission (MedPAC) states that 2024 payments to MA plans are 123 percent of FFS due to coding intensity and favorable selection.39 There is reason to doubt that these factors are driving payments to that level, as discussed below, and MedPAC’s previous reports using a different methodology estimated MA spending at 106 percent of FFS in 2023.40 A 2022 study points out that addressing risk adjustment differences and accounting for differences in comparison population or out-of-pocket liability – that is, comparing the programs on a more apples-to-apples basis – puts MA spending “close to equivalence” under MedPAC’s methodology.41 Some aspects of MedPAC’s calculation methodology are unclear however – for example, how it estimates risk-adjusted spending for Part A-only beneficiaries that it includes in benchmark calculations, given that these individuals do not have Medicare data available for outpatient encounters. A separate 2021 analysis of overall MA and FFS expenditure data by KFF, accounting for beneficiary health status and geographical distribution, put MA per-enrollee spending at 103 percent of FFS.42 Notably, none of these analyses incorporate the spillover effects of MA on FFS spending discussed above or the exclusion of certain payments (such as shared savings payments, discussed below) in calculating FFS costs.43 Regardless of the outcome of this debate and the important technical questions it raises, it is clear that there is an opportunity for the government to spend less when a Medicare beneficiary chooses MA rather than FFS given that MA plans provide basic Part A and B benefits at 13-17 percent lower cost than FFS.
Benchmarks
MA’s process of setting base benchmarks above FFS costs in the half of counties nationwide with lower FFS expenditures is one cause of higher spending. On average, benchmarks for all MA plans were 109 percent of FFS spending in 2023 (114 percent after accounting for risk adjustment).44
At the same time, the methodology used to calculate MA benchmarks leads to artificially lower payments. Current benchmark calculations include cost data from Medicare beneficiaries who do not have both Part A and Part B coverage. About 7.5 percent of Medicare beneficiaries have Part A and opt out of Part B, and about 0.4 percent of beneficiaries purchase Part B but not Part A, likely because they lack the requisite work history for premium-free Part A.45 Beneficiaries without both Part A and Part B have lower Medicare costs on average, but MA benchmark calculations include these beneficiaries despite the fact that MA plans must cover both sets of benefits. Thus, benchmarks are lower than they would be if they focused on an equivalent beneficiary population. Including beneficiaries who do not have both Part A and Part B in the benchmark calculation reduces current MA spending relative to FFS by 1 percent to 6 percent or higher.46 Other policies reduce MA spending relative to FFS costs as well, such as the exclusion of certain payments such as shared savings bonuses to ACOs from benchmark calculations.47
Additional Benefits in MA
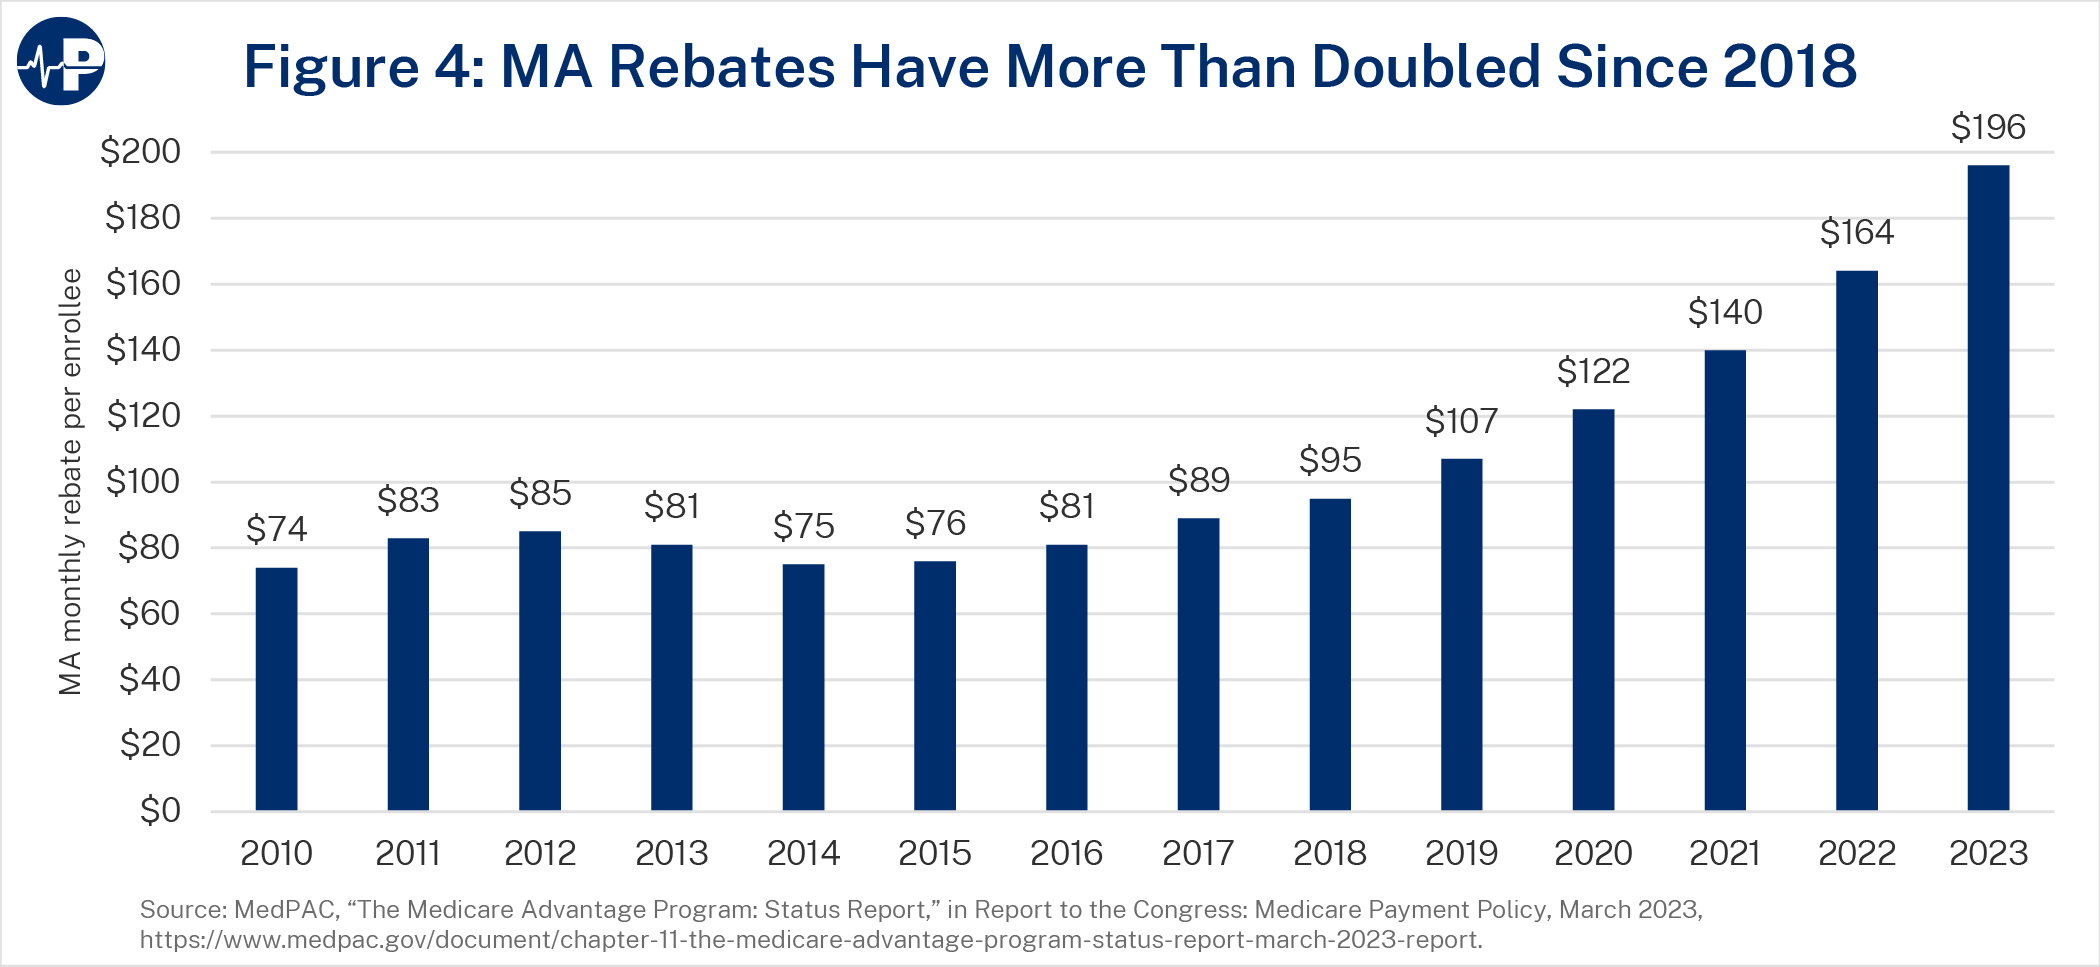
MA offers more generous coverage than basic Part A and B benefits. In part, this is the justification for higher benchmarks that result in more supplemental benefits, which policymakers have acknowledged are advantageous and popular among MA enrollees. Because plans retain 50-70 percent of the difference between their bids and benchmarks (with the rest going to the federal government), record-low bids have translated into recordhigh rebates that are used for extra benefits, as Figure 4 below shows.48 These benefits usually do not increase enrollees’ costs. According to MedPAC, about 74 percent of MA enrollees are in zero-premium plans (i.e., plans with no additional premiums above the standard Part B premium) with Part D prescription drug coverage, and 99 percent of eligible Medicare beneficiaries have access to such plans.49
MA also provides enhanced coverage without using rebate dollars. Unlike in FFS, where there is no out-of-pocket cap, plans must limit out-of-pocket expenses at in-network providers for enrollees at $8,850 in 2024 ($13,300 for both in- and out-of-network) and may set lower limits for more flexibility in setting cost-sharing policies.50 Plans set limits of $4,835 for in-network and $8,659 for in- and out-of-network services on average in 2023.51 By one estimate, enacting similar limits in FFS would increase spending by 3.5 percent.52 MA plans also have other design flexibilities that allow them to provide more integrated coverage that may be attractive to beneficiaries. For one, MA prescription drug plans offer Part D benefits, which FFS beneficiaries must purchase separately. MA organizations can also offer “special needs plans” aimed toward populations with unique health care needs, such as dual Medicare-Medicaid enrollees, those with chronic health conditions, or individuals in long-term care institutions. The ability to coordinate benefits between Medicare and Medicaid in particular has contributed to increased MA enrollment by dual enrollees over time.53 In 2021, about 55 percent of dual enrollees were in MA, and they accounted for 22 percent of MA enrollment.54 These integrated benefits and specialized beneficiary populations may impact overall programmatic costs.
Quality Bonus Program
Quality bonuses are meant to incentivize plans to increase quality of care for their enrollees. In practice, they are not effective at doing so. Such payments incentivize plans to maximize federal bonuses by conducting compliance- or process-based activities that may not correspond to patient needs, align with other quality measurement programs in Medicare, or improve health outcomes.55 CMS applies weights to different quality measures so that process measures individually have a lower impact on the overall star rating, but they still make up roughly half of the quality measure inventory in MA (over 20 percent in terms of weight). By contrast, outcome-based measures account for only three out of 30 total MA quality measures (about 10 percent in terms of weight).56
The value of the quality measures that plans report is dubious to actually improving health outcomes, with MedPAC going so far as to say that “quality in MA cannot be meaningfully evaluated” on the basis of the QBP.57 The lack of a similar comprehensive quality rating system for FFS makes it even harder to compare quality between the two programs. Other policies further distort the QBP by applying bonuses unevenly across plans. The ACA capped benchmarks for certain counties, preventing those plans from receiving the boosts they would get in other counties for similarly high performance. Conversely, urban counties with low FFS spending and historically high MA enrollment receive double bonuses.58
Quality bonuses have grown significantly because the vast majority of enrollees—85 percent—choose to enroll in plans with four stars or more. Between 2022 and 2023, these bonuses increased by nearly 30 percent, from $10.0 billion to $12.8 billion. This is more than four times the $3.0 billion provided for such bonuses in 2015.59 Although plans’ star ratings declined slightly on average in 2024, which may impact the size of bonuses, such trends will likely not impact their efficacy.60
Risk Adjustment
Risk adjustment modifies MA base payments with an intent to appropriately compensate plans for beneficiaries with relatively higher expected medical costs—otherwise, there would be a disincentive for plans to enroll them. This dynamic incentivizes MA plans to identify and increase recording of diagnoses for their enrollees in order to maximize payments. Plans may identify new diagnoses in multiple ways, such as increased patient encounters with health care providers (including preventive care visits that include health risk assessments) or “chart reviews” of medical records. MA enrollees’ risk scores tend to be higher and grow faster than those of FFS enrollees due to the different incentives for diagnostic reporting in each program. This risk score differential is referred to as “coding intensity.” To address the additional costs that coding intensity incurs in MA, statute requires CMS to reduce risk adjustment payments each year with a “coding intensity adjustment” of at least 5.9 percent, although it has never gone above this level. According to MedPAC, this reduction was smaller than the actual average coding intensity, which it estimated was 13.2-14.1 percent in excess of FFS costs in 2021 depending on calculation methodology.61
One factor that potentially overstates the degree of coding intensity is the fact that FFS payments are largely not risk-adjusted, so there is less incentive to thoroughly record diagnoses for FFS enrollees as for those in MA. Furthermore, coding intensity does not necessarily entail excessive payments, because the underlying diagnoses in MA may still be accurate. MA plans are subject to program integrity and law enforcement action for incorrect or fraudulent diagnoses (further discussed in the policy recommendations in this paper).
Relatedly, some researchers argue that MA payments do not account for “favorable selection” of beneficiaries in MA. Selection bias is a persistent risk throughout the Medicare program. For example, voluntary alternative payment models may attract participating providers who are more likely to successfully meet the models’ criteria and earn greater pay, rather than poorer performers who might need greater changes in health care delivery but face greater financial risk.62 In MA, favorable selection theoretically means that its enrollees consistently have lower health risk than what is estimated by their risk scores, meaning that plans attract enrollees with lower health expenditures while more expensive patients with the same identified diagnoses remain in or move back to FFS. This would enable plans to reduce their bids without providing more efficient coverage. MedPAC estimates that favorable selection inflates MA payments by 9 percent.63
There are various factors that could affect actual or purported favorable selection in MA. Because MA plans typically control health care utilization with prior authorization policies or narrower provider networks, beneficiaries who expect to use more care may wish to remain in FFS, which lacks these potential barriers but as a result operates less cost-effectively. Default FFS enrollment, described more below, also impacts favorable selection, as it requires an active decision to enroll in MA that may not be evenly distributed among beneficiaries.
At the same time, there are factors that may overstate favorable selection. Undercoding in FFS would incorrectly assign a lower risk score to FFS beneficiaries with relatively higher spending. The methodology used by MedPAC to calculate favorable selection—examining the expenditures of enrollees who switch from FFS to MA compared to those who remain in FFS—also raises concerns. Other research that examines mortality rates in FFS and MA is more generalizable since it includes those who enroll in MA without enrolling in FFS first. One such study found that the degree of favorable selection in MA decreases when examined over a longer time frame beyond the year of initial MA enrollment.64
Furthermore, spending differences between FFS and MA beneficiaries may be impacted by programmatic design rather than simply reflecting health risk. For example, beneficiaries in Medigap plans (explained further below) are more likely to include those who remain in FFS, since joining MA may affect their future Medigap eligibility. Medigap enrollees tend to be wealthier and have higher self-reported health status but also have higher FFS spending because their Medigap coverage reduces their cost-sharing expenses.65 On the other hand, MA’s lower out-of-pocket costs, supplemental benefits, and integrated coverage options may attract those with greater health care needs who nevertheless have lower FFS spending simply because they are underserved by the health care system. This disparity would overestimate favorable selection in MA.66 Indeed, a report commissioned by the Better Medicare Alliance has found that minority beneficiaries, who tend to have lower income and greater health risks, are more likely to enroll in MA than in FFS.67
Overall, coding intensity and favorable selection impact the relationship between plan payments and costs they bear. But there is also reason to be skeptical that they result in payments that are as high as what MedPAC estimates.68 To the extent favorable selection exists, updating the risk adjustment model that translates FFS costs into MA risk for diagnoses may be a better way to address it than changes to payment rates.
Policy Disparities Between MA and FFS
Benchmark calculations, supplemental benefits, quality bonuses, and risk adjustment increase MA expenditures, but comparing MA and FFS on the basis of aggregate costs alone does not account for their significantly different designs.69 The 2021 Milliman study found that spending on Part A and B benefits and administrative costs were 14 percent lower in MA than in FFS, even accounting for plans’ profits. Extra benefits and lower cost-sharing brought MA spending up to 99 percent of FFS costs per enrollee. (It also estimated that in a scenario where FFS costs are 5 percent lower than MA to account for unaddressed coding differences, MA costs would be 4.5 percent higher than FFS, and in a scenario where FFS costs are 5 percent lower to account for beneficiaries with only Part A or Part B, MA costs would be 5.4 percent lower than FFS)70 A 2022 study by Wakely Consulting Group, commissioned by AHIP, found that examining a comparable coverage population across both programs (i.e., those with both Part A and Part B benefits) would close the gap between MA and FFS spending by 5.9 percent. Adopting MA policies in FFS, such as a cap on catastrophic costs, would likewise increase FFS expenditures.71 Based on these studies and those cited in the previous section, MA appears to be more efficient than FFS in the provision of health care coverage even when accounting for the extra value it provides.
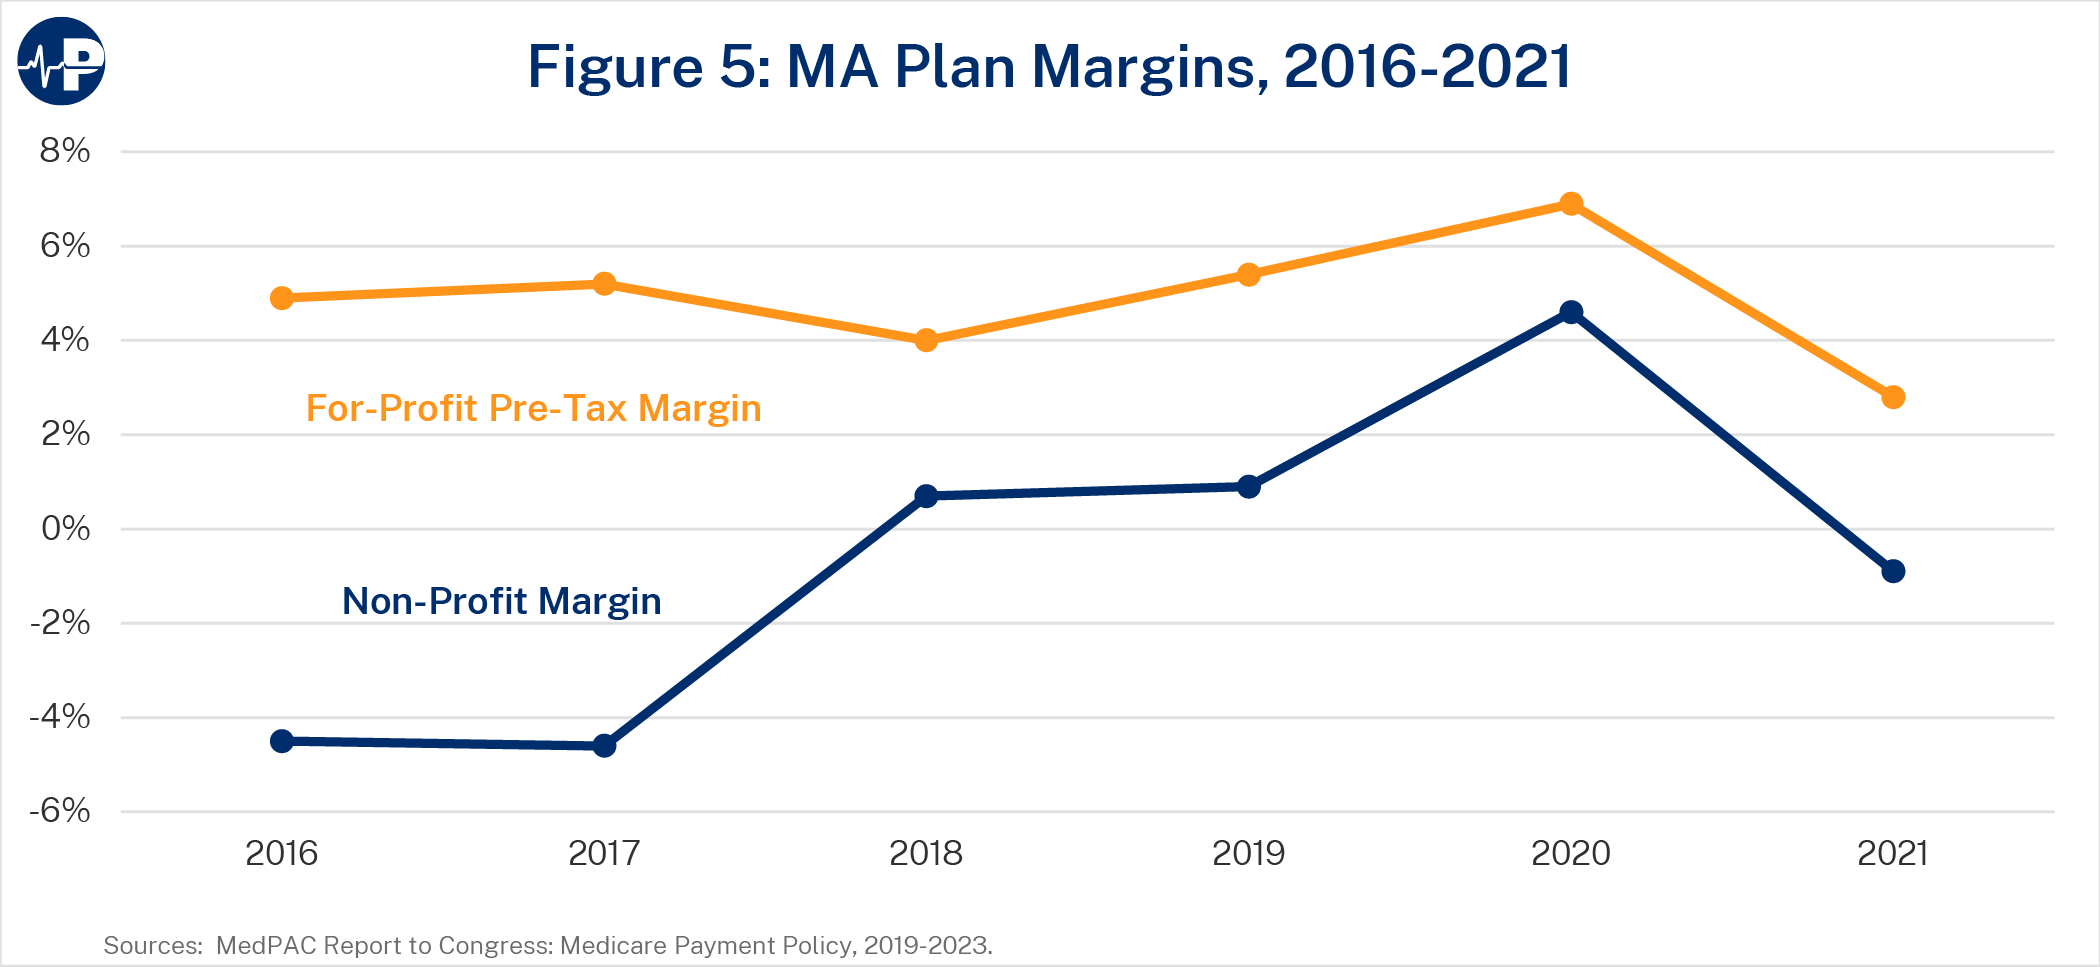
Some researchers argue that MA can offer more benefits only by obtaining generous subsidies.72 The fact that MA plans are private entities that receive government funding to manage federal benefits, and often aim to make a profit in the process, may explain some hostility toward the program. Profits do play an important role in MA: they encourage plan participation and can be a useful signal about the overall health of a market, access to a particular service, or the value added by providing that service. As Figure 5 below shows, average MA plan margins tend to vary by year and plan type, averaging about 4.9 percent among for-profit plans between 2016 and 2021. Gross margins per enrollee tend to be healthier in MA than in other commercial insurance markets.73 However, MA plan margins also tend to be far below Medicare profits of certain providers, which can sometimes exceed 20 percent.74 MLR rules also do not allow plan profits and administrative costs to exceed 15 percent of revenues. In addition, the CMS bid process includes annual parameters for plans’ gain or loss margins.75
Those who believe MA plans receive excessive government subsidies also tend to argue that Medicare’s structure puts FFS at a disadvantage because it is not legally able to offer the same benefits that MA can. But it is important to keep in mind that FFS’s inefficient structure already drives up MA costs and would do so even further if expanded in its current form. For example, measures that MA plans adopt to contain costs, such as utilization management or selective provider networks, are limited in FFS. This encourages greater FFS spending that in turn is reflected in MA benchmarks and higher payments to plans. The lack of risk-adjusted pricing in most FFS payment systems also misaligns incentives for accurate diagnostic practices across both programs, possibly exacerbating coding intensity.
Simply adding popular features of MA into FFS, such as new benefits or catastrophic coverage, would not improve parity between the two programs if FFS continues to lack any legal obligation or economic incentive to operate efficiently. While this paper recommends giving FFS more basic tools for program integrity and utilization management below, fundamental shifts toward accountable, value-based care have proven elusive and are difficult to accomplish in an FFS structure.76
Other policy changes to FFS may be worth considering, but would entail tradeoffs or restructuring that changes to MA should not be contingent upon. For example, some researchers believe that creating a unified cost-sharing structure for traditional Part A and Part B and a cap on out-of-pocket expenses would rationalize the disjointed design of FFS. However, in order to avoid significantly increasing costs through the addition of catastrophic coverage (which, as mentioned above, could increase FFS spending by 3.5 percent), such policies would need to increase the amount of out-of-pocket expenses that FFS beneficiaries pay below the cap.77 The scope of this paper is focused on more attainable changes to MA precisely because improvements in benefit design can occur without requiring difficult structural changes to FFS.
FFS also benefits from instances of advantageous policy treatment that do not apply to MA. One basic disparity is that new Medicare beneficiaries are automatically enrolled in FFS unless they actively choose MA plans. Behavioral economists have long observed that having a “default” option, such as with retirement savings plans, influences individual decisions.78 From this perspective, automatic FFS enrollment gives it more weight than it otherwise would have, even as more beneficiaries have migrated to MA over time. The proportion of new MA beneficiaries enrolling within their first year of Medicare rose from 18.1 percent to 24.7 percent between 2013 and 2019.79 Given that about half of all beneficiaries now choose MA despite automatic FFS enrollment and first-year MA enrollment is lower, it appears that more beneficiaries migrate to MA after gaining experience with FFS or learning about the benefits of MA. For existing MA enrollees, each year roughly 80 percent choose to stay in their same plans and about 90 percent choose to stay within MA in general.80 This level of satisfaction and natural sorting suggests that default enrollment in FFS artificially reduces MA enrollment.
The vast majority of FFS beneficiaries have additional wraparound coverage through employer health plans, Medicaid, or private supplemental Medicare plans called Medigap plans.
Beneficiaries purchase Medigap plans for an additional monthly premium. Starting in the early 1990s, Congress required standardization of Medigap benefits into 10 plan types with benefits that include lower cost-sharing (e.g., covering coinsurance for certain services), out-of-pocket limits, or foreign travel coverage. Medigap plans that cover the Part B deductible are not available to those who join Medicare in 2020 or later, but other forms of “first-dollar” coverage are allowed and enable enrollees to receive more care without cost-sharing.
Unlike other private health plans, such as in MA, Medigap plans are not subject to certain regulations such as guaranteed issue and community rating requirements, allowing them to charge higher premiums or deny coverage.
The favorable treatment of supplemental coverage options within FFS, such as Medigap plans, also affects the comparison between the two programs. These plans are described further in Exhibit 2 above. Roughly 41 percent of FFS beneficiaries purchase Medigap plans, while only about 10 percent of all FFS beneficiaries do not have some form of supplemental coverage.81 Given that Medigap plans are also private and offer benefits similar to those in MA—such as cost-sharing reductions or catastrophic coverage—it is more accurate to say that MA plans are directly competing with this combination of FFS and supplemental coverage rather than with FFS alone. However, because FFS and Medigap each require their own separate premiums, while MA plans often do not go beyond the Part B premium, this combination has more up-front costs for beneficiaries.
Despite their similarities, the requirement that MA plans provide core Medicare benefits forces them to internalize the full cost of care in addition to the cost of supplemental benefits they choose to offer. This incentivizes plans to economize their resource use through practices such as coordinated care and utilization management. Medigap plans do not directly bear the costs of basic benefits. Instead, Medigap plans’ coverage of FFS cost-sharing encourages beneficiaries to utilize more health services as they become effectively free at the point of consumption. This in turn increases FFS costs significantly: Studies have found that Medigap coverage increases FFS spending by 22-27 percent.82
CMS Regulations
Finally, the micromanagement of MA plans with burdensome regulations also negatively impacts the program. Numerous requirements constrict how MA plans operate and undermine the flexibility that allows them to control costs and maximize enrollees’ options. For example, practices such as prior authorization are unpopular with patients and providers and are sometimes subject to abuse or unnecessary denial of appropriate care. However, plan denials are relatively rare, the vast majority typically hold up in independent review, and when used correctly such policies can reduce utilization of low-value services.83
It makes sense, therefore, for policymakers to consider how MA regulations may indirectly lead to higher spending, both in MA and FFS. Continuing with the example of prior authorization: CBO estimates that legislative proposals to restrict or impose requirements on prior authorization by MA plans would increase federal spending by roughly $16 billion over 10 years.84 As mentioned previously, positive spillover effects resulting in part from MA plans’ care management and quality outcomes can benefit the entire program. For example, greater MA penetration is associated with shorter stays per hospitalization and may offset more than 10 percent of payments to plans.85 CMS could more explicitly account for these spillover effects in its policy analyses, similar to what it has done for ACOs.86
In light of the current policy debate around MA, researchers, interest groups, and policymakers have proposed numerous changes, with some simply advocating for cutting it or adding more restrictions. This section reviews some recent proposals that are aimed more at improving the program’s quality, sustainability, and parity with FFS. Table A in the Appendix summarizes the policies discussed below. The subsequent section outlines a separate, new list of policy recommendations.
Premium Support
A common feature of bipartisan Medicare proposals for years has been a “premium support” model. Under most configurations of premium support, the federal government provides a fixed subsidy to Medicare enrollees to purchase health coverage, with a federally run Medicare plan competing alongside private plans (typically MA plans or, in some cases, ACOrun plans as well, as proposed by James Capretta of the American Enterprise Institute).87 The premium support model would improve seniors’ ability to make price- and quality-conscious decisions for themselves in a competitive market.
The idea for premium support arose in the 1990s and was soon endorsed by a bipartisan commission for Medicare reform.88 It was later proposed in legislation by then-Congressman Paul Ryan and Senator Ron Wyden as well as former Senator Pete Domenici and former Clinton White House budget director Alice Rivlin. As with current MA payments, premium support subsidies could be risk-adjusted or even means-tested to vary by wealth or income. Michael Cannon of the Cato Institute and Jacqueline Pohida, a board-certified nurse practitioner, suggest making these payments a cash benefit that beneficiaries keep even if they do not use it to purchase coverage.89
The bipartisan political consensus around premium support has since eroded, making it less tenable in the near term.90 Robert Moffit of the Heritage Foundation suggests that more manageable MA changes in the near term could leave policymakers with the option to adopt premium support in the future.91
Benchmark Calculations
Many proposals would change MA benchmark calculations or even replace them with another system to set plan payments. MedPAC, for example, recommends changing the geographic and population components of the formula, removing statutory benchmark caps to improve consistency among market areas, increasing the rebate pass-through rate to at least 75 percent, and applying a 2 percent discount to MA payments for Medicare savings, as well as setting MA benchmarks using FFS spending only for beneficiaries with both Part A and Part B coverage.92 Chris Pope of the Manhattan Institute suggests allowing plans to provide 100 percent of their rebates to beneficiaries as supplemental benefits rather than requiring them to pay a significant portion to the federal government.93
Some have raised concerns that retaining a benchmark methodology based on FFS data is not sustainable in the long term as MA continues to grow, as a shrinking FFS population may cause benchmarks to be unstable or unrepresentative of the MA population. Incremental steps to address this might include incorporating MA cost data into an empirical benchmark, using broader markets to calculate benchmarks, or adjusting benchmarks by an administrative factor determined by Congress or CMS.94 The latter method would resemble the inflation adjustments in numerous FFS payment systems or benchmark methodologies of certain Medicare payment models, but it could make it difficult to provide accurate payments or contain cost growth over time. While MedPAC has discussed various approaches to adjusting MA benchmarks to account for growing penetration, it has not specifically identified any concerns with using FFS data that result from this trend. In the 14 percent of counties with fewer than 1,000 FFS beneficiaries, CMS already addresses concerns with data accuracy by using a “credibility adjustment” to blend in data from neighboring counties.95 Furthermore, CMS has repeatedly concluded that there is “no basis” for changing the MA payment methodology in Puerto Rico, where MA penetration is significantly higher than in the mainland United States.96
Another approach is to base MA payments on competitive bidding in each market area rather than using the calculated benchmark. Congress blocked previous attempts to test competitive bidding in Medicare+Choice, but early bids in a 1997 Denver demonstration showed potential savings of 25-38 percent.97 Medicare uses competitive bidding to set FFS payments for durable medical equipment and Part D prescription drug plans.98 Competitive bidding is often a feature of a premium support system as well, but these two policies are not synonymous: Competitive bidding establishes the level at which the government pays MA plans, while premium support entails direct subsidies to enrollees.99 Payment levels from competitive bids can also vary—for example, by setting them at the weighted average premium of plan bids, the second-lowest-cost plan, or the average of the three lowest-cost plans. This entails a trade-off between achieving higher government savings by picking a lower bid level and preserving rebates for supplemental benefits by picking a higher bid level.100 Some proposals suggest pairing competitive bidding (based on the average plan bid) with standardization of benefits relative to the actuarial value of FFS, though this could limit innovations in benefit design.101
Quality Bonus Program
Attempts at quality measurement are an increasingly common feature throughout the Medicare program, but it is not clear that influencing plan behavior based on federal metrics rather than consumer preferences actually improves value. In many ways, Medicare has negatively impacted overall health care quality by imposing ineffective, one-size-fits-all policies that are burdensome, gameable, and ineffective. Cannon and Pohida advocate for eliminating quality bonuses entirely and allowing competition to drive plan innovations in quality improvement.102 Indeed, many features of MA’s design, such as the use of populationbased payments where plans bear risk for enrollees’ total cost of care , already resemble features of value-based models.103
MedPAC recommends replacing the QBP with another quality program under a different design.104 The Bipartisan Policy Center would restructure quality bonuses as a budget-neutral funding pool rather than an increase in benchmarks and would streamline the measure set.105 More incremental changes to the QBP would be the elimination of double bonuses and the alignment of quality programs across Medicare.106 For example, CMS developed a demonstration to allow clinicians participating in certain payment arrangements in MA to receive payment bonuses available to those participating in advanced alternative payment models in FFS.107
Risk Adjustment
Many proposals would address the growing gap in risk scores between MA and FFS.
Some proposals would attempt to incrementally update CMS’s risk adjustment policies. For example, using two years of diagnostic data rather than one to calculate risk scores would reduce variation but also make them less responsive to changes in patient medical conditions. Excluding diagnoses derived solely from health risk assessments and chart reviews would reduce the addition of new diagnoses that do not necessarily lead to more treatment of MA patients, although this may incentivize otherwise unnecessary care simply to generate the records needed to justify such diagnoses as well as undermine the purpose of risk adjustment and capitation, which is to measure and pay for the risk being managed rather than pay fees for the costs of care. MedPAC estimated that these policies would account for about half of MA’s coding intensity and suggests that the remainder be addressed by raising the coding intensity adjustment.108 Expanding CMS audits of MA plan diagnoses and penalizing plans that report unverified diagnoses is another approach to policing risk scores that do not meet certain criteria.109
Another approach is to make underlying changes to CMS’s risk adjustment model. For example, using MA encounter data would theoretically measure MA enrollees’ costs for different risk scores directly and make a coding intensity adjustment unnecessary, as coding differences between FFS and MA would no longer translate into higher risk adjustment payments. While encounter data is already used to calculate the average risk scores of plans’ enrollees, the underlying model that estimates the relative costs of different diagnoses relies on FFS claims data.110 However, such a change could also significantly change the incentives for care coordination and risk selection by lowering risk adjustment payments for plans that are more efficient than FFS in managing certain conditions.111
More comprehensive changes to risk adjustment proposed by Moffit and Edmund Haislmaier of the Heritage Foundation would split it into two components. First, a prospective component would adjust payments based on enrollee age, sex, geographic location, Medicare eligibility category, and institutional status. Next, a retrospective component consisting of regional “risk transfer pools”—collectively operated by participating insurers and supervised by state insurance departments—would distribute revenues in a budget-neutral fashion in order to maintain a level playing field (e.g., compensating plans that attract a disproportionate share of costlier enrollees).112
Enrollment
As discussed above, many individuals deciding among multiple choices tend to remain with an automatic or default option. More Medicare beneficiaries might select MA if automatic enrollment were changed.
A premium support system that allows enrollee shopping among competing public and private plans would by default require an affirmative enrollment decision. It is also possible to go further and make MA the default choice for new Medicare beneficiaries given that it is becoming more popular than FFS. Some, such as Brian Miller of the American Enterprise Institute and former CMS director Gail Wilensky of Project HOPE, have advocated for automatically enrolling beneficiaries into a zero-premium health plan with an above-average star rating (3.5 or above).113
Other MA Policies
There are also numerous other MA changes proposed by recent studies. For example, the role of supplemental health plans (such as Medigap plans) in raising FFS costs has been a focus of policymakers for years. Proposals to restrict or impose a surcharge on Medigap’s first-dollar coverage of FFS cost-sharing have appeared in bipartisan legislation and budget proposals.114 Pope suggests that a surcharge should be equal to the excess costs they impose on FFS.115
Some proposals, such as Moffit’s, have also suggested expanding access to tax-advantaged savings accounts in MA. Removing the prohibition on specialized MA medical savings account (MSA) plans from providing prescription drug coverage, allowing them to receive rebates with which to offer mandatory supplemental benefits, and allowing enrollees to contribute to MSAs directly—similar to health savings accounts (HSAs)—could increase their popularity. Medicare beneficiaries with HSA-eligible plans could also be permitted to keep contributing to their HSAs or to roll over their HSAs or other MSA funds into MSAs.116
Other proposals would remove regulatory restrictions in order to expand MA access and allow it to operate more efficiently. Cannon and Pohida recommend the most comprehensive deregulatory proposal to remove restrictions on non-standard plan designs, enabling insurers to deviate from basic Part A and B benefits.117 Pope suggests policy changes aimed at improving MA plans’ ability to meet network adequacy requirements, including by expanding access to reinsurance arrangements, deeming non-contracting providers as in-network for rural plans, or establishing a baseline MA contract that providers would be required to accept as a condition of participation in Medicare.118
As the previous section demonstrates, there is a wide range of ideas for improving MA. This section recommends a package of policies to achieve greater overall parity between FFS and MA and remove restrictions on MA’s operations while converting the program’s relative efficiency into budgetary savings that are reflected in scorekeeping. Achieving these goals does not require fundamentally reimaging MA or Medicare in general. Such policies can lay the groundwork for a Medicare program that further expands choice and competition overall.
Despite MA’s advantages over FFS, there are important opportunities for improvements. Also, addressing the arguments made about MA’s relative costs and the obstacles to quality improvement in a measured way would help buttress the program against attempts to significantly alter its basic, sound approach. The recent enactment of price controls within the Part D program demonstrates these risks. Although Part D managed to keep its costs lower than expected through competition among drug plans, coverage gaps that translated to higher out-of-pocket exposure led Congress to enact major government interventions through the Inflation Reduction Act, which studies expect will reduce pharmaceutical innovation and worsen Americans’ health.119
It is important to avoid similar efforts to drastically cut or over-regulate MA, as that would weaken the program and stifle long-term improvement in Medicare. These recommendations are envisioned as a unified package of policies to avoid that outcome while delivering better care to seniors and protecting taxpayers.
Policymakers should aim to bring aggregate MA costs at or below FFS costs in a manner that is reflected by scorekeepers without hampering enrollment growth, increasing beneficiary costs, or compromising access to care. MA should save money for Medicare as it continues to grow, but such savings should come from improved efficiency or value and not reducing the quality of coverage. As Exhibit 3 discusses, the desire for budgetary savings should be balanced with the potential unintended consequences of excessive cuts.
In particular, because of the lack of fiscal controls on FFS, as well as default enrollment in FFS and the appeal of Medigap policies, Medicare beneficiaries have an incentive to stay in FFS, resulting in ever-greater expenditures and market distortions as outlined above. Therefore, it is important that changes to MA – particularly with respect to payment and its corresponding impact on premiums, benefits, and enrollment – do not undermine the opportunity for MA to drive competition and choice in Medicare and beyond by providing enrollees with coverage that suits their preferences and overcomes the incentives of FFS. Studies attempting to measure the degree to which changing payments correspond to changes in premiums, benefits, or plan profits have shown varying results, including variation by the competitiveness of local markets. This demonstrates the importance of an approach that is sensitive to different market conditions.120
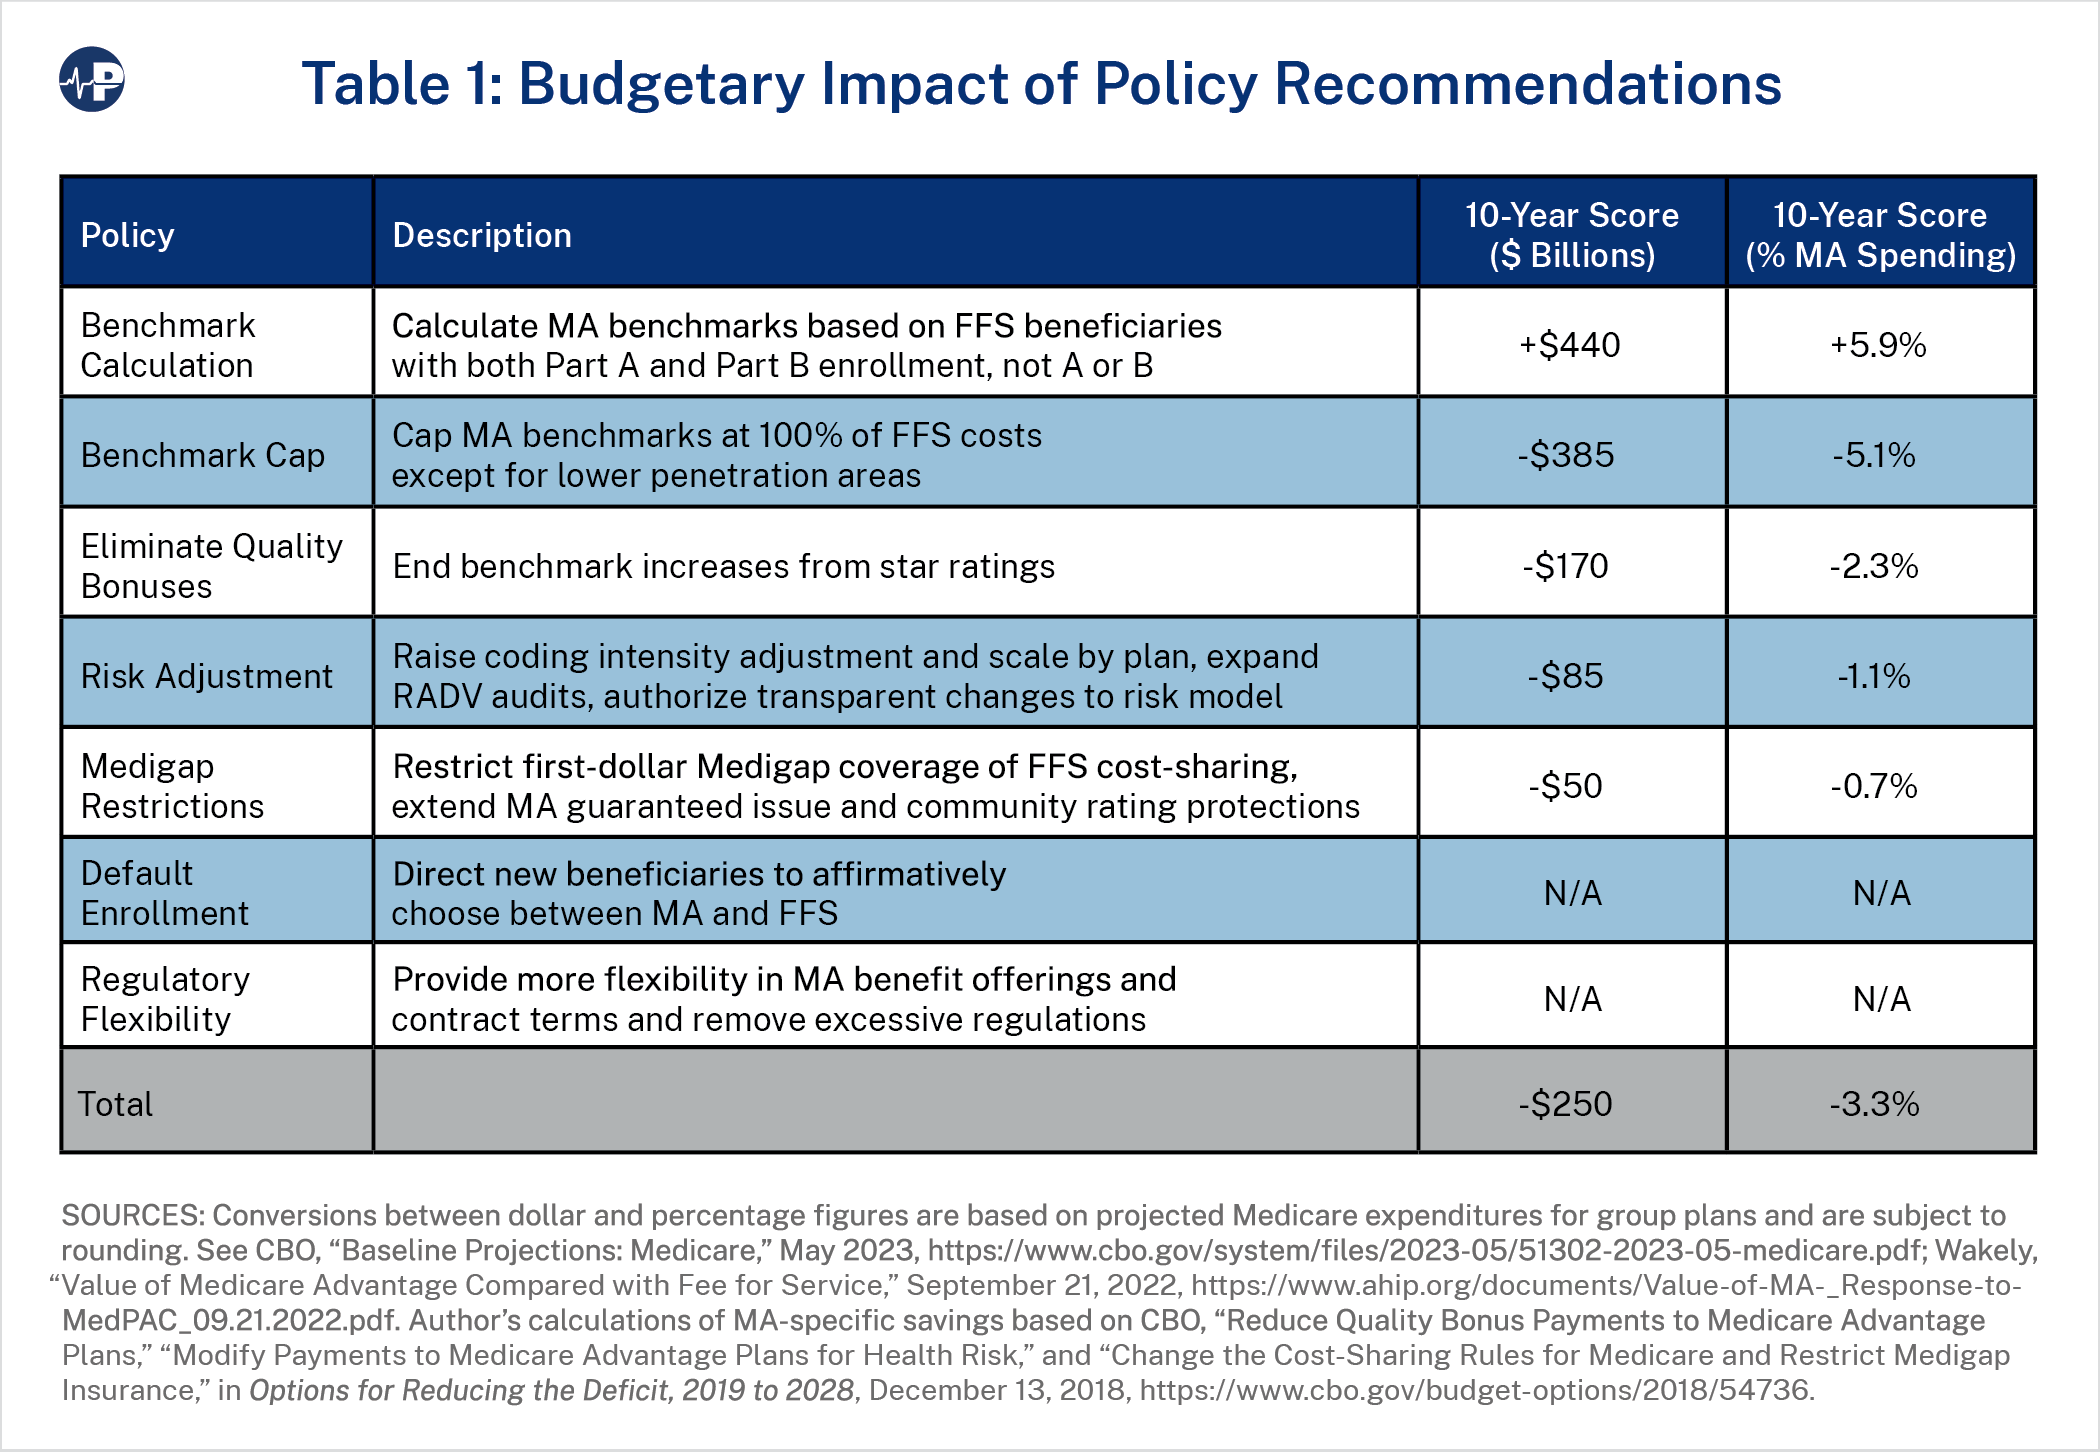
This paper’s recommendations would reduce MA spending on net by at least 3.3 percent, or about $250 billion over 10 years. Table 1 above summarizes the estimated budget impact of each provision. These estimates may not fully account for the overlapping or behavioral impacts of individual policy changes, including spillover effects related to MA penetration. As mentioned above, reports that analyze MA and FFS per-enrollee expenditures in a straightforward methodology that is simple for scorekeepers to adopt have found MA payments to be about 103 percent of FFS spending, so, under those calculations, this level of savings would bring MA spending at or slightly below parity with FFS for scorekeeping purposes.121 This would mean any future policies tending to increase MA enrollment would likely result in budgetary savings. However, modifications to some of these provisions (highlighted in the subsections below, with caveats in Exhibit 3) could modestly increase savings to address higher estimates of MA spending. Although recent analysis by MedPAC estimates far larger MA payments in excess of FFS costs by 23 percent (which, as previously argued, is probably too high), it is important to note that a significant portion of this figure is due to selection effects that would most likely be reduced by the benchmark, coding, enrollment, Medigap, and policy changes recommended below.122
Policymakers may approach many of the recommendations in this paper as dialable, meaning that the policy effect—especially budgetary savings—would change under different specifications. It is important to keep in mind the trade-offs that would occur by adjusting specifications to calibrate a specific level of budgetary savings. For example, changes that save more money for MA might also reduce the number of plan options for beneficiaries in a specific market or the available supplemental benefits. At the same time, it is important for MA to operate as efficiently as possible. Ideally MA growth would decrease Medicare spending.
Furthermore, provisions that save money should be coupled with policy changes that enable plans to focus on delivering better coverage rather than managing regulatory compliance costs. The ultimate goal of any changes in MA policy should include both budgetary savings and also creating a vehicle for high quality and sustainable coverage.
Adjusting Medicare Advantage Benchmarks
One major issue regarding parity between MA and FFS is the benchmark calculation methodology, which Congress can take a few simple steps to improve. As discussed above, the MA benchmark population does not align with the MA enrollee population, as it is based on those with either Part A or Part B, while plans must provide both Part A and Part B basic benefits (and often cover more). Because the current population used to calculate the benchmark has lower average costs, it artificially lowers MA payments. Therefore, Congress should direct CMS to calculate benchmarks based on FFS costs of beneficiaries who have both Part A and Part B. Wakely estimates that this change would increase MA payments by 5.9 percent (roughly $440 billion over 10 years).123 That figure is premised on the most straightforward way to enact this change, which would be to simply eliminate the total costs of beneficiaries with only Part A or Part B from benchmark calculations
Changing the benchmark population would increase MA spending, but other benchmark changes would offset this. MA’s higher benchmarks of 115 percent and 107.5 percent of FFS spending for plans in certain counties embed higher spending in the program, even before other adjustments. Congress should reduce these benchmarks so that they do not exceed 100 percent of FFS costs. Market areas with benchmarks at 95 or 100 percent of FFS costs under the current system would see no change. The current benchmark system was designed in part to encourage more access to MA plans. Now that MA has proven to be popular and sustainable, it makes sense to limit those policies to areas where access problems persist.
To avoid compromising beneficiary access to MA plans or supplemental benefits by excessively reducing benchmarks, as well as avoid limiting the positive spillover effects that MA enrollment has on the rest of the program, Congress should include an exception for plans in market areas with low MA penetration in terms of the share of overall MA enrollment as a percentage of eligible Medicare beneficiaries. This exception would apply to the lowest quartile of counties in terms of penetration rate, which currently encompass about 5 percent of beneficiaries. The share of beneficiaries living in areas exempt from this new benchmark policy would be even smaller, as the higher benchmarks under the current system (i.e., standard benchmarks of 107.5 percent and 115 percent) would apply only to counties with below-median FFS costs. Counties with above-median FFS costs receive standard benchmarks of 95 percent or 100 percent and therefore would be unaffected by the policy change. In order to avoid cliff effects and increase stability year over year as enrollment changes, CMS should calculate some or all of the payment for plans in low penetration markets under current benchmark rules, with the new benchmark methodology blended in until they reach a threshold penetration rate. Alternatively, MA could fully transition to this new benchmark system but allow beneficiaries in low-penetration markets to access more benefits through plan rebates. In either case, such exceptions would slightly lower potential budgetary savings. Capping benchmarks at 100 percent of FFS spending, with the exception of counties in the bottom 25th percentile of MA penetration rates, would save an estimated $385 billion over 10 years (5.1 percent of MA spending). Capping benchmarks at a lower level, such as 99 percent or 95 percent of FFS spending, would increase savings to about $440 billion and $660 billion, respectively, although these decreased levels would warrant other changes such as a broader exception and policy phase-in period.124
Overall, the design of these benchmark caps would make MA more efficient and, coupled with the other policies identified in this paper would likely not significantly alter enrollment trends. CBO estimated that reducing benchmarks by 10 percent (which would bring average benchmarks from roughly 109 percent to 99 percent of FFS costs, per MedPAC’s estimates) would save $405 billion over 10 years but that the resulting decreases to rebates and supplemental benefits would slow MA enrollment growth. This would in turn increase spending by $13 billion so that the net impact of this policy change would be $392 billion.125 The benchmark caps proposed in this paper would have a comparable effect on overall average benchmarks but be focused on higher benchmark counties. Thus, they would likely not have the same impact on enrollment as an across-the-board cut because plans receiving higher benchmarks would see the most impact and lower penetration markets would be exempt. Importantly, the benchmark reductions would be paired with other changes to improve the accuracy of benchmark calculations, limitations on administrative actions such as coding intensity adjustments, increased MA plan flexibilities, as well as changes to address the impact of default enrollment in FFS. It is important to note that CBO believes that increasing the magnitude of benchmark reductions would likely yield lower marginal savings, as they would cause more plans and beneficiaries to exit MA, which reduces the potential savings from this policy.
These benchmark changes would improve parity and fiscal sustainability, but the inherent flaws of administratively setting prices through federal agencies would remain. Some policy experts suggest that market-based methods, such as competitive bidding by MA plans, would be a better way to set MA payment levels. But this would exacerbate disparities in policy treatment between FFS and MA as currently constituted, because FFS provides an uncapped entitlement with administratively set prices. Absent reforms to require FFS to be more cost effective, MA plan bidding that leads to less generous benefits for enrollees would exacerbate this disparity, in part because plans would be expected to cover more benefits, including catastrophic coverage, at even lower cost. One 2018 study estimated that basing benchmarks on the average plan bid would reduce MA enrollment by 4-5 percent, depending on the level of decline in bids, even if the actuarial value of MA benefits exceeds that of FFS.126 In the short run, keeping the link to FFS costs yields savings while maintaining MA benefits, but over the long run, policies to require more efficiency in FFS and test MA competitive bidding demonstrations can enable a future departure from such benchmarks.
Moving Past the Quality Bonus Program
Policymakers should also address other features of MA that drive up spending without improving the quality of the program. Given the tenuous relationship between star ratings and actual quality, quality bonus payments should be eliminated. Congress should approach this gradually by first eliminating double bonuses, which are outdated and available to only a small number of plans in already successful markets. Only 7 percent of counties receive double bonuses, but plans in these areas account for 27 percent of MA beneficiaries, leading to a disproportionately significant spending impact.127
Benchmark increases based on star ratings increase costs and distort plan and consumer behavior, but they do not meaningfully measure plan quality. If MA continues to have star ratings, Congress could redesign them to focus on core metrics identifying health outcomes and objective measures of patient experience. The purpose of CMS star ratings would not be to adjust benchmarks based on a government definition of value but to allow patients, plans, and others to easily compare quality among plans, as they were originally intended to be. Enrollees already gravitate to higher rated plans, showing that there is a desire to vet plans on the basis of quality, but the current system does not effectively achieve this. Eliminating double bonuses would reduce MA spending by roughly $33 billion over 10 years, while eliminating quality bonuses entirely would reduce it by about $170 billion (0.4 percent and 2.3 percent of MA spending, respectively).128
Policymakers may also consider changes to the rebate pass-through rate that result from star ratings. These could be set based on some other factor or, to remain budget neutral, set at some single point between the current 50-70 percent rates. Allowing plans to retain a higher percentage of the difference between their bids and the benchmarks could increase MA enrollment and benefit generosity but would likely increase government spending.
Approaches to Addressing Coding Intensity
Besides changes to benchmarks and quality bonuses, addressing coding differences between MA and FFS would also be an important step toward increasing MA’s efficiency. Currently, the coding intensity adjustment is a statutory minimum payment reduction that CMS can impose. A simple approach would be for Congress to specify a range for this adjustment with both a minimum and maximum. However, the current adjustment is a blunt instrument: Coding practices differ among plans, and using a single across-the-board reduction to offset the entire estimated average risk score differential between MA and FFS could reduce access to certain plans. An alternative approach would be to tier the coding intensity adjustment based on differences in coding aggressiveness and outlier risk scores among plans.129 Combining these approaches, CMS would decide on an average coding intensity adjustment amount and scale the payment reductions within the allowable range established by Congress according to changes to the risk scores of beneficiaries who switch from FFS to a given plan within a given region over time.130 This approach may be more complicated for CMS to apply, as it would have to rely on older data (as is currently the case in cost-based FFS administrative payment systems) and may penalize plans that are delivering greater value to patients by uncovering actual health risks. There is also evidence that policies to discourage coding intensity in traditional Medicare—such as excluding upward growth to beneficiary risk scores in ACOs from risk adjustment—discourage entities from taking on higher-risk beneficiaries.131 This is why policies to address coding intensity could be cautious and only modest increases to the statutory adjustment—along with an upper limit to prevent excessive cuts to MA beneficiaries—would be warranted.
There are other potential approaches that would not require applying a direct reduction on risk adjustment payments. The most promising option already in progress is using CMS’s risk adjustment data validation (RADV) program to recover overpayments when patient medical records cannot confirm plan-reported diagnoses. These audits offer a check against aggressive coding practices. CMS recently finalized a rule that sensibly allows for the collection of overpayments based on the extrapolated rate of coding error rather than only recovering payments discovered from the audited sample. Congress should adopt transparent guidelines for extrapolation by CMS in its audits for improper payment recoveries and any additional penalties imposed on top of that. Increased monitoring of diagnostic practices and extrapolated recoveries would increase the accuracy of MA coding by better aligning them with documentation from patient visits to their providers. To increase parity in treatment between MA and FFS, Congress should further direct CMS to implement similar auditing policies in FFS. Longer-term changes to apply or modify risk adjustment policies within FFS could also help align incentives and diagnostic practices to help CMS calculate risk scores for both programs more accurately and comparably.
CMS could also update its underlying risk model administratively, making the coding intensity adjustment less necessary. CMS’s own analysis has shown that this is possible. For example, CMS’s decision in the 2024 rate announcement to phase in the removal of a significant number of diagnosis codes (rather than implement the change all at once, as proposed in the advance notice) led to an increase in the estimated increase in risk scores by about 1.14 percent between the advance notice and final rate announcement.132 This suggests that changes in the risk model can directly impact the level of coding intensity. At the same time, Congress should require CMS to make risk model updates through notice-and-comment rulemaking, with transparency standards that enable more public input on the underlying rationale and data behind such decisions.
Cautiously pursuing multiple approaches to controlling risk adjustment payments legislatively and administratively can mitigate unintended consequences in risk adjustment on the one hand while maintaining its necessary purpose on the other hand. CMS estimates that its recent changes to RADV audits allowing for extrapolated recovery of overpayments would save only about $4.7 billion over 10 years, but expanding their scope—such as auditing more contracts and adding penalties on top of recoupment for overpayments—would increase those figures.133 Modestly increasing the coding intensity adjustment from 5.9 percent to 8 percent on average, scaled by changes in risk scores by plan by region within a range specified by Congress, would save roughly $85 billion over 10 years (1.1 percent), although setting this average at a higher level or using a different methodology to calculate current coding intensity levels could increase these estimated savings.134 Changes to RADV audits, auditing and risk adjustment policies in FFS, and changes to the underlying risk model would impact total savings as well.
Fair Treatment for FFS Supplemental Coverage
Restricting first-dollar coverage of FFS cost-sharing by supplemental Medigap plans, would reduce regulatory disparities within the Medicare program. Such coverage significantly increases overall FFS spending and, in turn, inflates MA benchmarks by encouraging unnecessary utilization of health services. Congress should allow Medigap plans to cover cost-sharing only after beneficiaries have reached a specific threshold of out-of-pocket costs. Addressing these economically distortionary and inefficient plan designs would not require underlying changes to the FFS benefit structure. Beneficiaries who want to reduce their cost-sharing may decide to enroll in MA, where basic and supplemental benefits, as well as lower costs, are integrated into a single plan that does not require purchasing a separate policy with an additional premium payment. Those who want to remain in FFS would still be able to purchase Medigap plans, which would have lower premiums when they can no longer cover first-dollar cost-sharing. Restricting Medigap first-dollar coverage by Medigap plans would save roughly $50 billion over 10 years (about 0.7 percent of MA spending).135
Directing New Enrollees to Choose Coverage
MA has thrived despite certain policy obstacles, the most basic of which is the default assignment of new Medicare beneficiaries into FFS. Many new Medicare enrollees may not be aware of their coverage options. Therefore, the enrollment process should direct them to affirmatively choose between the two programs. Congress should facilitate a more intentional decision-making process by requiring CMS to inform prospective beneficiaries of the MA plans available in their areas make useful changes to the Medicare enrollment timeline for new beneficiaries. CMS could also make some of these process changes administratively without changing default enrollment. Other conforming policy changes would be needed to effectuate this policy as well, such as extending Medigap guaranteed issue policies to those who voluntarily switch from MA to FFS.136
For those unable to decide prior to enrollment, Congress could take a few possible approaches. CMS could assign beneficiaries who cannot meet an enrollment deadline to FFS after a certain period of time or permit Medicare-eligible patients to retroactively enroll in FFS when they use health care services if they have not already made election decisions, similar to how Medicaid patients can receive retroactive coverage.137 Congress could also begin automatically collecting premium payments from Social Security checks, as under the current system, to avoid creating an incentive for inaction in the enrollment process. Although others have suggested implementing default MA enrollment, CMS would face challenges in choosing the right MA plans for these individuals as a default option (particularly those with specialized care needs) or deciding what package of supplemental benefits would be more attractive to them. Indeed, patient choice is the main hallmark of MA. CMS can also test methods of automatically assigning beneficiaries to MA plans that minimize disruption for those with existing provider relationships or identifiable needs. For example, some states have experience automatically assigning Medicaid enrollees to private managed care plans.138
Benefit Offerings and Contract Terms
Expanded access to additional benefits is also an important feature of MA, but there are still policies that present obstacles to beneficiaries receiving comprehensive, integrated coverage from their plans. To address this, Congress should remove limits on what services MA enrollees can access. For example, all beneficiaries, even those in MA, must receive hospice benefits from FFS (except for those in MA plans that are participating in certain demonstrations), leading to fragmented care coordination and financial responsibility. Although there is no requirement for MA enrollees to switch to FFS in order to access hospice benefits, those in the last year of their lives are significantly more likely than others to disenroll from MA, and about half of such switchers are hospice users.139 One Medicare demonstration allows participating plans to offer hospice benefits, and is associated with increased care quality, lower plan bids, and lower plan premiums. Although uptake has been limited, the findings from this demonstration suggest that there can be benefits to allowing plans to offer hospice benefits.140
Additionally, an enrollee in an MSA plan currently cannot receive integrated prescription drug coverage or free preventive services from the same plan. Allowing these benefits would not require benchmark or rebate policies to change for the vast majority of MA plans, nor would it require coverage of these services, so costs would not increase for MA beneficiaries who do not select plans with these added benefits. Removing these limitations would allow enrollees more flexibility and would be a starting point for greater access to MSAs and potentially HSAs for MA enrollees, both of which would make the program more consumer driven.
CMS regulations also forbid MA enrollees from seeking non-standard benefit designs that may be a better fit for specific use cases. CMS should test a demonstration allowing certain plans to offer contracts with terms that are longer than the standard 12 months under a limited set of circumstances and as part of this can assess the potential impact on risk selection in plan enrollees. Longer-term contracts could encourage plans to build deeper care coordination relationships with their enrollees based on long-term health needs and to better manage chronic conditions. Long-term contracts would formalize or build on existing consumer behavior, as nearly 90 percent of enrollees renew their plans anyway.141
Other Recommended Policies
Other policy changes would have smaller or ambiguous budgetary impacts but would make the MA program more effective and would further improve parity between MA and FFS. CMS may implement some of these policies administratively, but Congress enacting them on a permanent basis would provide greater certainty and maximize the positive impact for beneficiaries.
Congress should require more alignment of regulatory treatment of MA and FFS. One major way to accomplish this is to apply similar budget neutrality requirements to agency rulemaking and administrative actions in MA, such as the annual rate notice. In FFS, multiple payment systems undergo major regulatory changes on an annual basis, but outside of inflation adjustments CMS cannot finalize policy changes that significantly increase or decrease overall net program spending, which requires offsets of excess costs or savings that policy changes cause. While this paper’s recommended policies would deliver net MA savings, there should be limits to what the executive branch can do unilaterally so that CMS cannot impose large costs or inflict excessive cuts on MA beneficiaries. This guardrail would align CMS’s administrative powers in FFS and MA and improve their predictability.
Alignment of program integrity policies for providers seeing either FFS or MA patients would also make sense, potentially leading to reduced waste by deterring improper billing and removing any incentive to discriminate against Medicare beneficiaries based on their enrollment. Furthermore, Congress should authorize FFS to adopt policies taken up by most MA plans, such as coverage or utilization management policies for certain services at high risk of improper payment, which would align practices between the two programs and limit improper or inappropriate utilization and fraud. Recovering payments through investigations and audits by federal agencies and contractors—particularly without extrapolation from wrongdoings detected in a sample—requires a “pay and chase” approach that is resource-intensive and cannot detect all improper payments from accidental violators or bad actors. Expanding pre-review in certain cases can reduce the need for such activities at the outset of service delivery.
The disparity in regulatory treatment also occurs for private insurance policies outside the Medicare program. Medigap plans are not subject to the same community rating or guaranteed issue requirements as MA plans, and therefore enrollees may face different premiums if they have pre-existing conditions, or they may be unable to purchase coverage at all if they switch from MA to FFS. This is not the case for those purchasing MA plans. Congress should apply the same rules to both MA and Medigap plans.
Congress and CMS have also enacted numerous policies that increase the government’s role in managing MA. MLR and network adequacy rules, for example, attempt to direct plan activities at a macro level with largely arbitrary and burdensome requirements that do not improve the program. Some incremental improvements would be to increase reporting and compliance flexibilities, such as by further increasing plans’ ability to meet network adequacy requirements in rural areas by offering telehealth coverage. CMS also imposes rules that attempt to directly manage care delivery or plan governance. For example, it requires plans to establish committees to review internal policies such as utilization management, which goes beyond merely regulating abusive prior authorization practices. Some regulatory efforts may be well-intentioned, such as trying to reduce aggressive and misleading marketing tactics. But policymakers should scrutinize and potentially remove more paternalistic or bureaucratic policies. Generally speaking, plans should be allowed to discern and address the needs of their enrollees in response to consumer preferences rather than worry about the procedural priorities of federal administrators.
MA already better aligns with the core principles for Medicare discussed in the first part of this paper than does FFS. This proposed package of policy changes would further improve the program with respect to each principle:
MA gives beneficiaries more choices among coverage options. Its continued growth therefore make Medicare more patient-centered. Policies to encourage an affirmative decision between MA and FFS, remove benefit restrictions, and test new contract designs would advance patient control over their health care decisions.
The prevalence of government price controls and distortionary subsidies in Medicare makes it harder for patients to directly weigh the value of care. Enabling beneficiaries to shop for coverage in MA is already an improvement in terms of providing more control over financing. Ending ineffective quality bonuses would reduce government attempts to define the value of health care and micromanage its practice. Expanding plan and beneficiary flexibilities, such as enabling greater access to MSAs and other savings accounts, would provide patients with even more choice and control over health care financing.
MA plan competition and cost management more directly reflects the economic value of health care services than FFS. Removing payment distortions—such as the unequal treatment of Medigap plans, inaccurate MA benchmarks, and gameable risk adjustment policies—in a balanced way would also promote more reasonable and sustainable pricing of health care services.
Finally, MA plans can help manage financial risk and ensure quality. Capitated payments and enrollee choice are strong tools incentivizing them to do this. But with excessive regulation—such as requirements to report unhelpful quality metrics or comply with restrictions on plans’ business operations—the government attempts to take on these roles itself, which it is unsuited to do. Allowing plans to respond to consumer preferences would improve the value of coverage for beneficiaries by minimizing costs and maximizing quality.
The changes that MA has fostered in the Medicare program overall have been transformational. It has shown how competition and choice can reduce health care costs, offer higher quality coverage, and present a more patient-driven alternative to the government-driven model of FFS. That rigid FFS model has become more outdated over time and instills numerous failures of central planning—including inaccurate and politicized price controls, bureaucratic obstacles to innovation, and a paternalistic mentality that limits patient autonomy.
MA’s popularity has grown, and policymakers now know much more about its value. They also have more information about how to improve it further. At its root, MA’s challenges mirror those of FFS: how to provide the best quality care in a fiscally sustainable manner. Opportunities to improve and protect MA for beneficiaries by addressing government policies that distort plan incentives can make that goal more attainable.
Numerous policy approaches have been offered in recent years, but this paper’s package of recommendations is a relatively straightforward, attainable, and effective way to enable MA to transform Medicare as a whole. Giving beneficiaries clear choices, ensuring payment and regulatory parity, and harnessing MA’s efficiencies would allow its organic growth to be a vehicle for improving American health care.