
Joe Albanese
Joe Albanese is a Senior Policy Analyst with Paragon Health Institute. He comes to Paragon with several years of federal…
Reforming Government. Empowering Patients.
Navigation
This paper discusses the Medicare Access and CHIP Reauthorization Act of 2015 (MACRA), noting its failure to significantly improve Medicare quality, with its Quality Payment Program (QPP) adding burdens without fostering quality improvement or savings, indicating the need for a more effective long-term Medicare clinician payment reform.
This paper provides background on the enactment and implementation of the Medicare Access and CHIP Reauthorization Act of 2015 (MACRA), which made significant changes to clinician payment in Medicare. It also highlights some of the shortcomings of the law and the Quality Payment Program (QPP) it created. While MACRA’s goal of moving Medicare beyond fee-for-service and towards paying for value was reasonable and broadly popular, its enactment has not transformed the quality of Medicare services as promised. Instead, the QPP has prioritized centralized federal measurement rather than the experiences of patients themselves as the primary determiners of value. Medicare’s reporting requirements and alternative payment models have not fostered quality improvement; rather, they have added burden, and the latter have also failed to deliver savings. Congress and the executive branch have been forced to make changes and exemptions to MACRA, but a long-term reform of clinician payment in Medicare is needed.
Health care expenses have long been a major concern for American households and the federal government alike. The Medicare program’s focus on the elderly and disabled make it particularly susceptible to high costs. Its relatively vulnerable beneficiary population has also made the underlying value of these health care services a central consideration of policymakers overseeing the program.
For years, policymakers have attempted to contain costs and find ways to measure and improve the quality of care—with mixed results. A major part of this effort was the enactment of the Medicare Access and CHIP Reauthorization Act of 2015 (MACRA), which overhauled the payment of clinicians within Medicare Part B by attempting to make them more accountable for their performance. This step reflected a growing consensus that Medicare’s existing fiscal guardrails were not working and that it was time to start moving the program beyond its archaic system of paying for the number of services delivered rather than their underlying value. However, MACRA failed to resolve many problems and revealed new ones, some of which were identified before the bill was passed and others that became clearer as it was implemented (or altered) in the ensuing years. This paper provides a brief overview of the history of physician payment in Medicare, an overview of the structure of MACRA and its Quality Payment Program (QPP)—both as it was originally written and as it was actually put into practice—and a review of its shortcomings. The goal of this paper is to serve as a resource for analysts and policymakers wishing to understand the current state of physician payment in Medicare and identify potential areas of reform.
When Medicare took effect in 1966, it transformed the practice of medicine in the United States. A simple question—how much to pay doctors—had crucial implications for participation in the new program. At the start, Medicare paid “customary, prevailing, and reasonable” fees calculated at a local level. Doctors also did not have to accept the Medicare payment as the full payment amount and could balance bill patients.1 This was in part due to the political power of medical providers, who were concerned that the program would lead to a more socialistic, government-controlled health care system that would limit their fees.
Establishing a payment system that centered on the role of government and industry rather than patients at such an early and decisive moment for the program proved to be foundational. Medicare made little attempt to ensure the cost of providing care was commensurate with its value to patients. Soon, high costs became a major, perennial concern as doctors’ fees quickly climbed. In fact, in the year between enactment of the legislation in 1965 and its full implementation, the fees charged by physicians more than doubled.2
To respond to escalating costs in the program, in 1972 Congress authorized Medicare to disallow “any costs unnecessary for the efficient provision of care” and place limits on prevailing charges.3 In 1989, after freezing physician pay for several years, it authorized a fee schedule that based clinician reimbursement on the resources needed to provide care.4 Throughout the 1990s, Congress attempted to control costs by setting an overall expenditure target that lowered payment growth when it exceeded the prior year’s target—first through the Medicare Volume Performance Standard, which based targets on per capita economic growth, then with the Sustainable Growth Rate (SGR) in 1999, which incorporated historical growth.5
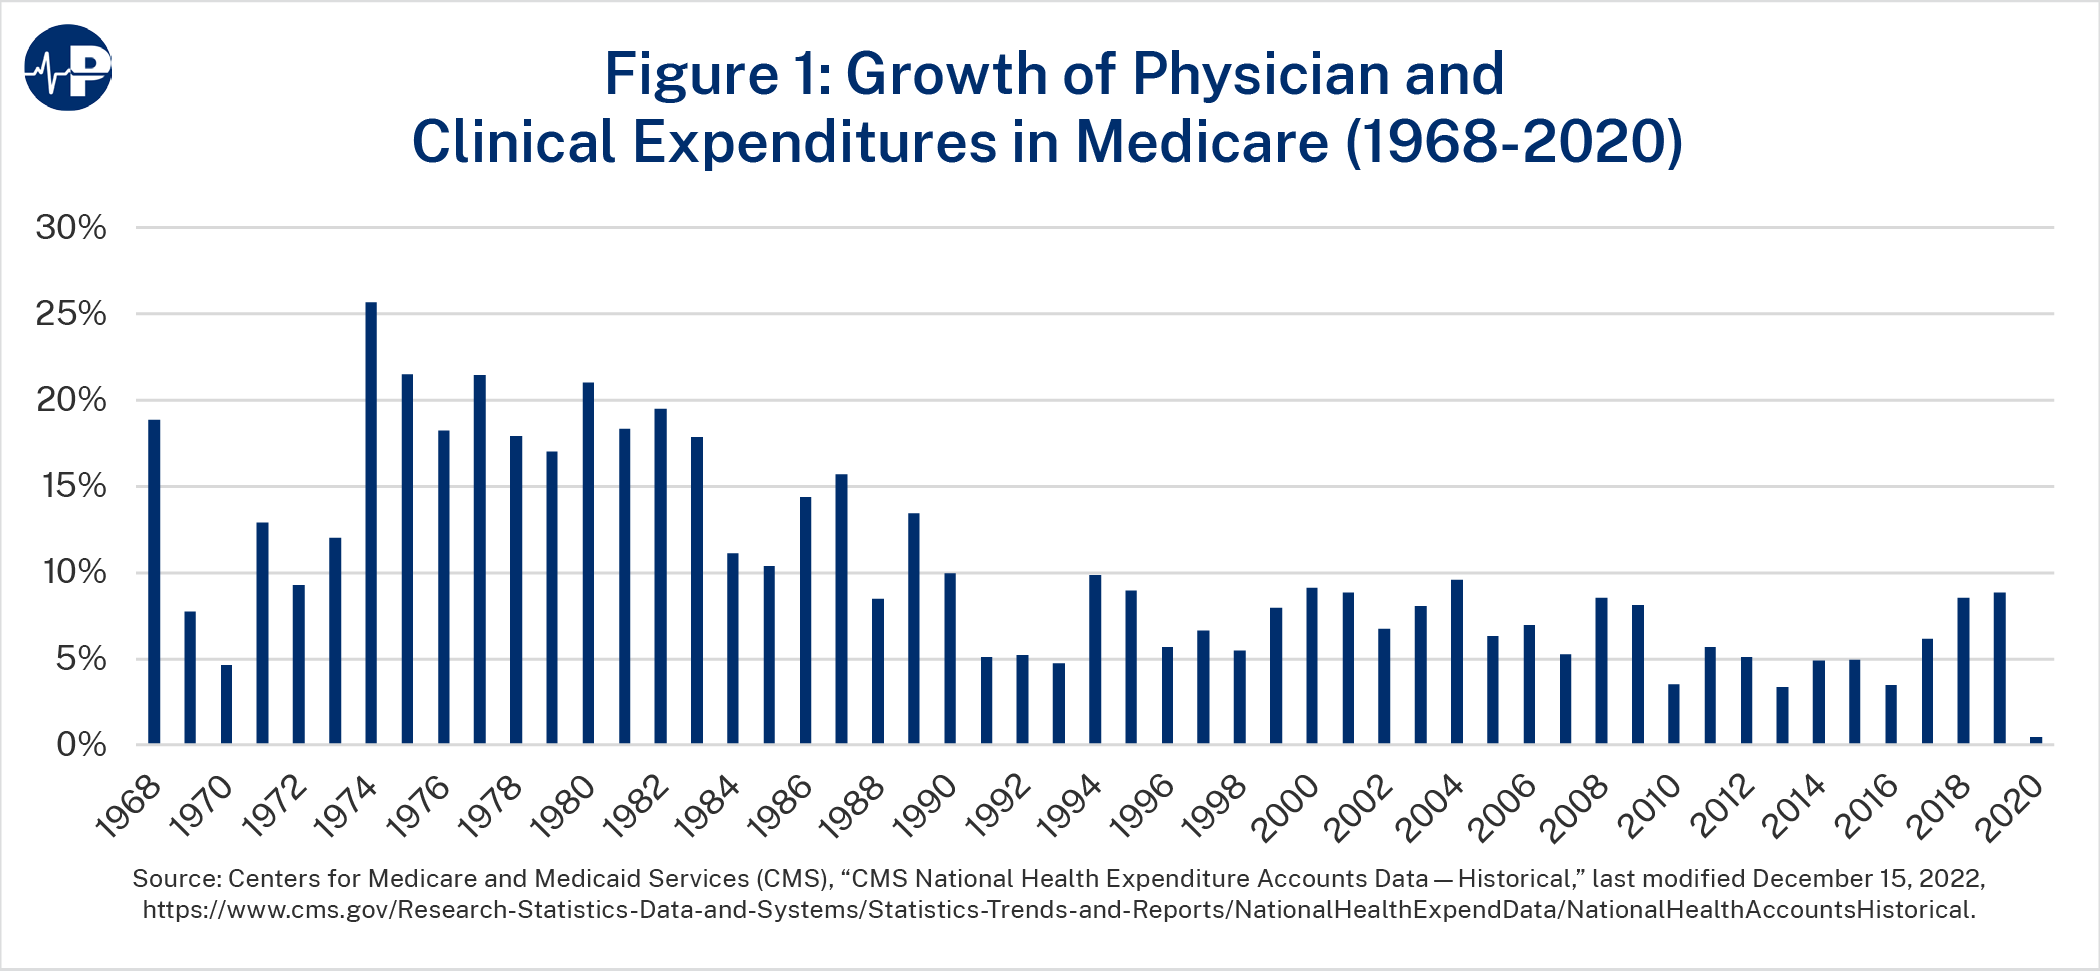
These efforts bore some fruit: Medicare spending growth on physician and clinician services fell from an average of 16.1 percent per year in the 1970s to 7.0 percent in the 1990s. Such increases still ballooned spending from $1.6 billion in 1970 to almost $60 billion in 2000. Further progress on cost containment stalled throughout the 2000s as these expenditures grew by 7.4 percent per year on average.6
In theory, the SGR would automatically keep costs down. In practice, even though payments consistently exceeded the SGR target, Congress overrode the mandated reductions every year after 2002 (when a 4.3 percent cut would have gone into effect). These routine “doc fixes” often required finding other health care savings as offsets but enabled clinician payment increases to continue.7 By 2015—17 doc fixes later—the cut required by the SGR grew to 21.2 percent.
Frustration with continual doc fixes led Congress to seek an alternative approach. The cumulative reductions had grown unwieldy, and some clinicians objected to applying cuts across the board rather than in areas of higher growth.8 As a result, Congress passed MACRA by wide bipartisan margins.9 MACRA permanently repealed the SGR and mandated a schedule of annual clinician payment updates intended to get spending under control. More fundamentally, MACRA also aimed to transition Medicare away from its traditional fee-for-service (FFS) system toward one that delivers higher value to beneficiaries. Under FFS, health care providers receive payment based on the volume of services they furnish, regardless of the quality of that care. This creates a strong financial incentive to inefficiently provide more services, harming Medicare enrollees as well as taxpayers.
In an attempt to combat these problematic incentives, MACRA instituted the QPP. QPP offers clinicians adjustments to their Medicare payments from participating in one of two alternative tracks. The first is the Merit-Based Incentive Payment System (MIPS). Clinicians can either obtain an exemption from MIPS or participate in advanced alternative payment models (APMs). Almost 240,000 clinicians were qualifying participants in advanced APMs in 2020, compared to over 930,000 in MIPS.10
MIPS
MIPS was designed to encourage higher-quality care among clinicians by adjusting payment based on performance metrics. This included consolidating existing quality programs and relaxing their pass/fail structure that doctors considered overly strict.11 MACRA set up four measurement components to calculate a composite MIPS score out of 100:
The Centers for Medicare and Medicaid Services (CMS) sets payment adjustments in a given payment year based on performance in these categories from two years earlier (i.e., clinicians’ payment adjustments in 2019 are based on their score in performance year 2017). CMS also sets an annual score threshold. Clinicians who fall below the threshold receive a negative payment adjustment, while those above it receive a positive adjustment.
The hope was that financial rewards or penalties would incentivize clinicians to be more attentive to patient outcomes, such as by reducing readmission rates or electronically transmitting prescriptions. The “MACRA’s Challenges” section below provides more information about how this system has worked in practice.
Advanced APMs
As their name implies, APMs offer payment structures that differ from traditional FFS Medicare. They are intended to incentivize high-quality and cost-efficient care from participating providers rather than simply pay for volume of services. Current law permits the CMS Innovation Center to waive Medicare requirements to test new models, allowing it to offer more flexibility to participants than otherwise exists in FFS. The Innovation Center has designed models that apply to specific health conditions, care episodes, provider types, and populations.
Advanced APMs require participants to bear “more than nominal risk.” This incentive structure is intended to reward good performance and penalize poor performance.13 One example is the Comprehensive Care for Joint Replacement model, which sets a target price for hip and knee replacement procedures. Model participants who can deliver care below that target price and receive a sufficiently high quality score receive additional reimbursement. Those whose payments exceed the target price must repay the difference up to a certain amount. This particular model’s arrangement is called “two-sided risk,” as opposed to “one-sided risk” models where participants only receive rewards but do not face penalties.
Advanced APMs must also have quality measures similar to MIPS and require use of certified electronic health record technology. To become a qualifying advanced APM participant, clinicians must receive at least 50 percent of their Medicare Part B revenues or 35 percent of their Medicare patients from advanced APMs. Given that these APMs tend to be more focused and have stronger performance incentives than MIPS does, policymakers generally believe that greater participation in them would hasten the transition to “value-based” care.
QPP Incentives
While both MIPS and advanced APMs present alternatives to traditional FFS Medicare, the incentive structure of the QPP is intended to encourage greater participation in advanced APMs.14 And more clinicians are participating in advanced APMs although there are still far more enrolled in MIPS. In performance year 2017, there were about 10.7 times more MIPS participants than advanced APM participants, versus 3.9 more in 2020.15 Under MACRA’s original language, qualifying APM participants receive 5 percent bonuses for each payment year between 2019 and 2024. MIPS, by contrast, provides both downward and upward payment adjustments depending on performance, with maximum adjustments in either direction of 4 percent in 2019, 5 percent in 2020, 7 percent in 2021, and 9 percent in 2022 and thereafter. In the long run, MACRA provides a 0.25 percent annual payment update to MIPS participants in 2026 and after (in addition to the performance-based payment adjustments), versus an additional 0.50 percentage points for qualifying APM participants (for 0.75 percent total).
Because MIPS is required to be budget neutral, payment adjustments must be spread out across all providers. Therefore, when a large number of clinicians meet the composite score threshold, their positive payment adjustments are much lower, while the negative payment adjustments are concentrated among the fewer providers who fall below it. Even with the appropriation of an additional $500 million “exceptional performance” bonus for each payment year 2019 through 2024, the upside potential in MIPS is much smaller than in advanced APMs, as the next section further outlines.
Even after MACRA’s enactment, Congress has continued to tinker with the QPP, aiming to provide clinicians with more flexibility as they adapt to MIPS requirements. The Bipartisan Budget Act of 2018 made numerous changes to MIPS to exempt more small practices and increase CMS authority in determining payments. Congress also reduced the 2019 FFS physician payment update from 0.50 percent to 0.25 percent.16
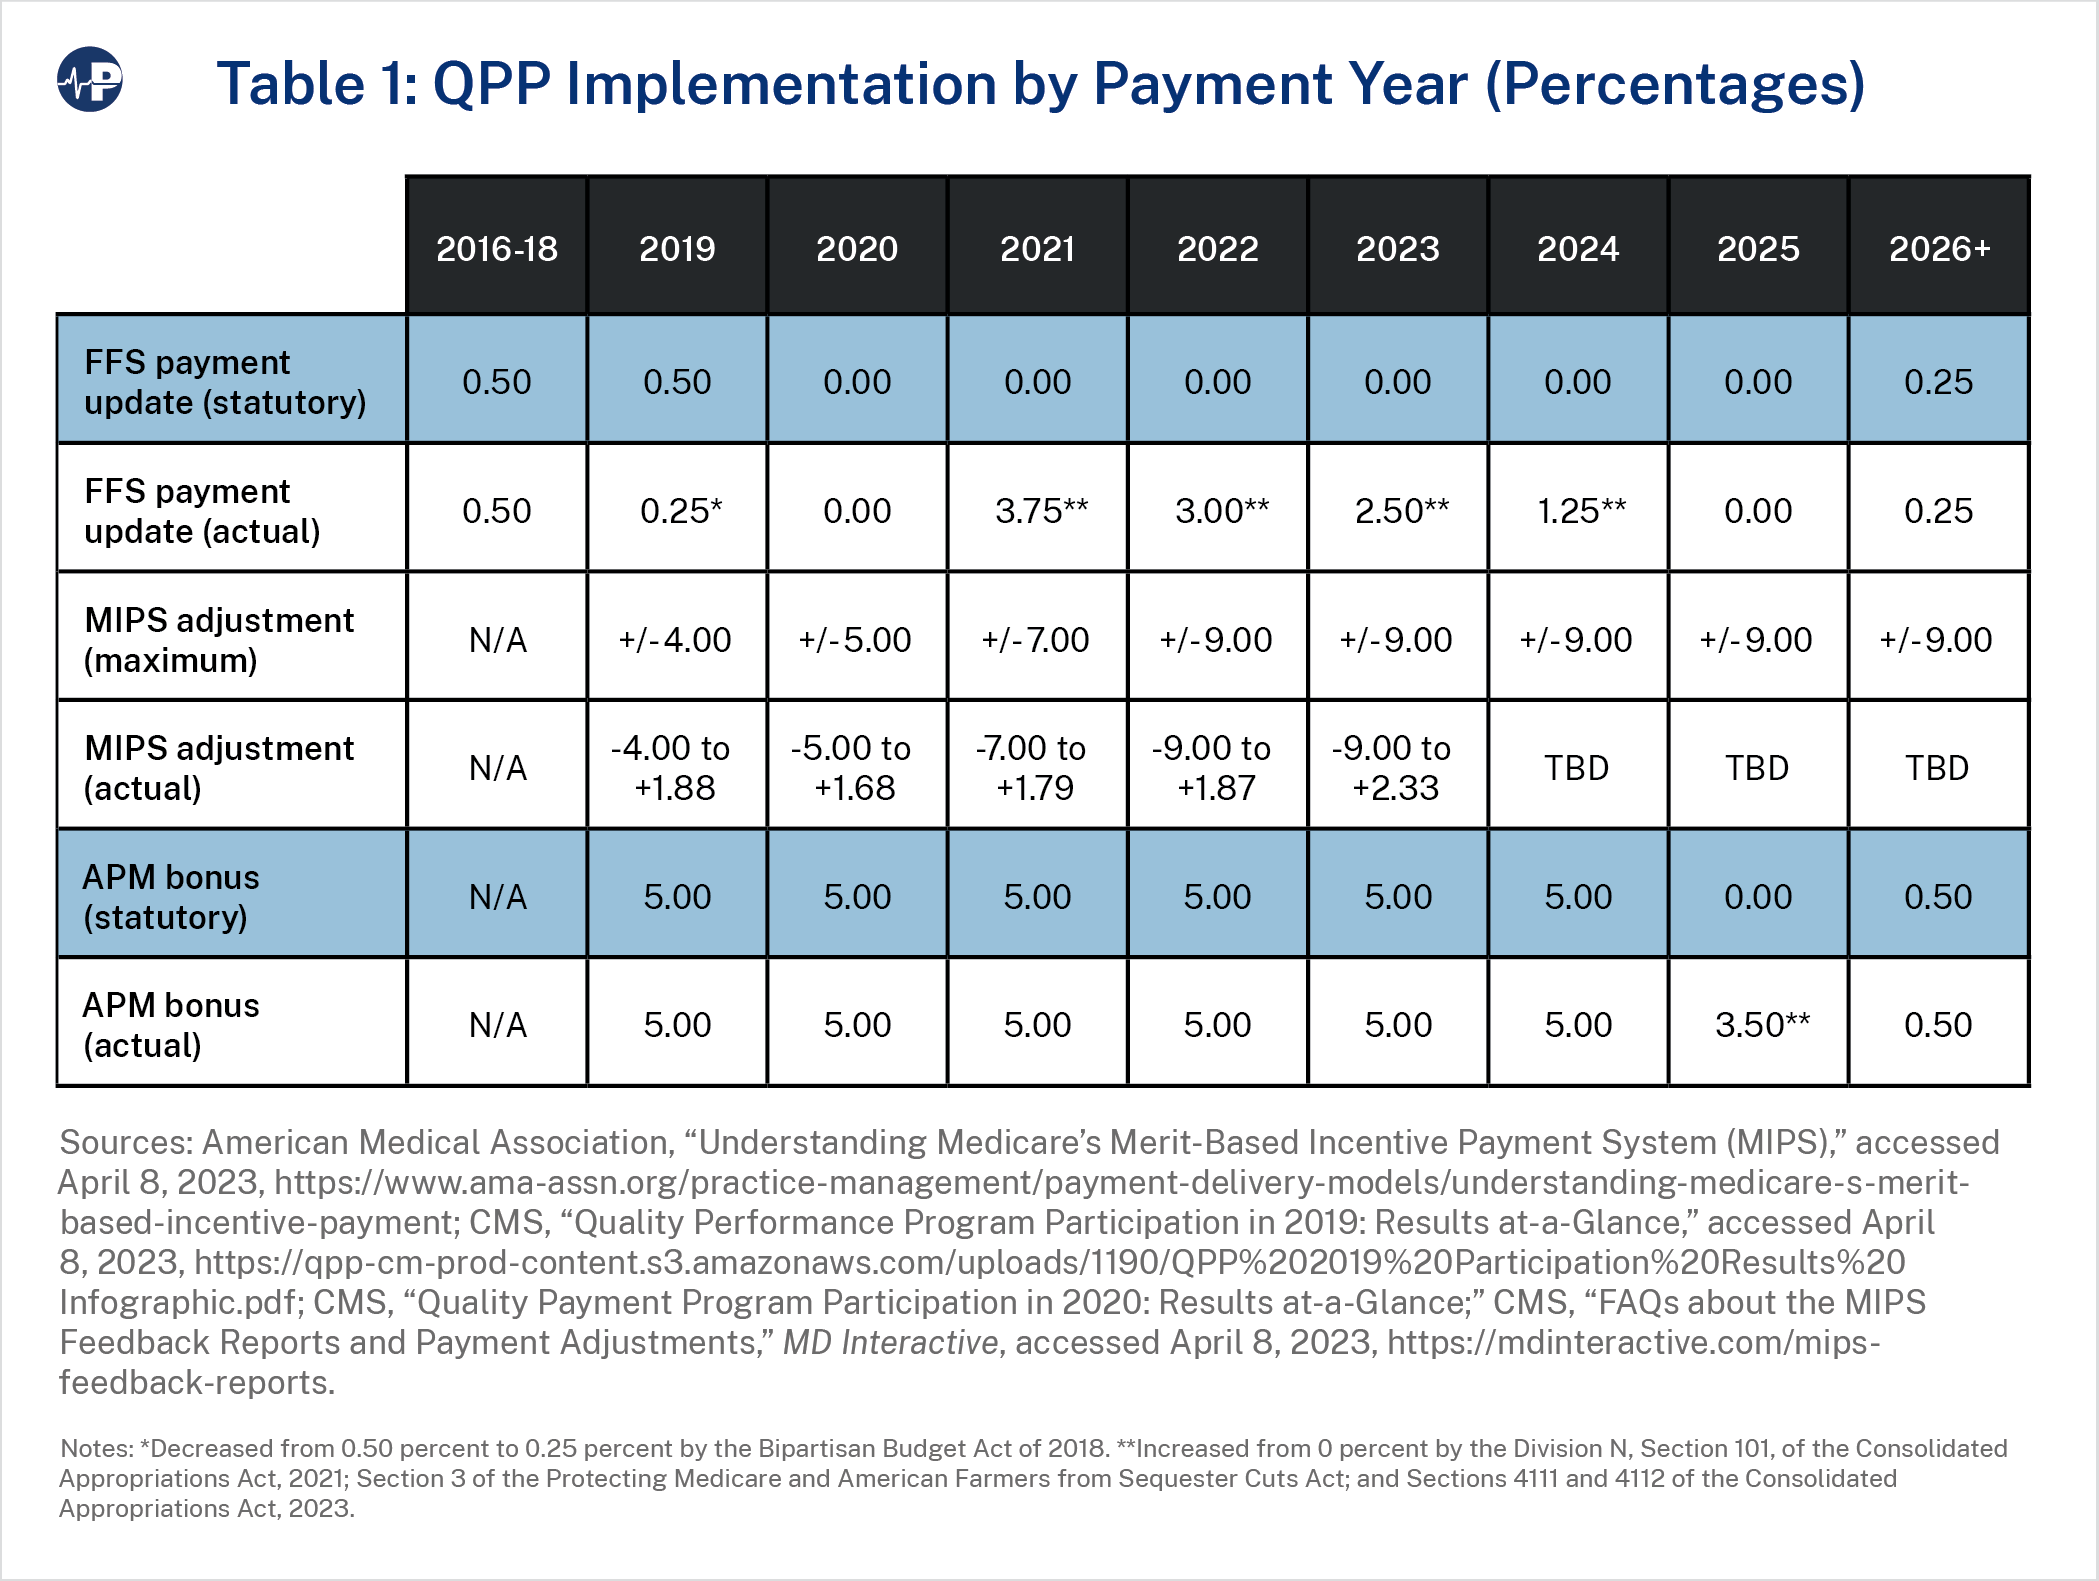
As with the SGR, Congress has faced political pressure to override the reduced payment updates for doctors, especially during the COVID-19 pandemic. MACRA originally froze payment updates for 2020 through 2025, but Congress stepped in and boosted clinician payment updates by 3.75 percent in 2021, 3.00 percent in 2022, 2.50 percent in 2023, and 1.25 percent in 2024.17 Congress also extended 5 percent APM bonus payments through payment year 2025.18 These patches, plus other pandemic-related assistance such as the suspension of sequestration cuts, bolstered clinicians’ post-pandemic financial recovery.19 But these actions in turn watered down MACRA’s attempts to control ballooning payments.
CMS also made several administrative updates to the QPP. For example, in 2017, it finalized various regulatory changes to decrease the number of clinicians required to participate in MIPS, such as by increasing the low-volume threshold from $30,000 in Part B revenue or 100 Part B patients to $90,000 in revenue or 200 patients. As a result of this change, the number of clinicians estimated to earn a low-volume exemption rose from about 380,000 to 690,000 between 2017 and 2018.20 Additionally, on top of numerous other flexibilities implemented in response to COVID-19,21 CMS excluded the cost performance component from its calculation of MIPS scores for performance years 2020 and 2021 rather than gradually increasing its weight as planned, leaving the other measurement categories in place with higher weights.22 These actions were intended to reduce the clinician burden of MIPS.
CMS has also attempted to improve MIPS quality measures. For example, it developed MIPS Value Pathways (MVPs), a new reporting structure to align measures and activities across different MIPS scoring categories that are most relevant to a clinician’s scope of practice (e.g., specialty), in order to reduce reporting burdens.23 Although MVPs’ implementation was delayed to 2023 from 2021, CMS has envisioned them as a potential replacement to the “traditional MIPS” framework.24 However, the Biden administration has said that it needs more funding to fully transition to MVPs.25
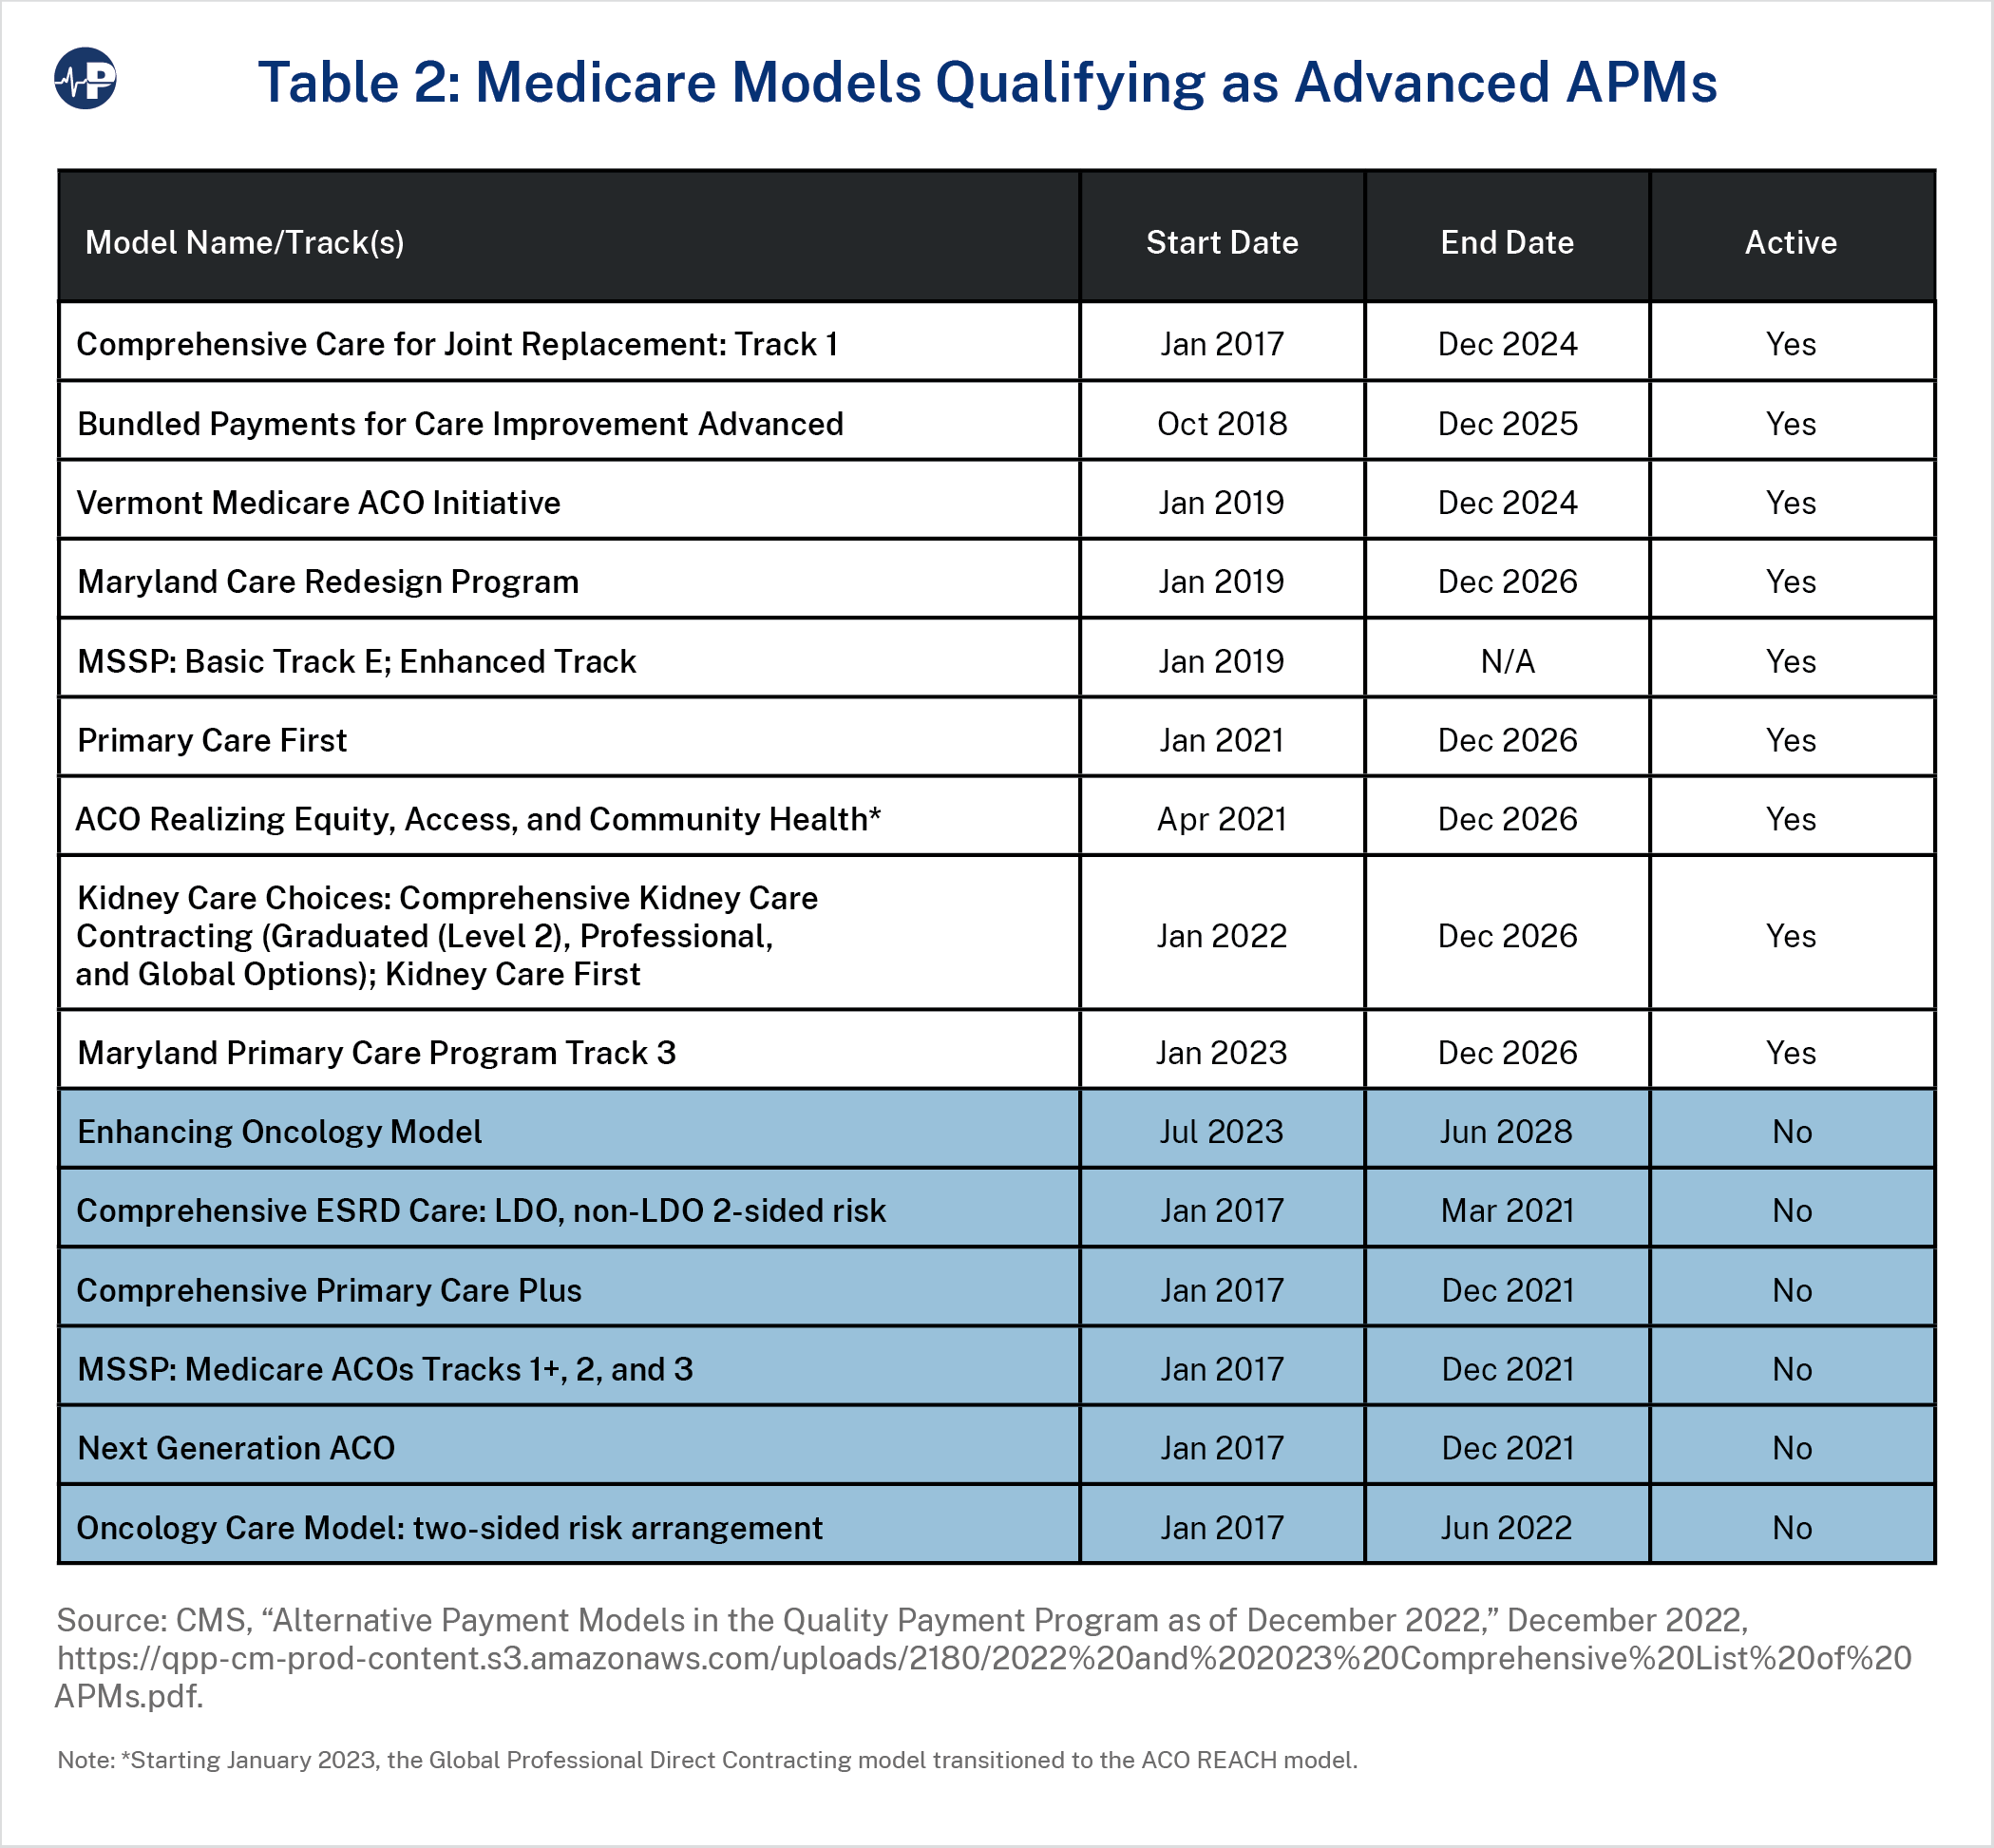
Finally, CMS has tested numerous advanced APMs, as table 2 summarizes. Most of these models, plus many others that do not qualify as advanced APMs, function under CMS’s Innovation Center waiver authority. The biggest exception is the Medicare Shared Savings Program (MSSP), an APM Congress created under the Affordable Care Act. MSSP allows participating providers and suppliers to create accountable care organizations (ACOs), which agree to be held collectively accountable for the quality, cost, and experience of care for traditional Medicare beneficiaries assigned to them. In 2023, there are 456 ACOs providing care to 11 million beneficiaries. However, depending on their MSSP tracks, only some clinicians are qualifying APM participants in QPP.26 CMS has a stated goal of moving all traditional Medicare beneficiaries into ACO-like arrangements by 2030 and has attempted to entice greater participation through incentives such as advance shared savings payments to certain new ACOs.27
The lofty promises of MACRA and its QPP have not worked out as hoped. A recent literature review found that MIPS has increased administrative burden without decreasing spending or improving quality. It also found no evidence that QPP bonuses caused physicians to join APMs.28
Nor has MACRA’s restructuring of physician payment updates maintained political support. After numerous modifications, including one-time fixes reminiscent of the SGR doc fixes, lawmakers in both parties continue to seek band-aids for MACRA’s payment decreases while openly pondering how to “further reform” that law and “stabilize” Medicare payments.29 Some have suggested tying physician payment to the Medicare Economic Index, a measure of inflation for inputs used for physician services.30 The Government Accountability Office (GAO) has also suggested addressing potentially misvalued services in the fee schedule.31 Given the QPP’s significant impact on physician payment, understanding its shortcomings is a major factor in finding long-term policy solutions.
MIPS
MIPS’s defects became clear at the outset. Congress’s Medicare Payment Advisory Commission (MedPAC) declared within a few years of enactment that MIPS “will not be successful” and recommended its elimination.32
Foremost are problems with quality measurement. Studies of MIPS’s predecessors already struggled to find a clear link between quality measures and clinical outcomes.33 A 2019 GAO report found that CMS was unable to even evaluate whether its quality initiatives achieved its strategic objectives. CMS’s quality measurement failure is not for lack of funds: Congress appropriated at least $263 million to develop and analyze clinical measures between 2015 and 2018, including $132 million from MACRA. In a testament to this bureaucratic quagmire, CMS itself does not know how much total funding it devotes to quality measurement. To date, it has not fulfilled any of GAO’s recommendations for addressing this problem.34
MIPS’s reporting requirements are both unhelpful and overly burdensome. For example, within the quality performance component, clinicians choose which metrics to report out of hundreds of possible options. This was intended to account for the fact that not all measures are relevant to all practices, but it also allows them to cherry pick their preferred measures and avoid disclosing areas of low performance. As a result, at least 90 percent of MIPS clinicians received positive payment adjustments in each of the first four years, with 71 to 84 percent earning additional bonuses for “exceptional performance.” This greatly reduced the size of these pay bumps, with maximums ranging from 1.68 to 1.88 percent each year rather than the 4 to 9 percent maximums originally contemplated in MACRA.35
For some clinicians—especially solo practitioners or those at smaller practices (i.e., 10 or fewer clinicians who do not qualify for a low-volume exemption) without the resources to optimally game the measures36—the potential MIPS payment increases do not justify the cost of complying with its complex requirements. While hundreds of thousands of clinicians secured low-volume exemptions in the first years of MIPS, those who did not consistently suffered. Median scores for small practices were 15–22 points lower than the overall median in performance years 2018–2020.37 In performance year 2019, physician practices spent an average of $12,811 per physician complying with MIPS. Practices’ clinicians and administrators spent over 200 hours per physician to comply.38 These concerns are even greater for clinicians who serve more vulnerable (and costly) patients and are therefore likelier to receive lower performance scores.39 As burnout among health professionals has become more widespread after the COVID-19 pandemic, more doctors have spoken out about the disconnect between proper patient care and what the health care system incentivizes them to do. As one doctor said in a 2022 article, “We cared about quality of patients’ experience … and then there were all these things we got paid for.”40
CMS has pursued some incremental changes to tweak its quality measures, reduce burden, add more bonuses, or allow more opt-outs entirely. It has also said that MVPs will address other clinician concerns, such as the lack of timely or relevant CMS feedback reported by GAO.41 Still, MIPS fundamentally continues to be a system that emphasizes the federal government’s quality measurement priorities rather than patients’ experiences, appropriateness measures that target wasteful and harmful services, or actual outcomes. Indeed, in a 2021 study, one interviewed clinician bemoaned that “MIPS is hindering [clinicians]. Making sure they are checking all those boxes. It becomes more about that than the actual patient.” Another noted that “the biggest part is that doctors can’t see as many patients as they used to.”42
Advanced APMs
MACRA’s goal was to incentivize more clinicians to enter into APMs that would make them more accountable for the quality of their care. The share of health care dollars tied to APMs rose from 29 percent in 2016 to 41 percent in 2020, and from 31 to 43 percent of payments in traditional FFS Medicare.43
Still, the growth of APMs belies the fact that their results have been disappointing. The CMS Innovation Center found that only six of the more than 50 models it tested in its first decade produced statistically meaningful financial savings. The vast majority did not save money, and several were on pace to lose billions of dollars. The majority of models also did not show significant quality improvements, and only two of those six meaningfully improved quality.44 One estimate found that the Innovation Center will produce $9.4 billion in net federal losses during the 2017–2026 period, in contrast to rosy projections of $34 billion in net savings during that time.45
The Innovation Center has also resisted implementing models submitted by external stakeholders. MACRA created the Physician-Focused Payment Model Technical Advisory Committee to review and recommend proposals for physician-focused APMs. But two committee members resigned in 2019 out of frustration that none of the 16 models it recommended was taken up, despite public praise for the committee.46
Groups sympathetic to federally managed models such as MedPAC argue that the solution is to focus on population- and episode-based models.47 They point to nationwide models such as MSSP as examples.48 Yet there is evidence that ACOs can contribute to greater physician consolidation49 and cost increases,50 risks that early critics highlighted.51 It seems that centralized payment models continue to yield negative consequences, despite the intent or the supposed innovativeness of their designs.
CMS has the authority to keep testing new models and adjusting existing ones, although some experts have advised imposing guardrails on that authority.52 Its recent “strategic refresh” aims to build on successes and avoid repeating missteps.53 As QPP’s bonuses for APM participants decline, Congress and CMS may face more pressure to find a more self-sustaining approach to APMs.
Since MACRA’s enactment, there have been few efforts to reform the law besides incremental administrative updates and short-term congressional fixes.
A guiding principle of reform should be to trust and empower people to make decisions about their own health care. Giving them the incentive and opportunity to seek the highest-value care based on their individual circumstances should be the primary goal for policymakers. This proposition has already been illustrated in recent decades by the rise in popularity of Medicare Advantage (MA), for example. Congress and CMS could examine options to better integrate the existing population-based, risk-adjusted, capitated payment structure of MA within QPP. It can also enhance beneficiaries’ ability to choose between MA and FFS on an equal footing.
Ultimately, the health care system will not achieve better quality just because a federal program tells it to. Instead, policymakers should focus on making doctors accountable to their patients directly rather than imposing an artificial and often counterproductive set of federal metrics.
ACO Realizing Equity, Access, and Community Health (ACO REACH) (formerly Global and Professional Direct Contracting (GPDC) Model):
Bundled Payments for Care Improvement Advanced:
Comprehensive Care for Joint Replacement:
Comprehensive End Stage Renal Disease (ESRD) Care:
Comprehensive Primary Care Plus:
Enhancing Oncology Model:
Kidney Care First (KCF) and Comprehensive Kidney Care Contracting (CKCC) (components of the Kidney Care Choices (KCC) Model):
Maryland Care Redesign Program (CRP) (Part of Maryland Total Cost of Care [TCOC] Model):
Maryland PCP Track 3 (Part of Maryland TCOC Model):
Medicare Shared Savings Program (MSSP):
Next Generation ACO (NGACO) Model:
Oncology Care Model:
Primary Care First:
Vermont Medicare ACO Initiative (component of Vermont All-Pay ACO Model):