Brian Blase, Ph.D.
Brian Blase, Ph.D., is the President of Paragon Health Institute. Brian was Special Assistant to the President for Economic Policy…
Reforming Government. Empowering Patients.
Navigation
This brief highlights the potential cost savings for states by efficiently removing ineligible enrollees from Medicaid, estimating significant financial benefits for states and federal budget with quicker and more effective redeterminations post-COVID-19 public health emergency.
The Medicaid rolls swelled by about 20 million people between early 2020 and early 2023 as the federal government offered states more money in exchange for states not redetermining recipient eligibility and removing ineligible enrollees during the COVID-19 public health emergency. The additional federal money is phasing out this year, and states have started removing ineligible recipients. States could have taken three actions to protect limited resources for eligible Medicaid recipients or for other purposes:
Since about two-thirds of Medicaid is financed by the federal government, such actions would also reduce wasteful federal spending and lower the deficit.
Many researchers have estimated the coverage implications of Medicaid disenrollments during the unwinding period, but the implications for state and federal spending have not been estimated, especially the cost of delay.1 This policy brief estimates the costs—both overall and to states—of when states begin redeterminations and the costs associated with how long they take to complete the process.
The Urban Institute estimates that about 18 million people will have Medicaid accounts closed during the unwinding—10.6 million adults and 7.3 million children.2 This many ineligible enrollees equates to about $81.7 billion of annualized Medicaid spending. Timely and effective redeterminations will save states money that can be used for eligible Medicaid enrollees as well as other state priorities such as education. To put these numbers in perspective, this much wasteful Medicaid spending equals 15 percent of state spending on elementary and secondary education, 33 percent of state spending on higher education, 39 percent of state spending on transportation, and exceeds state spending on corrections.3
By removing ineligible people from Medicaid sooner, states will stop sending payments to insurance companies for people who are not eligible. State savings will be greater for closing ineligible accounts for adults on Medicaid, most of whom will gain coverage through employer plans. Savings to states for closing accounts for ineligible children on Medicaid will be smaller, because many of them will transition to the Children’s Health Insurance Program (CHIP), where states bear a share of the costs. As such, beginning redeterminations with adults, particularly those most likely to have lost eligibility, is the most prudent action for states.
We estimate that states could avert a total of $11.8 billion in wasteful spending over the next year through timelier and more efficient redeterminations. The total Medicaid savings would exceed $40 billion. These are the amounts avoided if states started redeterminations in April and completed them in six months versus starting them in July and taking 12 months.
For example, Arkansas began redeterminations in April and plans to have them all processed by September.4 California and New York decided to start redeterminations late and plan to take their time processing them.5 We project that these two states will expend an extra $1.3 billion and $900 million, respectively, in state funds for keeping ineligible enrollees on the program longer.
The Families First Coronavirus Relief Act provided states with an increase in their standard federal medical assistance percentage (FMAP) of 6.2 percent if they offered continuous coverage for their Medicaid enrollees during the COVID public health emergency.6 States would receive the additional funds only if they did not close any Medicaid accounts, regardless of any change in enrollees’ income or employment. Aside from recipients who voluntarily disenrolled, a state would be allowed to remove beneficiaries only if they moved out of state or died (and the state was aware of these events). This means that for more than three years—from March 2020 through March 2023—states closed very few ineligible Medicaid accounts.
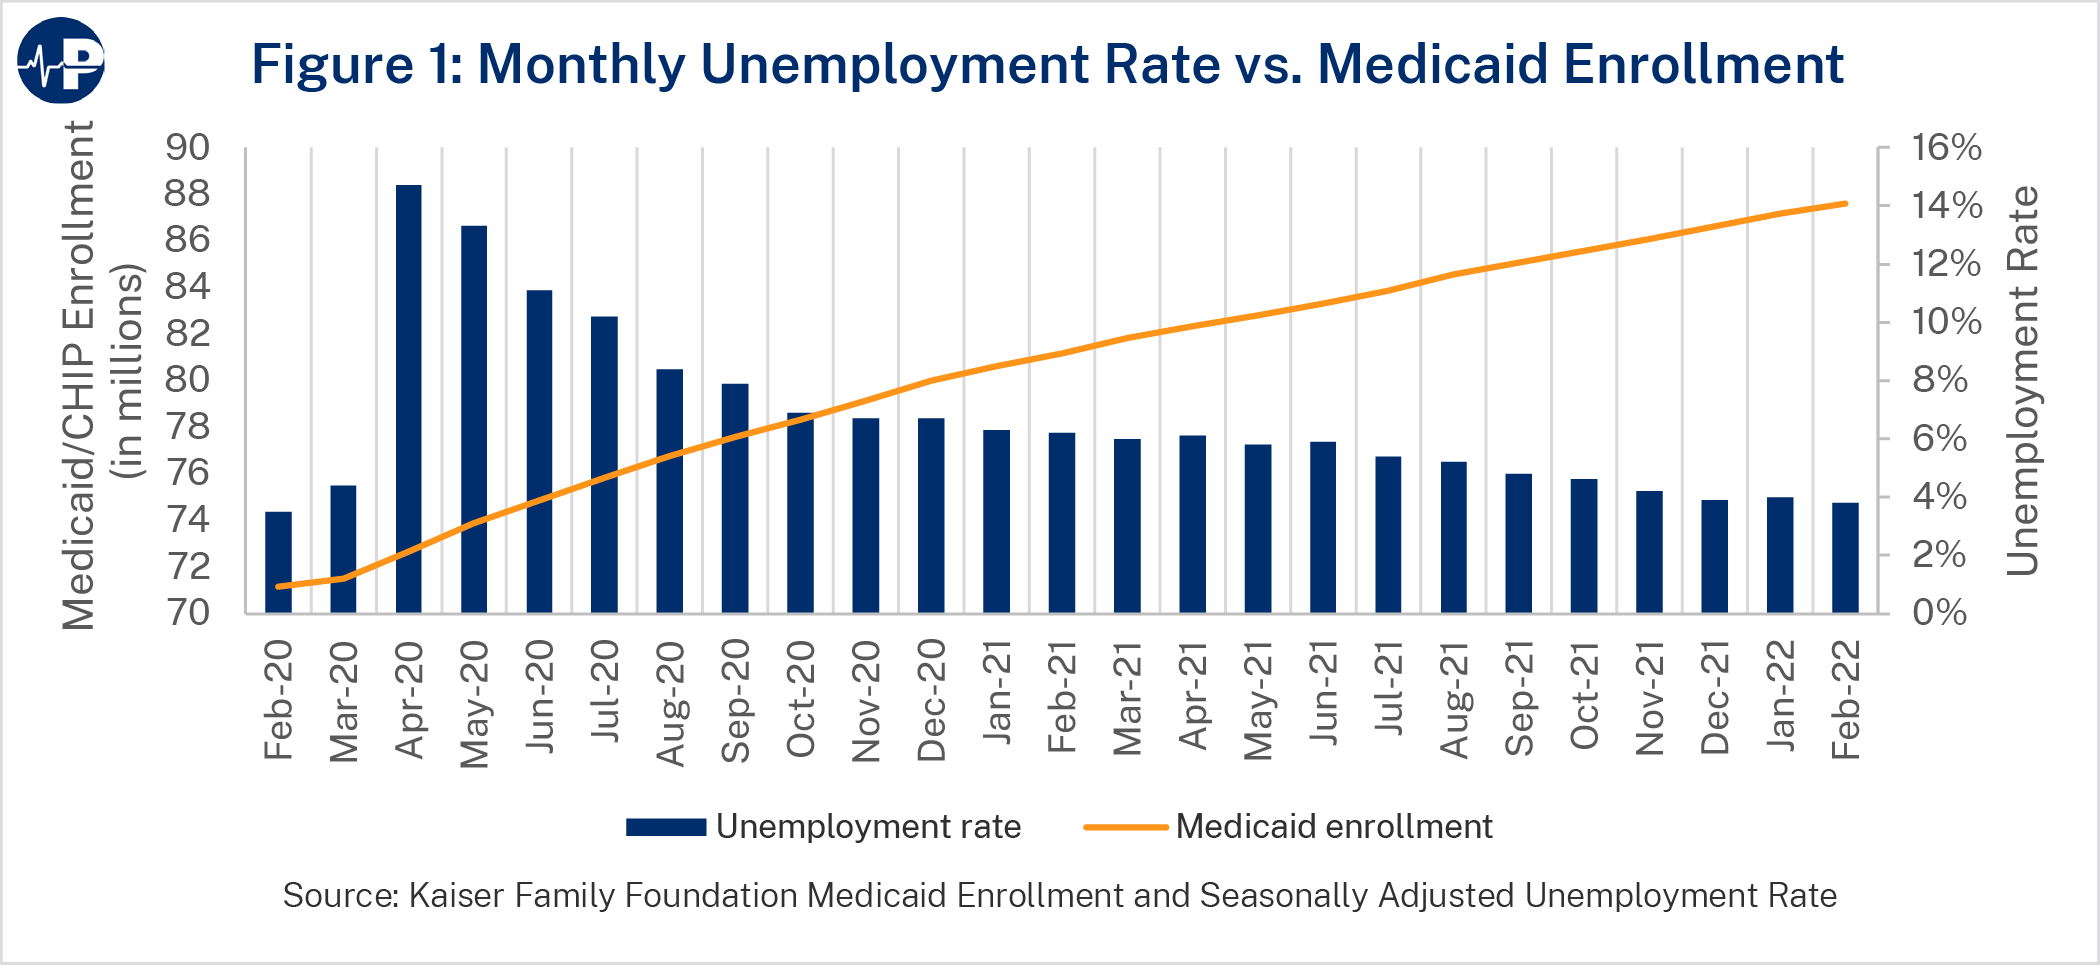
As the unemployment rate spiked in April 2020, a similar spike did not follow in Medicaid enrollment as relatively few Americans who lost their jobs also lost health coverage. Medicaid and CHIP enrollment increased only from 71.5 million to 73.9 million enrollees from February 2020 through May 2020. As Figure 1 shows, Medicaid enrollment continued to steadily climb after April 2020 despite a declining unemployment rate. The main reason is that many people typically leave the Medicaid program each month, primarily because they obtain jobs with health insurance or their incomes increase above eligibility thresholds. During the public health emergency, states did not assess eligibility, so people who gained other coverage or higher income remained enrolled in the program.7
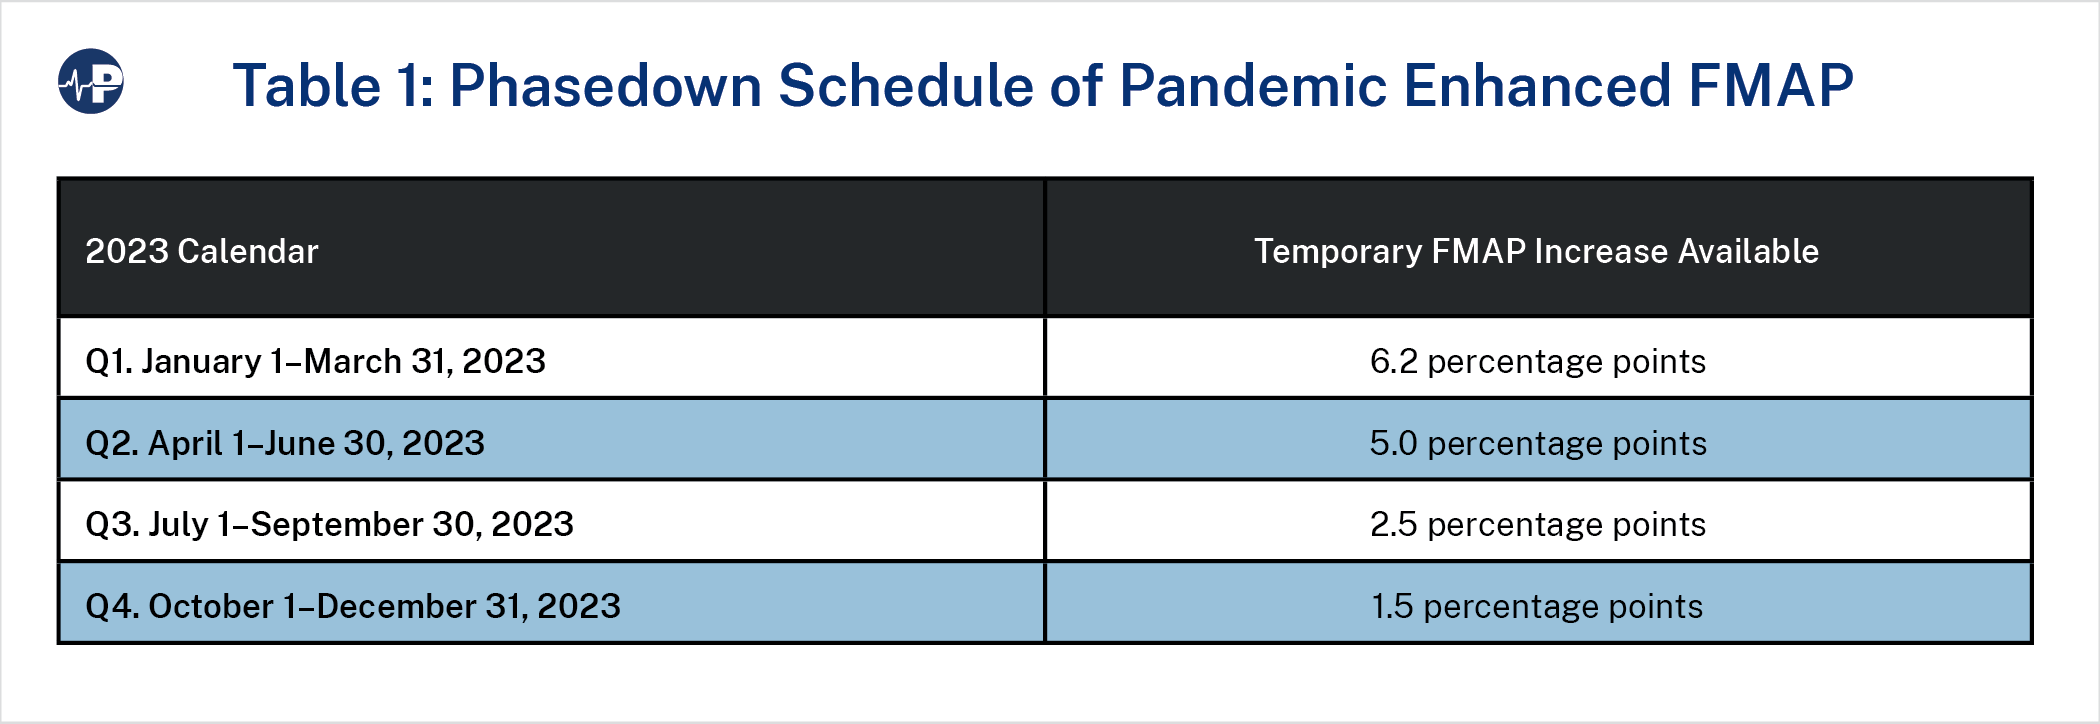
The Consolidated Appropriations Act of 2023 ended the continuous Medicaid enrollment requirement effective March 31, 2023. On April 1, 2023, states could act on Medicaid eligibility reviews and disenroll those who were found to be ineligible. Additionally, as Table 1 shows, the Act phased down the enhanced federal COVID Medicaid funds throughout 2023.8
States are eligible for the phased-down pandemic-enhanced FMAP if they follow certain federal rules. Principally, they must attempt to obtain current contact information for recipients, make a good-faith effort to contact recipients via different methods if mail is returned, use pre-populated forms, and test enrollees for eligibility in each enrollment category prior to removal.
According to the Urban Institute, 9.5 million of the 18 million that transition from Medicaid will have employer-sponsored insurance once disenrolled from Medicaid.9 In fact, nearly half of them already had employer-sponsored coverage and were also covered by Medicaid. Many likely had double coverage for a year or longer, costing taxpayers billions, as Medicaid recipients are overwhelmingly enrolled in managed care plans that receive monthly government payments per enrollee.
Urban estimates that 3.2 million children will move to CHIP, about 1.0 million people will move to exchange coverage (with most receiving large subsidies), and about 500,000 people will move to other nongroup coverage. Finally, Urban estimates a 3.8 million increase in the number of people who decide to remain uninsured, as most of the uninsured have access to other coverage, either through their employers or in the subsidized exchanges. In previous projections, Urban estimated that only 1 percent of those disenrolled would not have access to other sources of coverage.10
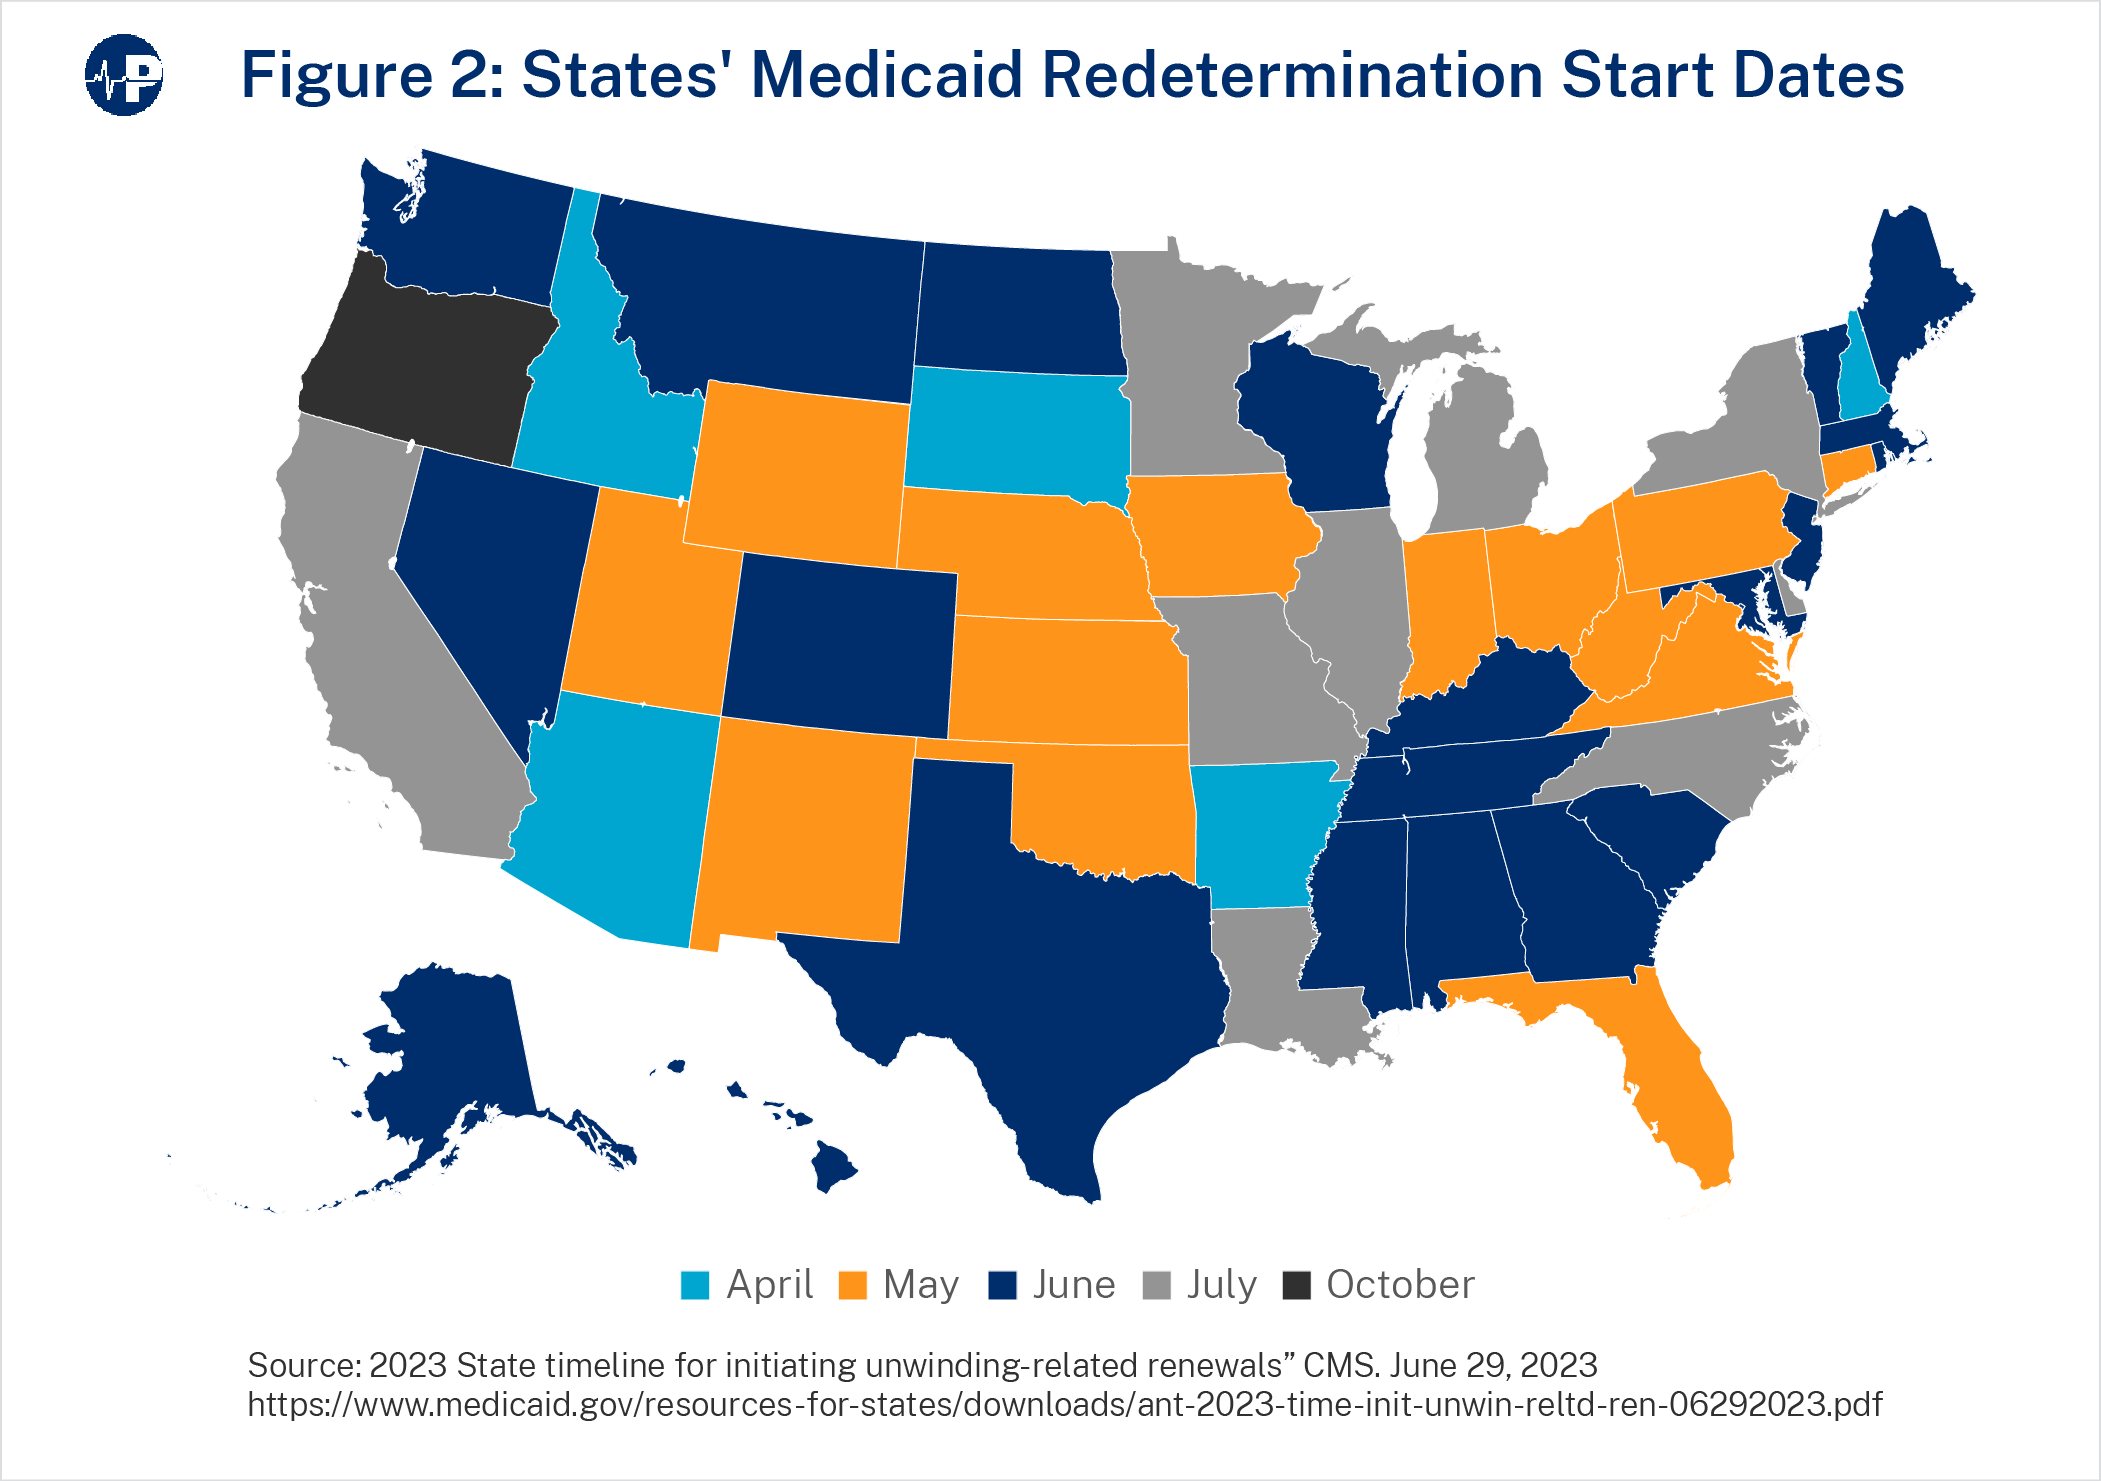
The figure above shows when states started or will start redeterminations. Only five states started redeterminations on April 1, 2023. Forty states began their redeterminations by June. Nine states began in July, and one state (Oregon) will begin the process in October.11
Redetermination savings are resources that states would have for other purposes. State savings will be larger for states that: (1) began redeterminations sooner, (2) started redeterminations with the enrollees most likely to be ineligible, and (3) process redeterminations expeditiously. Some states, such as Arkansas and Iowa, acted before the end of the public health emergency to identify Medicaid enrollees who had a very high probability of being ineligible.12 These enrollees were generally those who had other coverage or had reported income that exceeded eligibility thresholds. States that started their redeterminations with these enrollees will likely have more efficient processes, meaning that ineligible enrollees would be coming off the program sooner. State savings are also larger the earlier redeterminations are completed because of the phase-down in the enhanced FMAP.
Our analysis is a function of the time it takes states to complete redeterminations, which depends on when states start removals and how long it takes to complete removals once they start. For this paper, we do not account for the efficiency of state redeterminations processes, assuming instead that states close an equal number of ineligible accounts per month. Thus, states with more efficient processes will have more savings than our estimates, and states with less efficient processes will have lower savings than our estimates. Other factors, such as how a state prioritizes renewals and whether a state uses temporary workers or contractors to help with the redeterminations, could further impact savings.
Our estimates are largely derived using projections from the Urban Institute of the number of adults and children Medicaid enrollees, by state, who have accounts closed through the unwinding process and expenditure data by state and eligibility group from MACStats.13 We first estimate the total savings for Medicaid. We take the estimates of adults and children transitioning off Medicaid in each state and then apply per-beneficiary costs.14
The first column in Table 2 shows the total monthly Medicaid cost, including the federal and state share, of ineligible Medicaid COVID enrollees. The total cost to Medicaid from these ineligible enrollees is $6.8 billion per month. The three states with the largest spending on ineligible enrollees—California, Texas, and New York—spend $707 million, $511 million, and $481 million, respectively, on ineligible accounts each month. Column 2 shows the cost of ineligible accounts if it takes the state six months to fully unwind, Column 3 shows the cost of ineligible accounts if the state takes 12 months to fully unwind, and Column 4 shows the total savings from a quicker unwind assuming the same redeterminations start date. Total costs are 86 percent higher for redetermining over 12 months rather than six months.
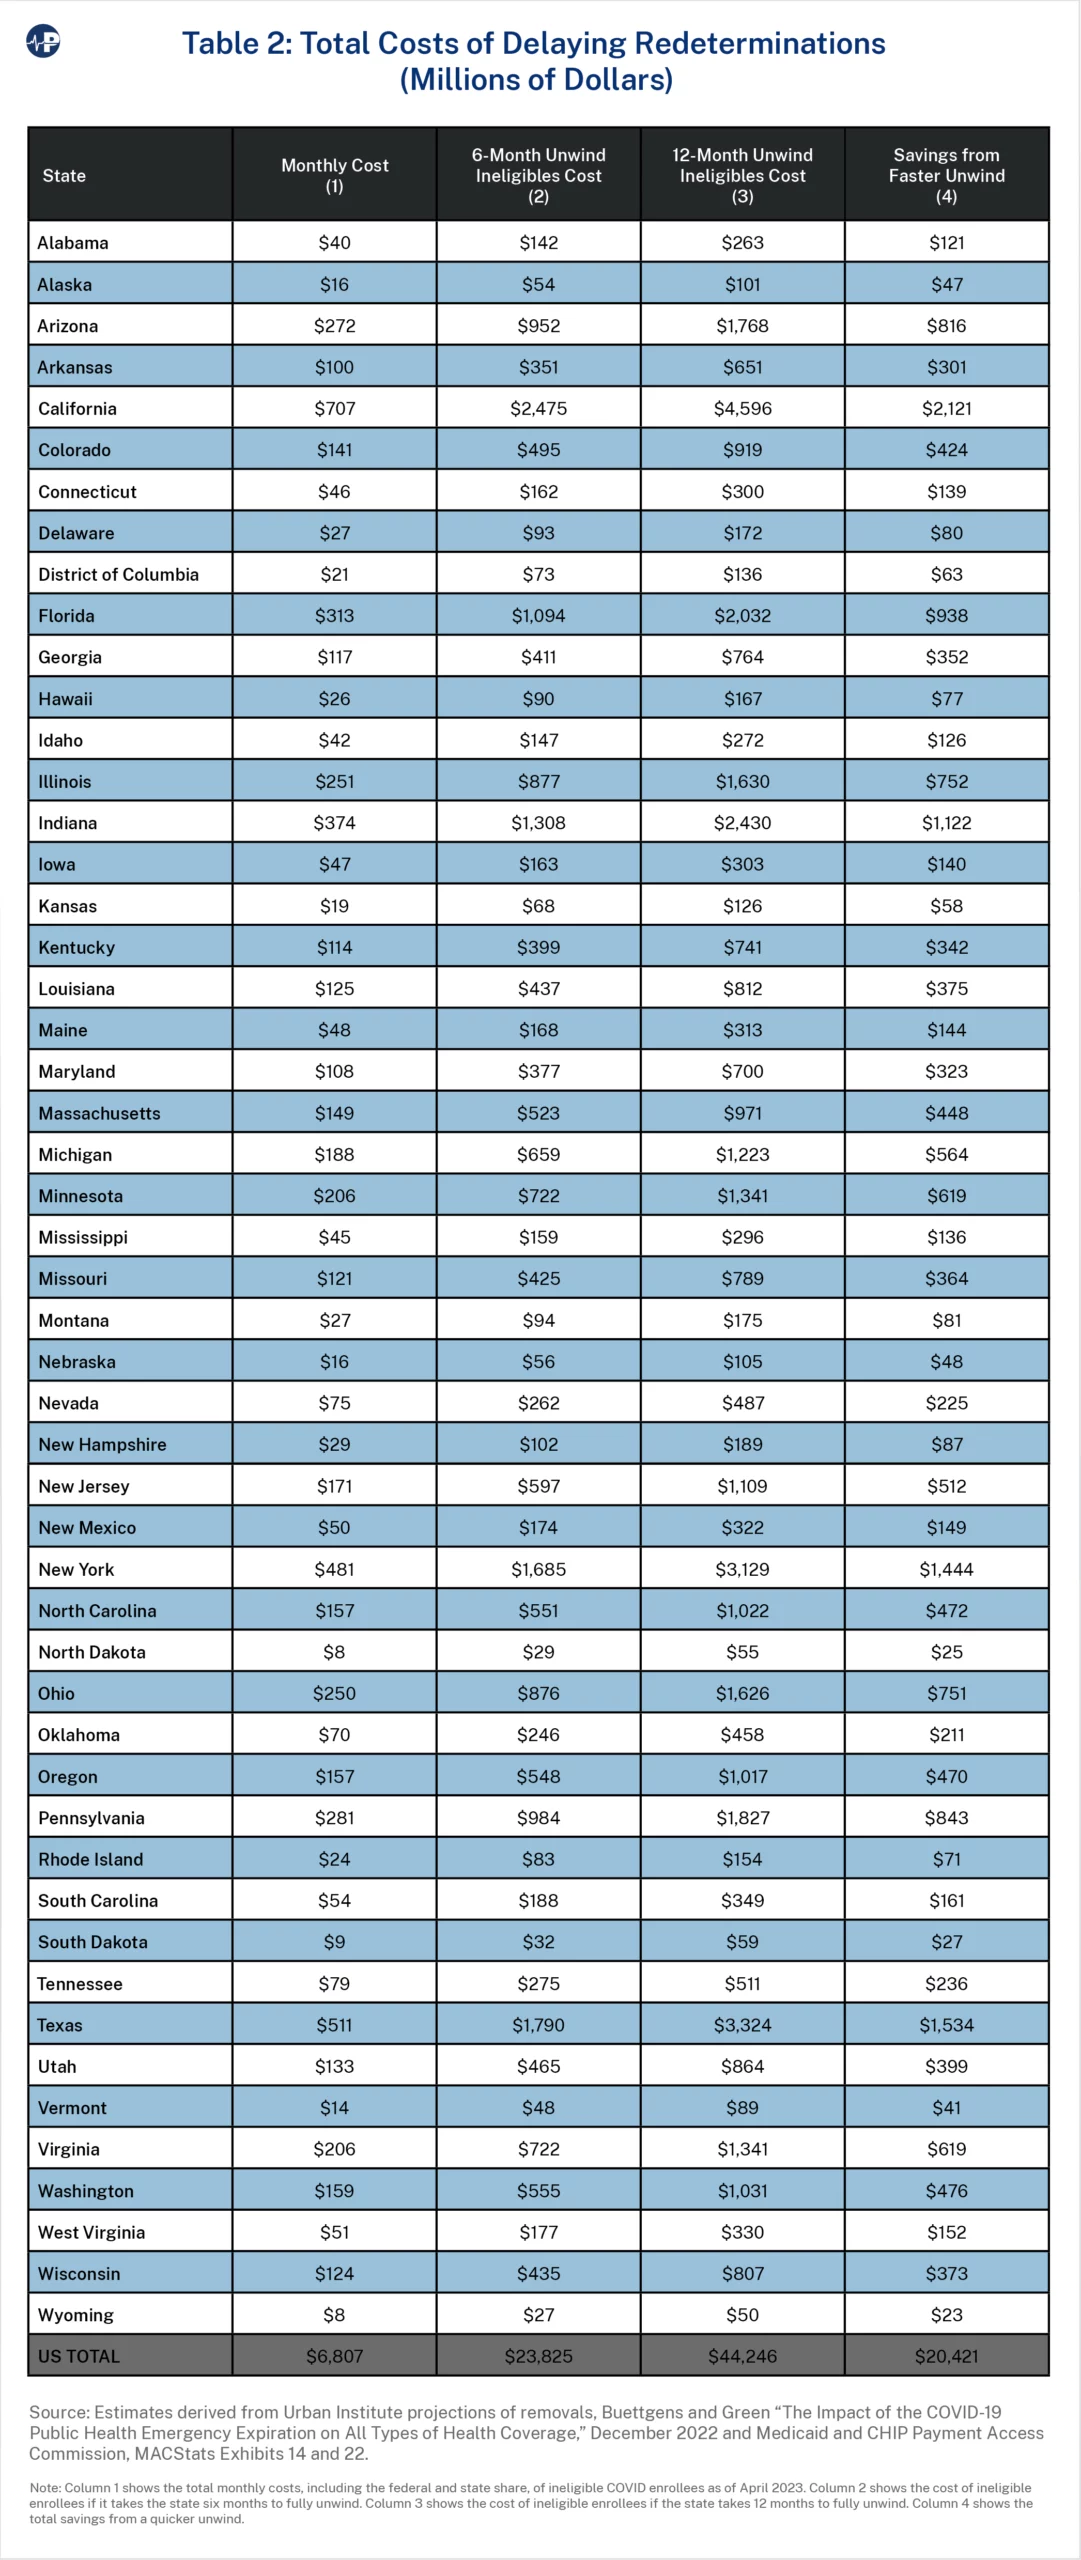
The total government costs of keeping ineligible Medicaid enrollees on the program has several effects outside of Medicaid based on where people gain coverage. The federal government does not subject employer-provided health insurance to income or payroll taxes, so it would collect less revenue for people who switch from Medicaid to employer coverage (although nearly half of people who will have employer coverage have been doubly covered by employer plans and Medicaid). For the estimated 1 million people who will replace Medicaid with subsidized exchange plans, the federal cost will likely not change much, as the average federal subsidy for these enrollees is around the federal cost of Medicaid15 And for children who migrate from Medicaid to CHIP, there will likely be some small savings—particularly for states, as states pay less for CHIP, and Medicaid is about 20 percent more expensive than CHIP for children.16 We estimate that, altogether, the total cost to taxpayers is about 20 percent less than the total costs to the Medicaid program after accounting for these effects. Thus, the total annualized federal cost of keeping ineligible enrollees on the Medicaid program is likely closer to $33 billion.
States are likely far more interested in the state share of these costs than the federal share, so Table 3 shows the state costs. On average, states bear about 29 percent of the total cost of ineligible COVID Medicaid enrollees. The state share is somewhat less for these recipients than the state share of overall Medicaid expenditures because a larger proportion of the ineligible COVID Medicaid recipients are Affordable Care Act (ACA) expansion enrollees. The FMAP is higher for expansion enrollees than for traditional enrollees.
To account for the ACA expansion, we applied the share of expansion enrollees for nondisabled, working-age adults by state as an estimate of the number of expansion enrollees in the ineligible population.17 To determine state costs in Column 1, we used the enhanced FMAP from the second quarter of 2023. Columns 2 and 3, depicting six-month and 12-month unwinds, represent the cost of ineligible enrollees if the process takes six months and 12 months to complete, assuming an equal number of removals each month over those respective periods and the same start date for removals. The difference between these two scenarios shows the estimated state savings of a faster unwind of ineligible COVID Medicaid recipients. We also accounted for the cost implications to states of children moving to CHIP. (See the appendix for an explanation of this methodology.)
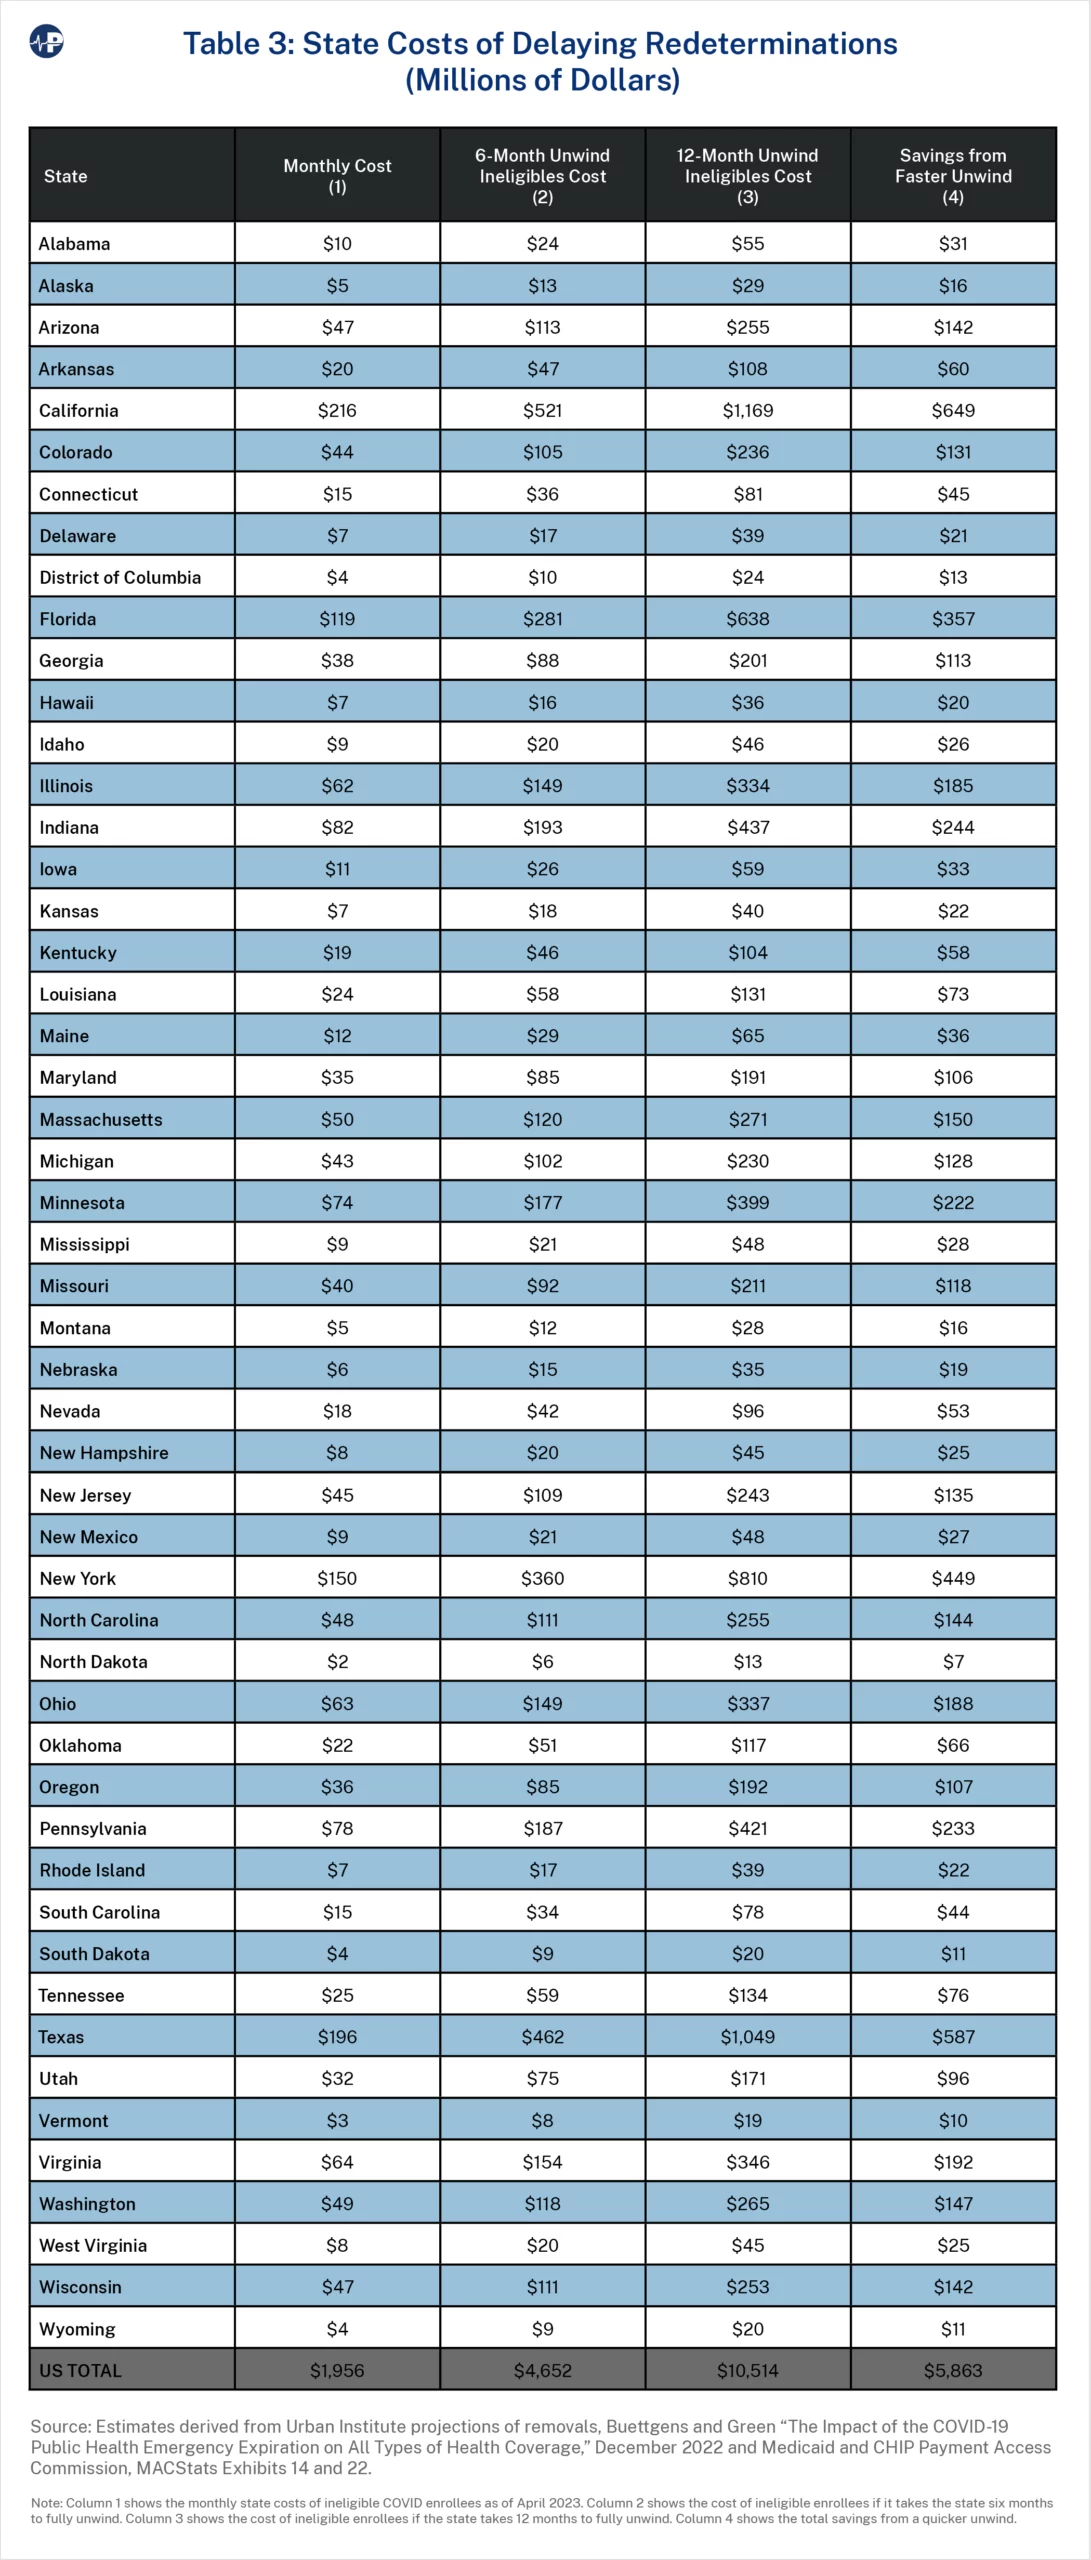
Overall, states are spending about $2 billion each month on ineligible Medicaid enrollees. The three states with the largest spending on ineligible enrollees—California, Texas, and New York—spend $216 million, $196 million, and $150 million, respectively, on ineligible enrollees each month. Taking 12 months to fully process redeterminations instead of six months costs those states $649 million, $587 million, and $449 million, respectively.
We then show two scenarios that combine the costs of ineligible COVID Medicaid accounts based on when states began redeterminations and how long it takes to complete them. In the first scenario, a state started redeterminations in April 2023 and completes the process in six months. In the second scenario, a state started redeterminations in July 2023 and completes the process in 12 months.
Table 4 shows the overall costs, including the federal share, of each scenario and the magnitude of savings from starting redeterminations sooner and processing them more quickly. If all states had begun redeterminations in April and took six months to complete, the total Medicaid cost of ineligible recipients would be $17 billion. In contrast, if all states began in July and took 12 months to complete, the total associated cost would be $58 billion. Collectively, more than $40 billion in lower Medicaid costs would result from more timely redeterminations and removals of ineligible enrollees.18 Starting redeterminations in July and taking 12 months is expected to cost taxpayers $4.2 billion, $2.9 billion, and $1.5 billion in California, New York, and Illinois, respectively, rather than if those states had started in April and took six months.
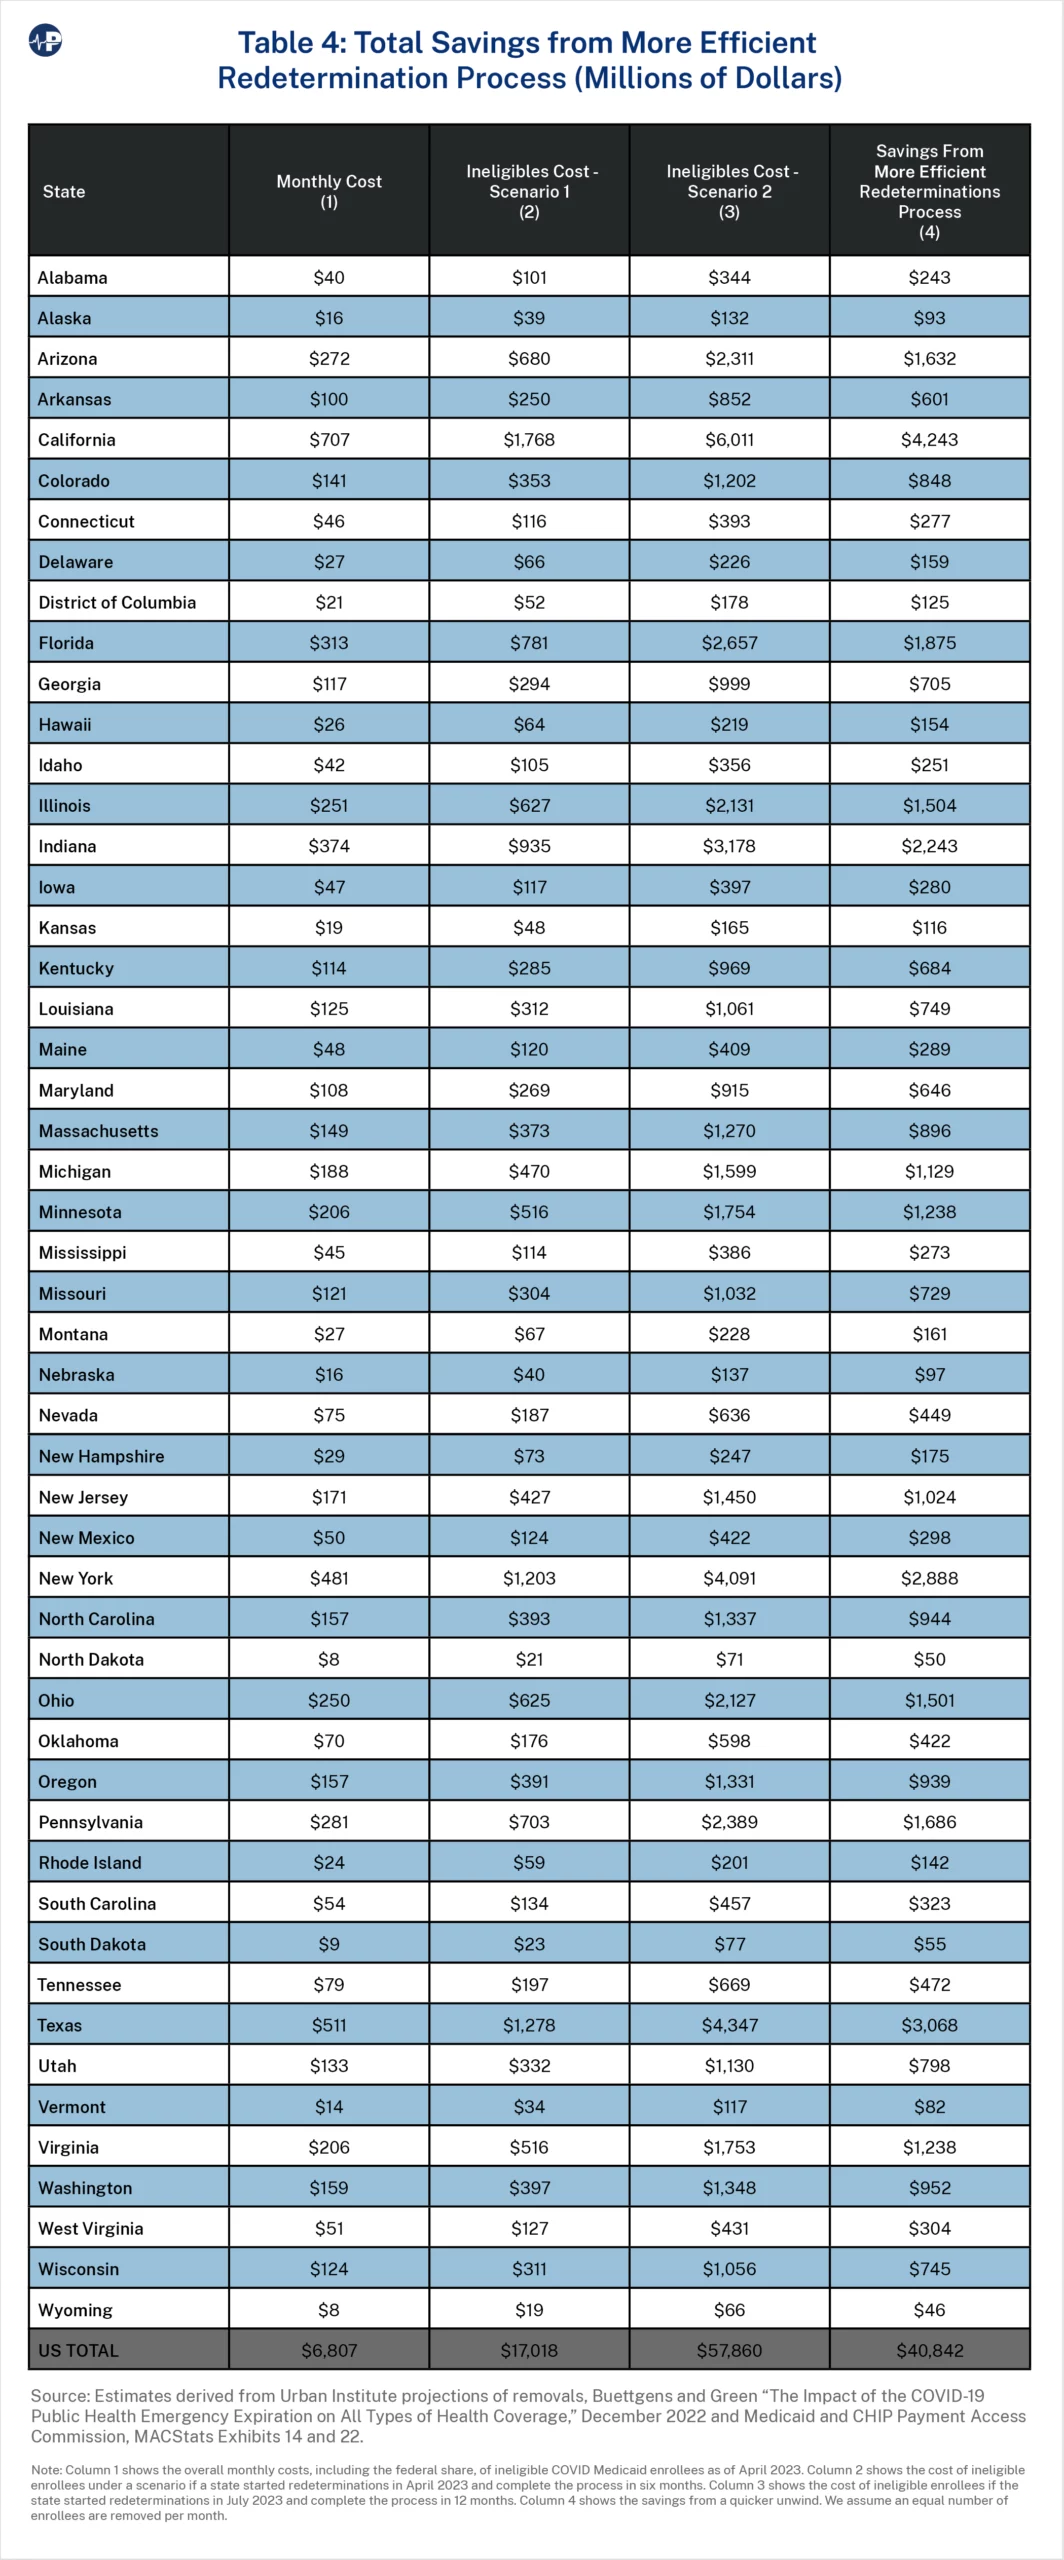
Table 5 shows the state costs from ineligible enrollees under both scenarios and the savings from a timelier redetermination process. As with the estimates in Table 4, states that are planning to slowly process redeterminations will cost taxpayers in their states by keeping more ineligible accounts open on the program longer. In California, New York, and Illinois, these costs are $1.3 billion, $902 million, and $371 million, respectively. Because Oregon is not planning to start redeterminations until October, the cost estimate of $215 million is significantly too low. The true cost to the state will likely be more than $300 million.
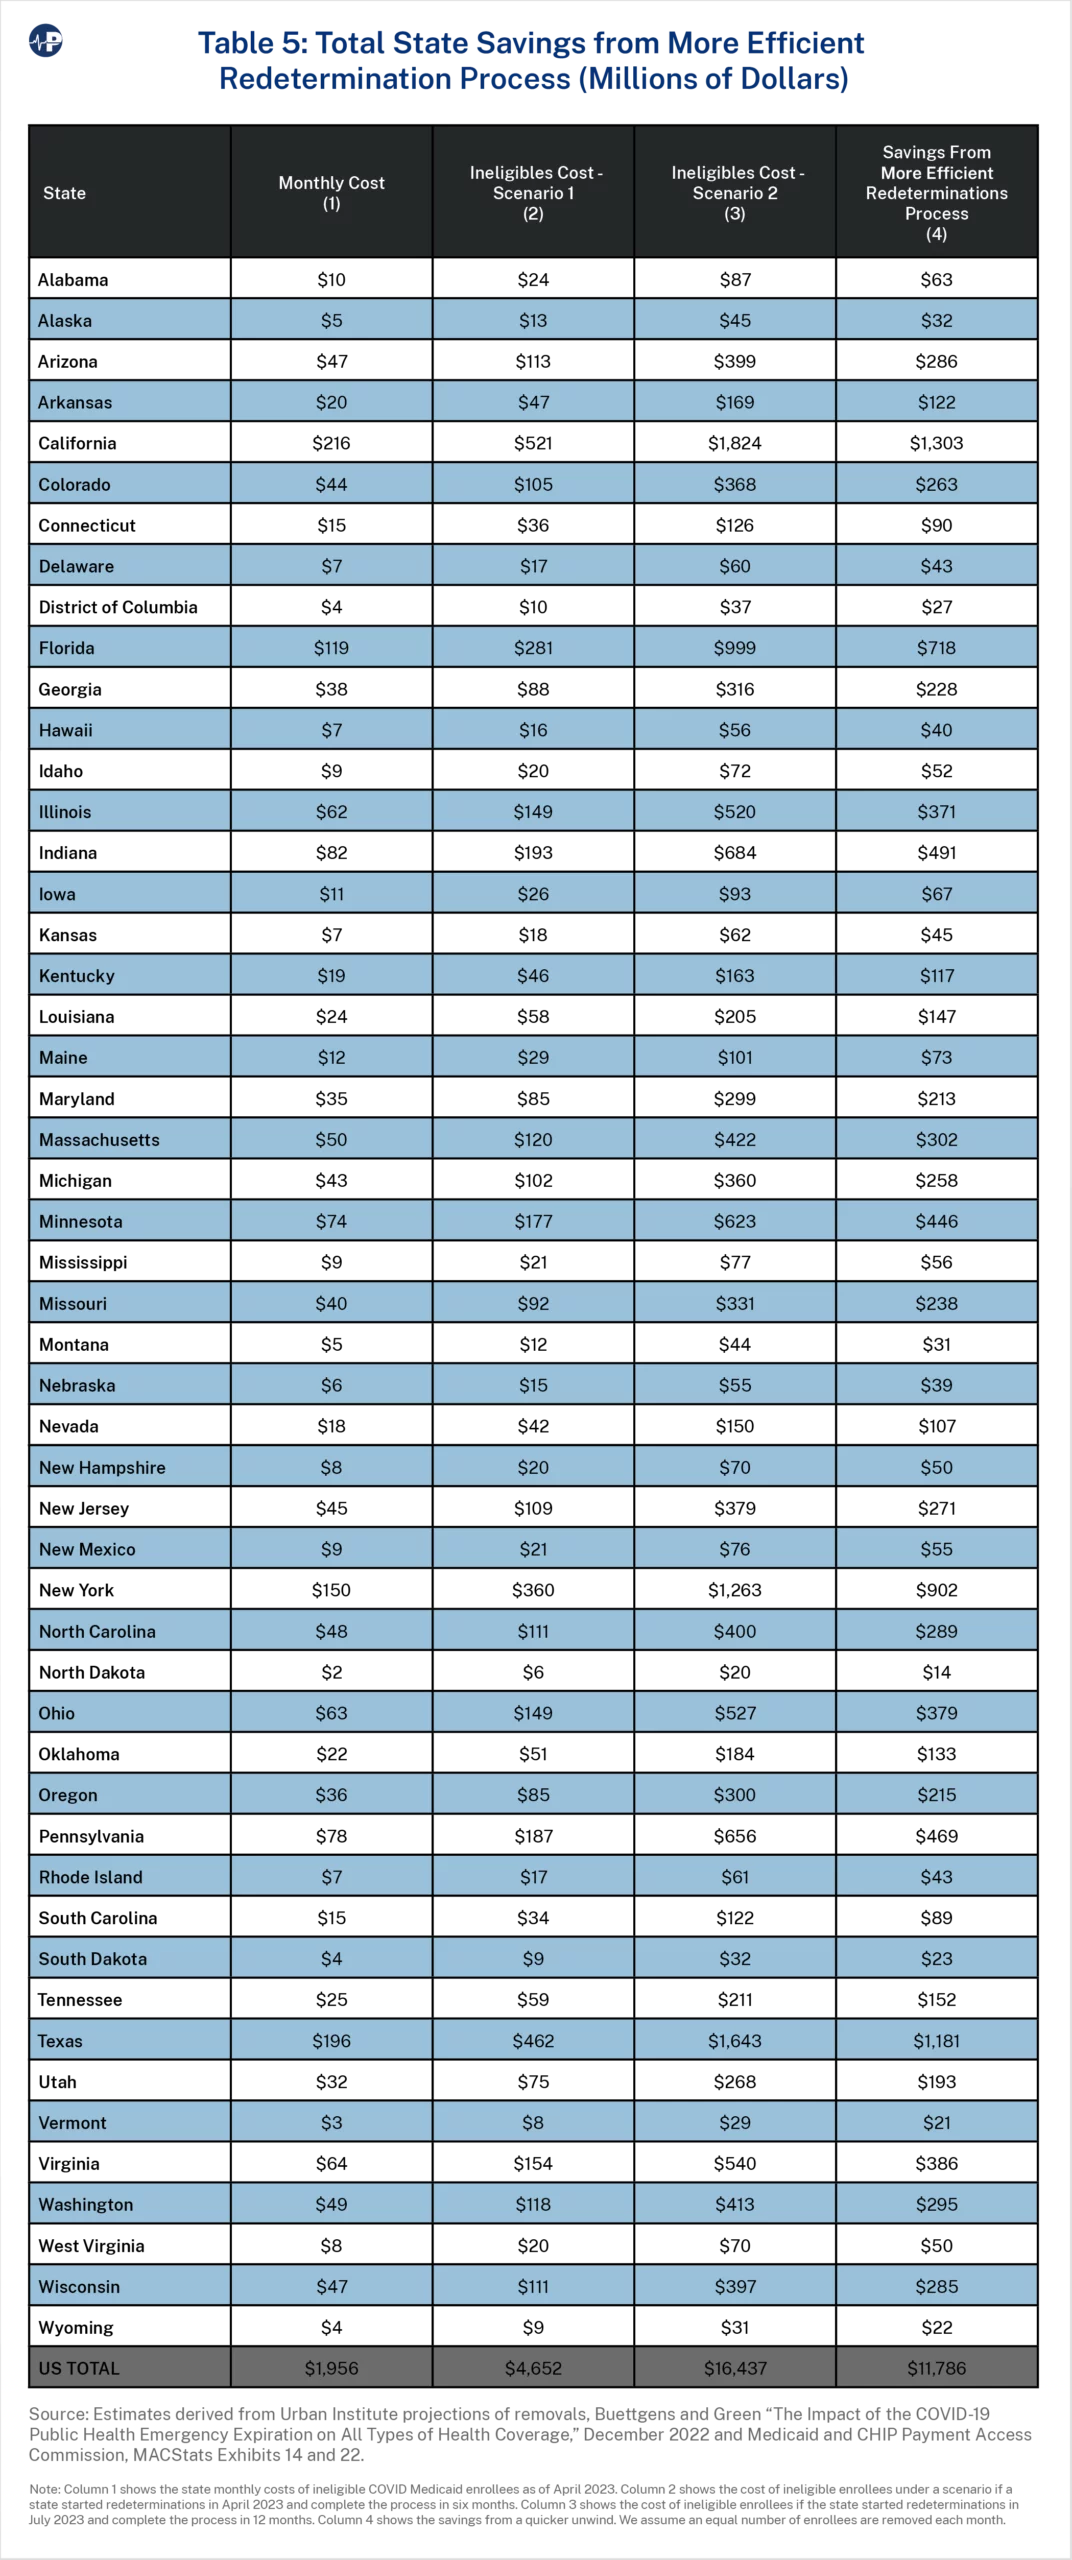
Some states will exceed these estimated savings. For example, Arkansas, South Carolina, and Idaho are closing ineligible accounts at a faster rate than Urban projected,19 resulting in less wasteful spending. The efficient redetermination process deployed by these states could be due in part to differences in how these states prioritized individual redeterminations. For example, states that began redeterminations with enrollees most likely to be ineligible will generate more savings than states that processed redeterminations randomly. Our estimates do not account for these variations, but states that put in the work during the public health emergency to assess whether enrollees would likely be ineligible should have more efficient redetermination processes—that is, they will close a greater percentage of accounts redetermined earlier in the process and a lower percentage of accounts redetermined later in the process.
Timely and effective redeterminations will save states resources that have largely been going to health insurance companies for people ineligible for the program. Florida reports that most Medicaid recipients who have failed to respond to renewal forms have not incurred medical expenses for at least a year—thus resulting in pure profit for health insurers who receive monthly per-member, per-month payments from the government on their behalf.20
As of April 2023, the Medicaid program was spending about $6.8 billion a month on ineligible enrollees, with a state share of nearly $2 billion. Instead of continuing to pay for ineligible Medicaid recipients, states can use these funds for other priorities—both health-related and non-health-related. Nearly all individuals transitioning off the program will obtain other coverage or have access to subsidized coverage. Moreover, as discussed in earlier Paragon work,21 there are significant protections for enrollees mistakenly disenrolled, including three-month retroactive eligibility, hospital presumptive eligibility, and a robust appeals process.
Taxpayers should not be sending payments to health insurance companies or providers for enrollees who are not eligible, and states should act expeditiously to stop this enormous misspending. We estimate that a more efficient redeterminations process will avoid more than $40 billion in wasteful national Medicaid expenditures and save states nearly $12 billion.22
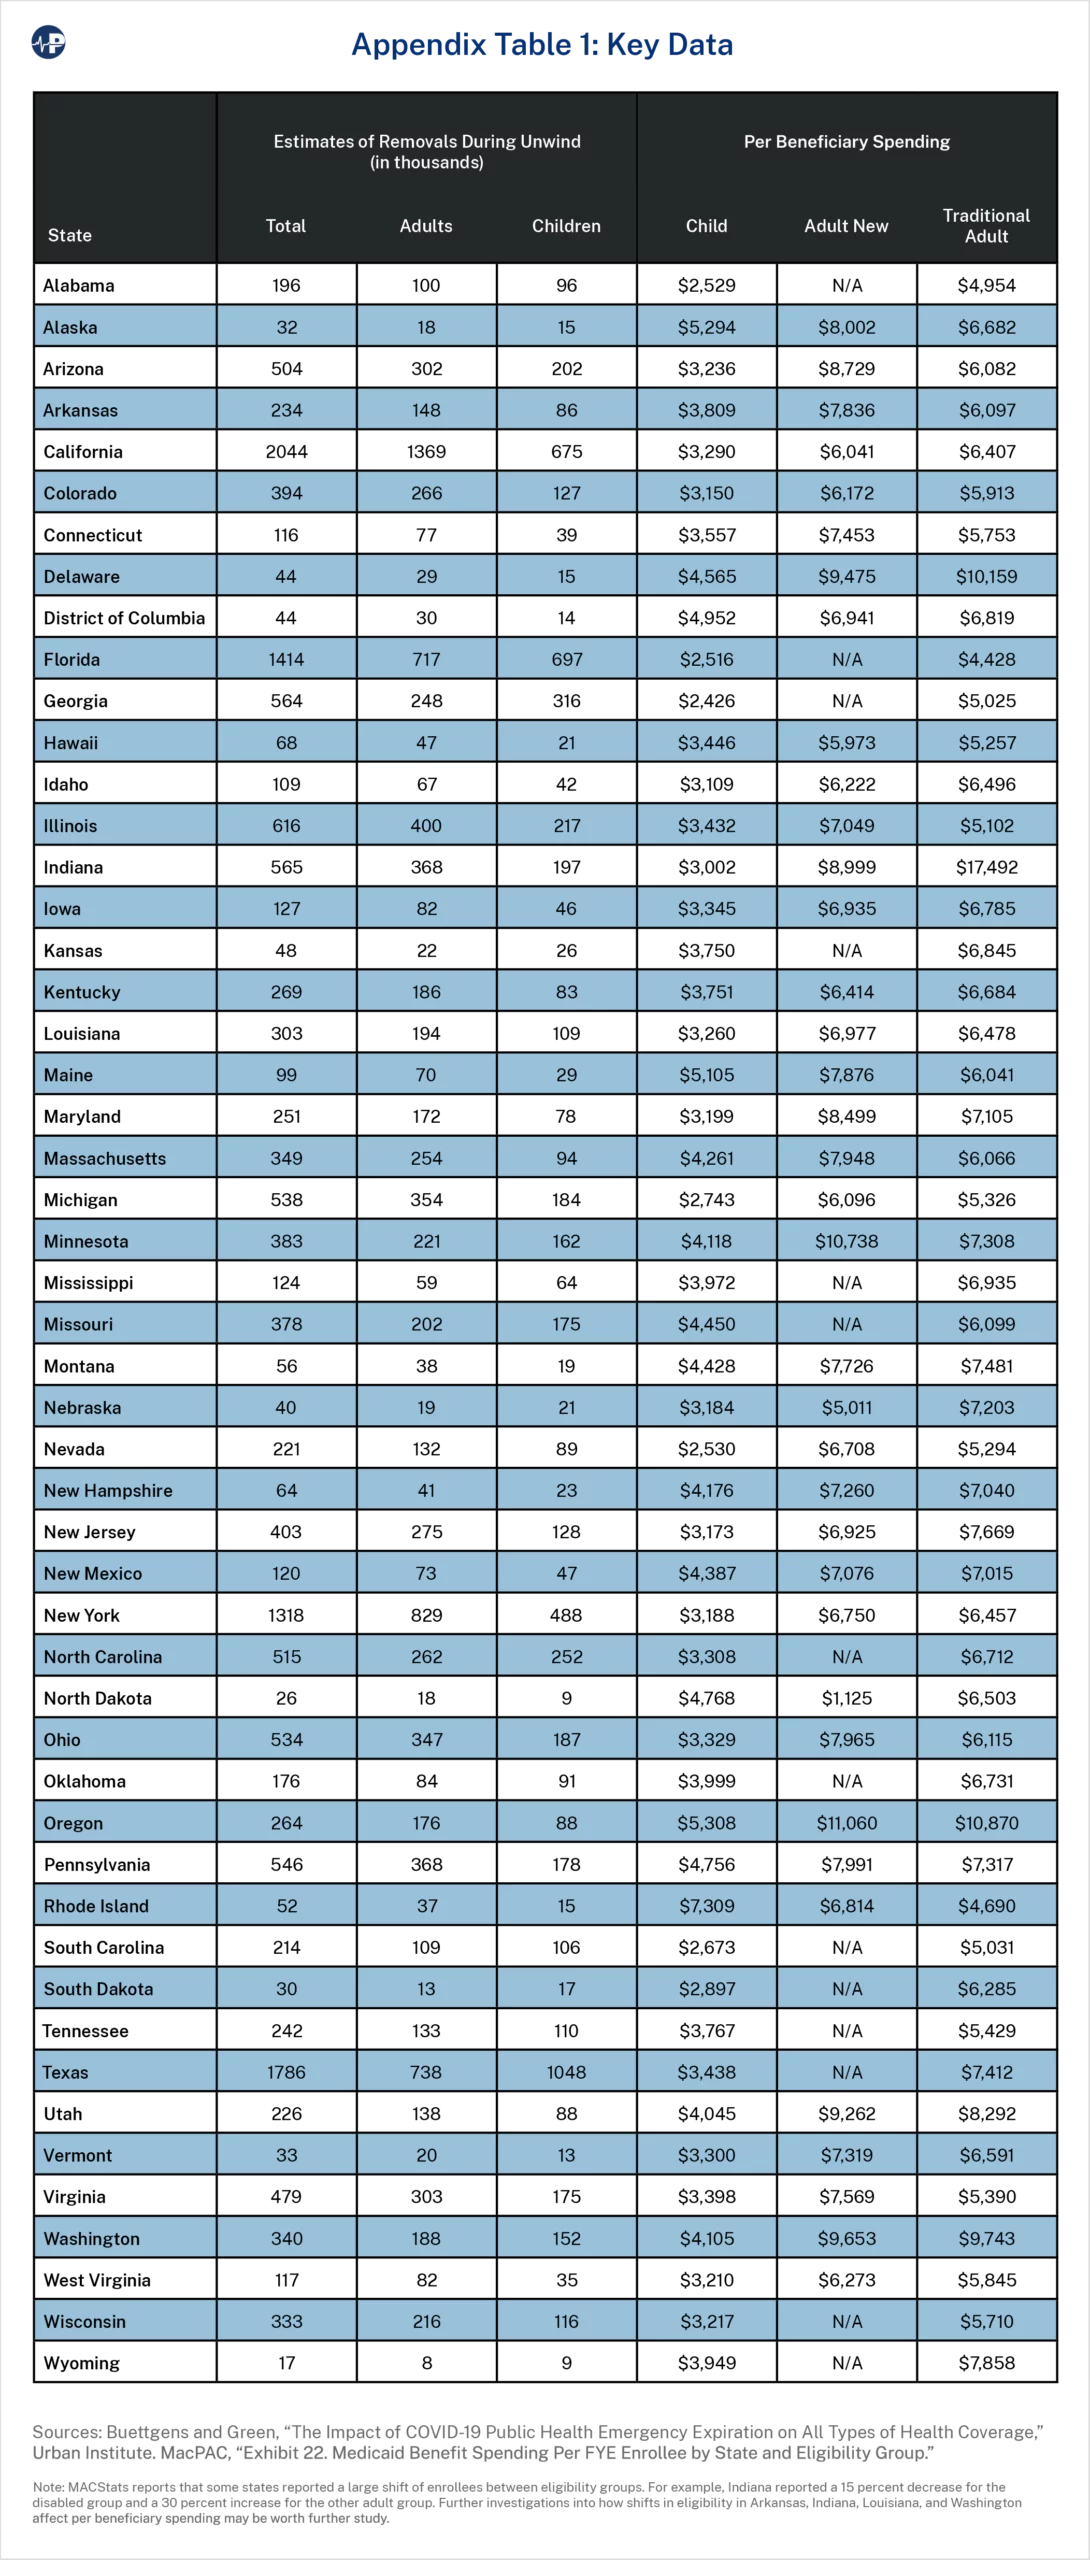
On the next page is a table summarizing the data utilized in estimating costs at the state level. Our estimates are derived using projections from the Urban Institute of the number of ineligble adults and children Medicaid enrollees, by state, and expenditure data by state and eligibility group from MACStats.
Of the 18 million people whom the Urban Institute estimates are ineligible for Medicaid and who will transition off Medicaid during the unwind, an estimated 3.2 million children gain CHIP coverage. Thus, the redetermination savings estimates must include a comparison of costs for children remaining on Medicaid to those gaining CHIP coverage. First, in estimating the redetermination process, we apply costs per child in CHIP. Then, to estimate the state share, we account for the enhanced FMAP (eFMAP), an enhanced reimbursement rate that states receive for the CHIP program. The eFMAP is the regular FMAP increased by 30 percent of the difference of the state’s current FMAP from 100 percent but not to exceed 85 percent. The eFMAP is based on the regular FMAP, so the phase-down of the enhanced federal matching funds indirectly affects the eFMAP. For example, a state with a 50 percent FMAP would have an FMAP of 52.5 percent during the third quarter of the public health emergency. In turn, this results in an eFMAP of 66.75 percent for CHIP.