


Waste, fraud, and abuse in federal health care programs are perennial problems, and large payment errors are a sign of deeper program mismanagement. Recently released data shows over $130 billion per year in improper payments, which are largely driven by unwise Medicaid policies and lax program integrity efforts. Questionable data collection practices mean that actual improper payments are likely much higher. This issue brief will summarize the new improper payments data, offer context from past data, and explain the policy decisions that have led to the significant rise in improper payments as well as limitations in measuring them.
Key Takeaways
- A new report estimates official improper payments made by federal health programs are about $132 billion annually, although actual improper payments are likely far higher.
- CMS data collection practices, including halting meaningful audits of state eligibility determinations for Medicaid and CHIP as well as “COVID-19 flexibilities” substantially underestimate official improper payments.
- Improper payments in Medicaid have soared after the ACA’s expansion of the program.
Overview
On November 15, the Centers for Medicare and Medicaid Services (CMS) released its annual report on improper payments in federal health programs. Improper payments are those that do not meet program requirements and can result from a variety of problems, ranging from outright fraud to unintended documentation errors.1 Improper payments do not encompass payments for low quality or unnecessary services. In the vast majority of cases, improper payments result in overpayment by the federal government.2 Overall, this year’s report shows that an enormous amount of money spent through federal health programs—roughly $130 billion annually—does not comply with program rules.3
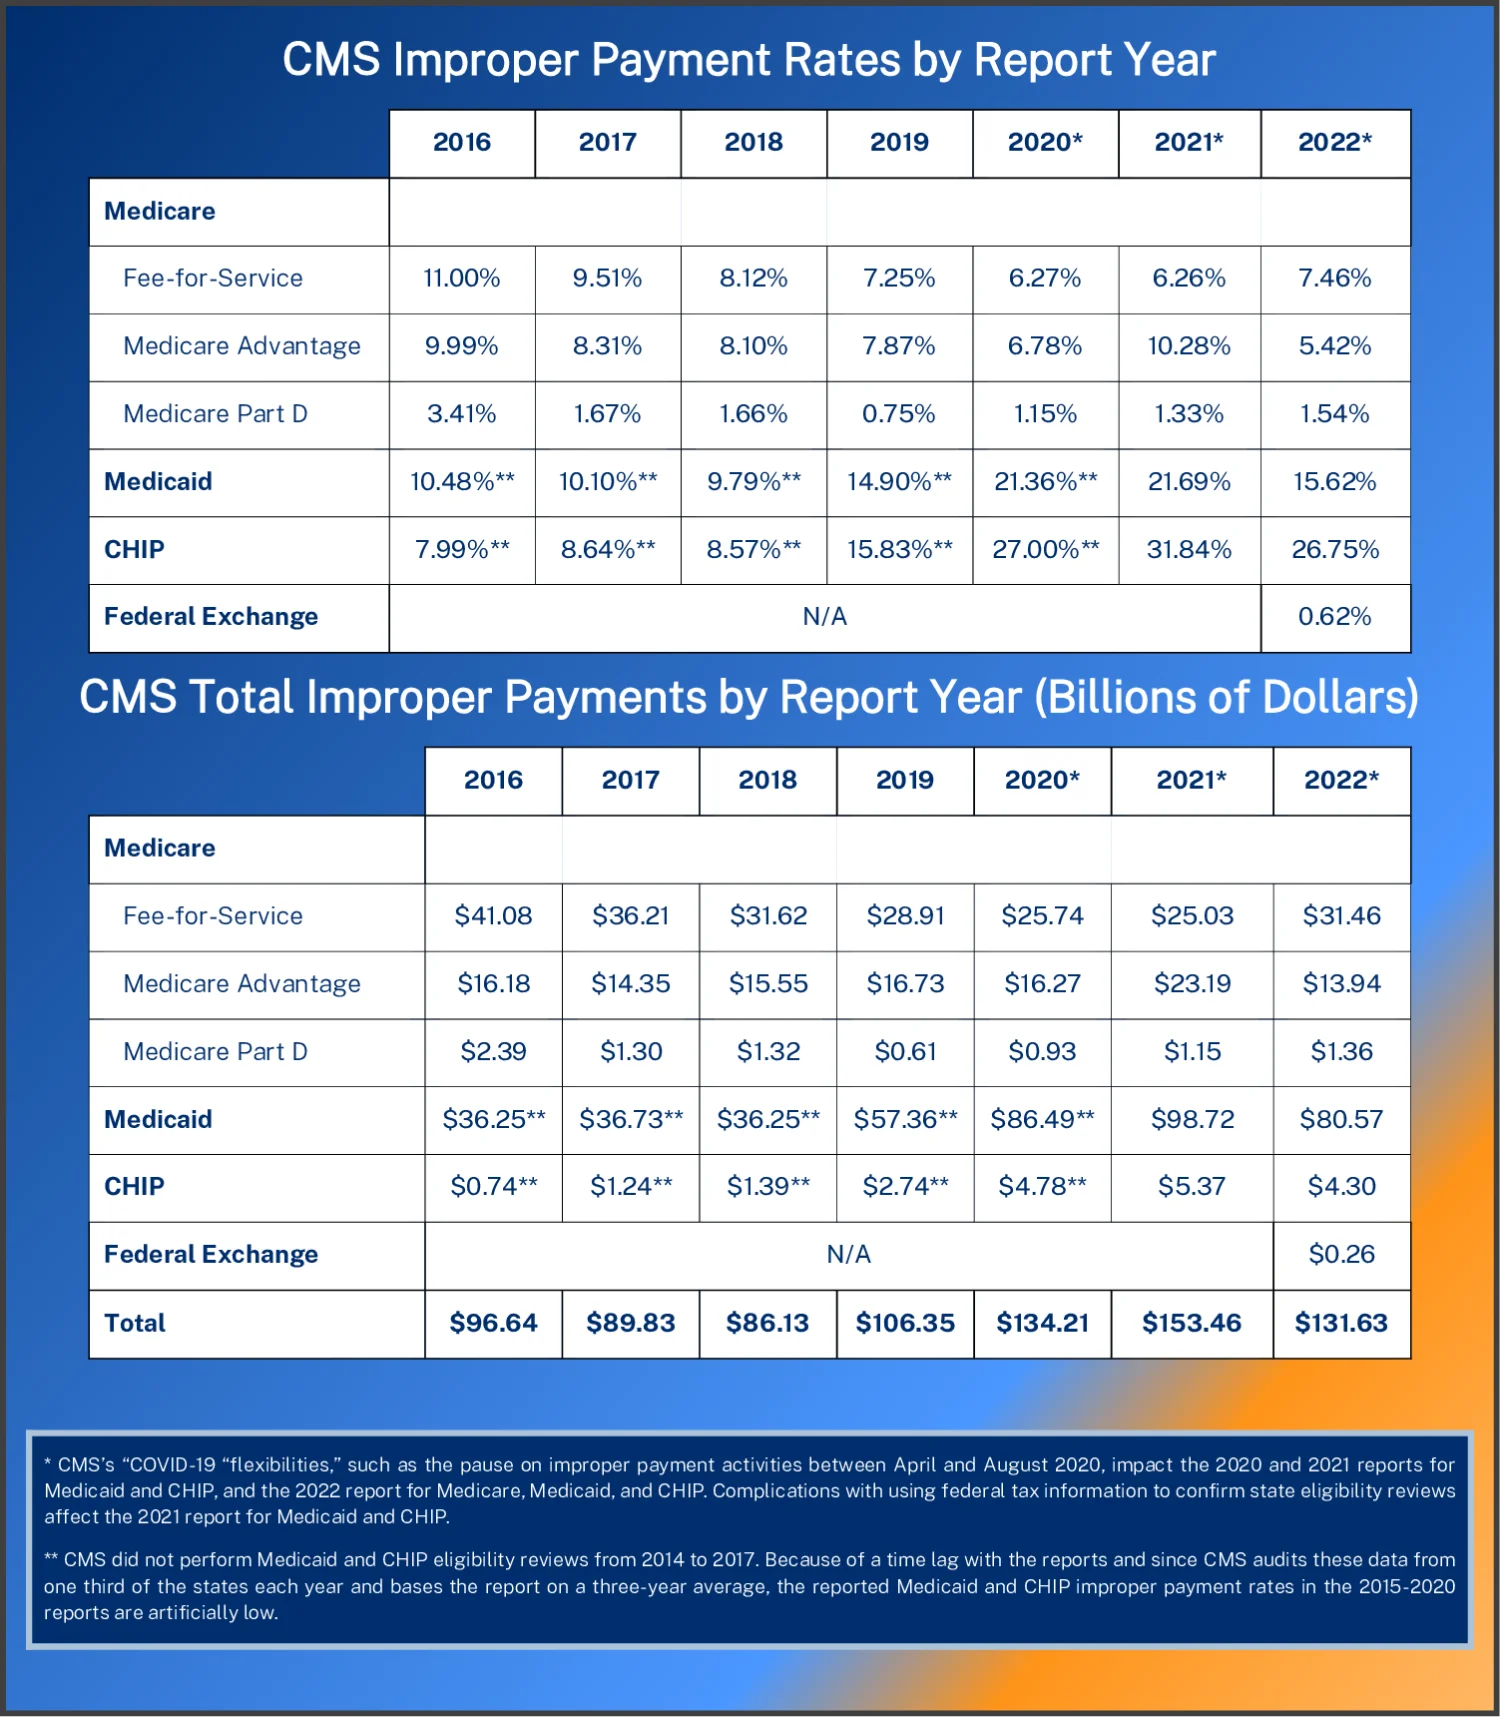
The tables and figures below show the yearly improper payment rate and dollar amount by program.45 CMS’s report contains improper payment rates for each of Medicare’s three components: traditional fee-for-service (FFS), which is comprised of Parts A (hospital coverage) and B (physician coverage); Medicare Advantage (MA), which administers payment for services via private health plans; and Medicare Part D, which is the prescription drug program.
For Medicare, the analysis period for each report is roughly two years prior to the year the report was released. In the 2022 report, Medicare FFS data is from July 1, 2020, through June 30, 2021.6 Also, MA and Part D data is from calendar year 2020.78 For Medicaid and the Children’s Health Insurance Program (CHIP), CMS audits one-third of states each year and reports improper payments as the average of the three most recent years.9
Total estimated improper payments in this year’s report are $132 billion across all reported programs. About 97 percent of the increase in improper payments since the 2018 report has been driven by higher reported misspending in Medicaid. A total of $132 billion in improper payments is a decrease from the amounts reported in 2020 ($134 billion) and 2021 ($153 billion)—years in which reported improper payments were exceptionally high—but this year’s reported improper payments total is still the third highest amount on record. As discussed below, all these estimates are much lower than actual improper payments, and this is especially true this year because of lax Medicaid and CHIP state eligibility audits.
Medicaid
Medicaid’s reported improper payment rate declined in the 2022 report to 15.6 percent, which is an artificially low figure due to CMS’s decision to reduce eligibility audits. Medicaid now provides coverage to about one in four Americans.10 Such rapid expansion and high rate of improper payments are indicators that taxpayers are suffering from poor government policy and program management.
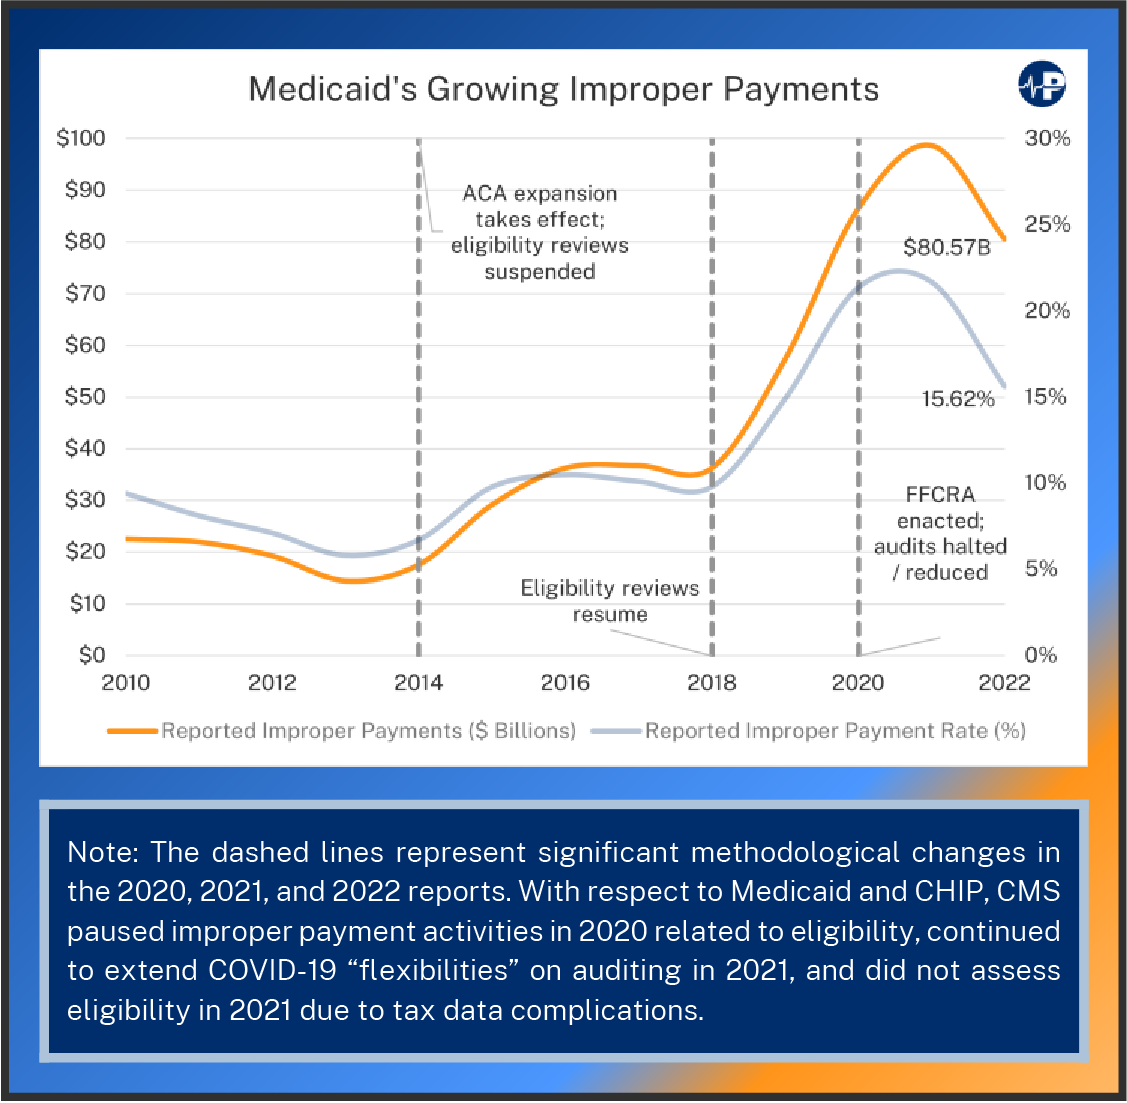
A poorly run Medicaid program also harms the truly needy by misallocating resources.11 The recent, drastic growth in improper payments has coincided with the Affordable Care Act’s (ACA’s) Medicaid expansion. Medicaid was originally designed to assist the most vulnerable Americans, such as low-income pregnant women, children, seniors, and individuals with disabilities. However, the ACA expanded Medicaid to able-bodied adults by enticing states with generous financial incentives. Much of the improper payment problem in Medicaid results from the enhanced federal reimbursement rate for the ACA expansion population. The enhanced reimbursement rate creates a significant incentive for states to enroll people under the expansion criteria even if those people would have been eligible to be enrolled under the prior criteria and thus at the lower reimbursement rate.
Indeed, the ACA’s Medicaid expansion not only diverts more resources from those most in need but also has produced much higher improper payments. In the two reporting years before the ACA’s Medicaid expansion took effect, Medicaid’s improper rate averaged about six percent. With the expansion, the improper payment rate increased substantially, reaching more than 20 percent in the 2020 and 2021 reports.12 The main reason for the growth in Medicaid’s improper payments is that states have failed to ensure people on the program are actually eligible. After conducting audits over a six-month period in 2014 and 2015, HHS’s Office of the Inspector General estimated that just two states—California and New York—made at least $1.7 billion in Medicaid improper payments to cover at least 1.6 million enrollees who were ineligible for the program (estimating at least $4.3 billion more in spending on 3.9 million “potentially” ineligible enrollees, or those enrolled without a proper review of their information and may not have been eligible).13
Since the ACA expansion, CMS has failed to adequately track this rise in misspending on ineligible enrollees. CMS stopped eligibility reviews as part of its overall audits from 2014 to 2017, so the reported Medicaid payments for those years (found in the 2015 through 2020 reports) do not reflect true improper payment estimates. When it restarted eligibility reviews in 2018, there was a huge increase in reported improper payments (from a $36 billion in the 2018 report to $57 billion in the 2019 report), even though only one-third of states had eligibility reviews accounted for in the 2019 report. The 2020 report showed a further surge in Medicaid improper payments (up to $86 billion) as a second third of the states were reviewed for eligibility. Those states, like the first third reviewed, consistently failed to properly determine eligibility for the program. The 2021 report did not fully assess eligibility in the final third of states, citing complications with using federal tax information for income verification.14 Despite this, Medicaid improper payments still rose to $99 billion in that report.
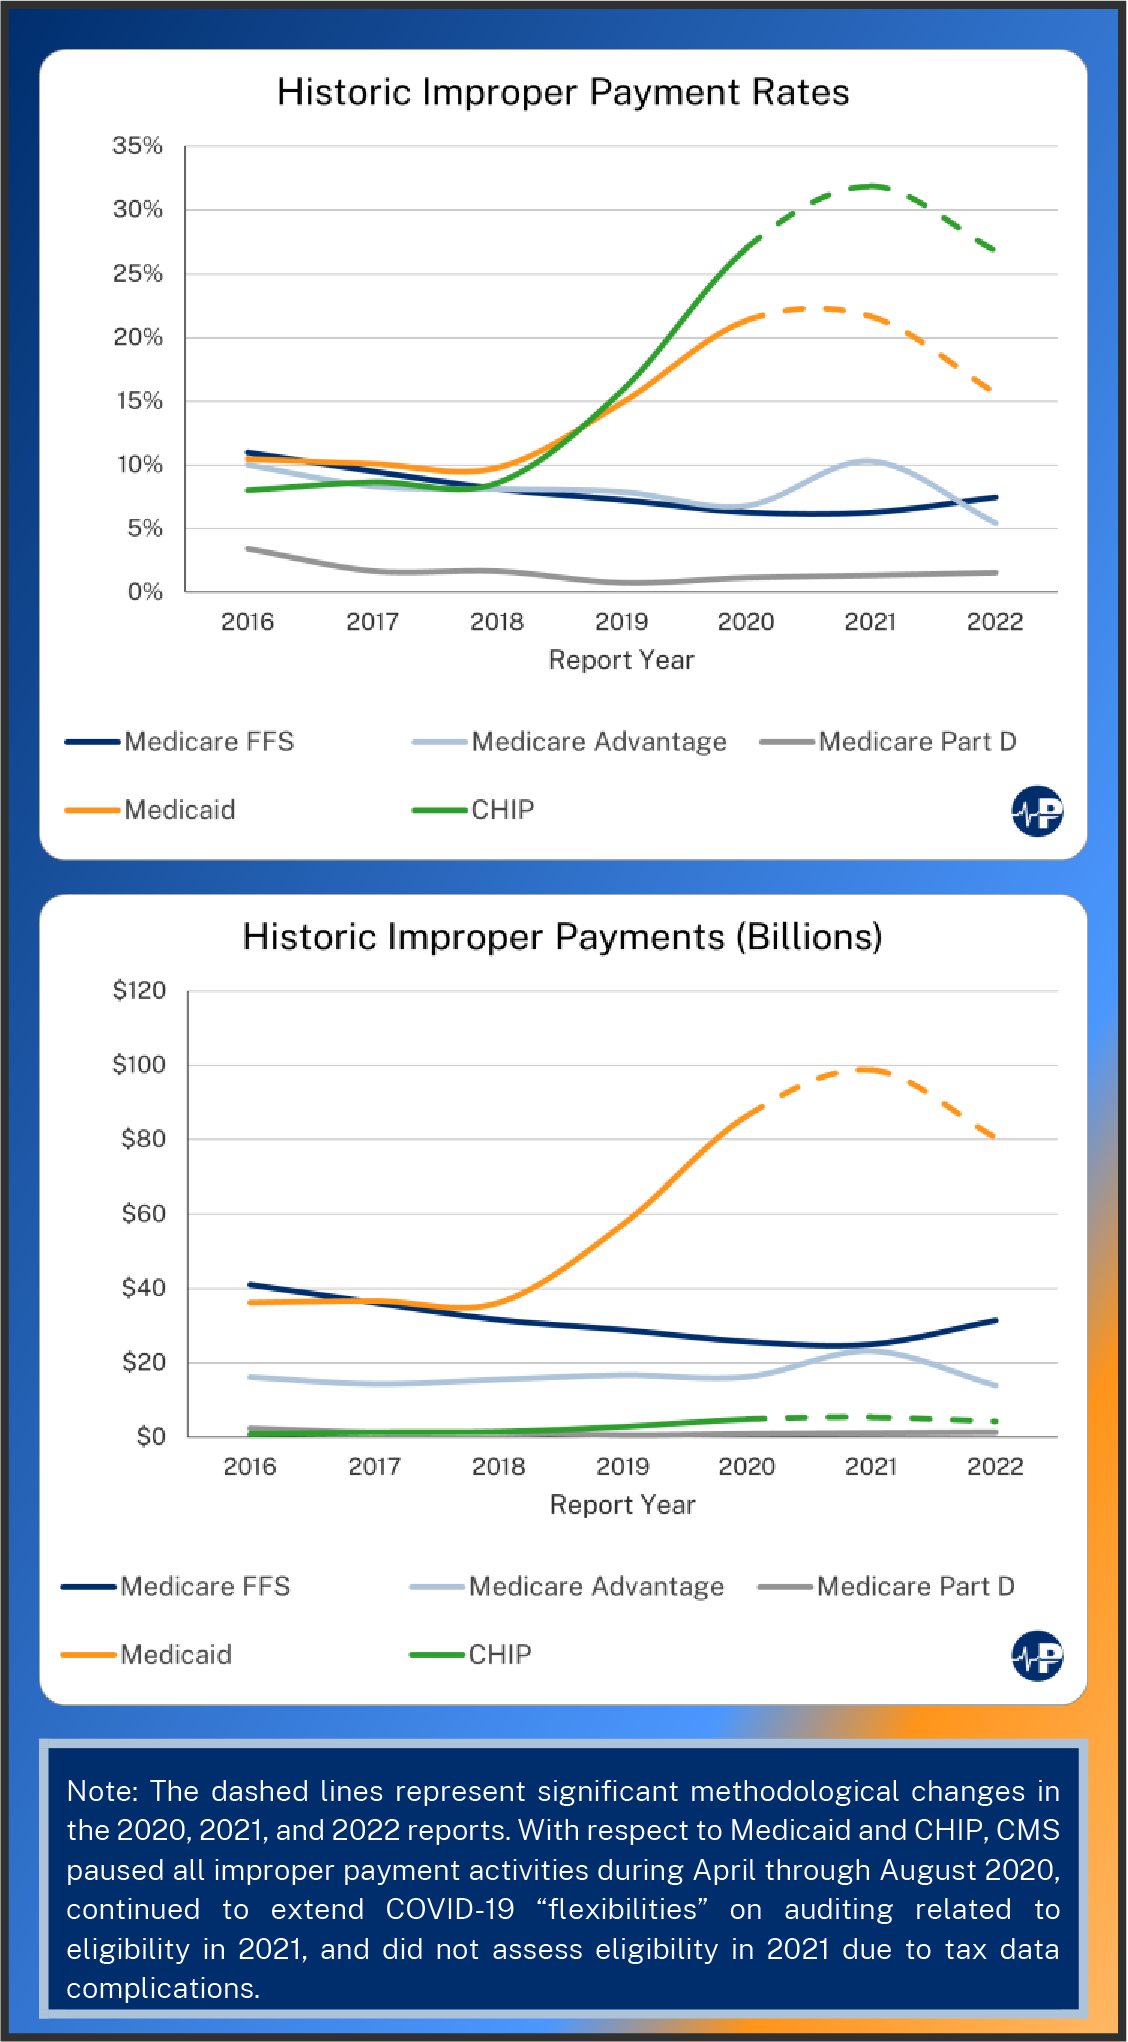
Other shortcomings in CMS’s error measurement stem from the COVID-19 pandemic. CMS paused all its improper payment activities from April to August 2020. The most recent report again cited “COVID-19 flexibilities,” such as postponed eligibility determinations, as a factor in its lower reported improper payments rate in the third of states reviewed this year.15 In short, even this report, which excuses significant problems and does not include meaningful eligibility audits, indicates a high improper payment rate.
The ACA expansion created high improper payments in Medicaid, but the policy response to COVID-19 has only exacerbated it. The enactment of the Families First Coronavirus Response Act (FFCRA) in March 2020 increased federal financial support of Medicaid so long as states did not update their eligibility requirements or remove ineligible people from the program until the public health emergency ends.16 CBO estimated in June 2022 that over one in six Medicaid enrollees—nearly 13 million people—are ineligible for the program but remain enrolled due to these policies.17 The Urban Institute’s estimate of ineligible Medicaid enrollees is 16 million people as of the end of September 2022.18 Because CMS suspended or reduced its activities for collecting improper payment data due to the COVID-19 pandemic, recent reports have undercounted Medicaid and CHIP errors.19
CHIP’s improper payment rate has also risen substantially since the 2019 report. In reporting year 2021, nearly a third of program payments were improper (this too is almost certainly an undercount for many of the same reasons described above). In the 2022 report, official improper payments declined to one quarter of program payments. CHIP’s total loss of dollars is less than other programs’ losses because of its smaller overall size.
Midicare
In the most recent report, improper Medicare payments slightly increased for FFS and Part D, while decreasing in MA. These fluctuations come after CMS changed how it calculates its error estimates for MA. Specifically, in the prior year, CMS began to focus its calculations on a subset of the MA expenses most at risk for diagnostic error. As a result of this measurement change, the 2021 report estimated an inflated improper payment rate.20 While Part D improper payment rates are consistently and significantly lower than the rest of Medicare, rates for FFS and MA are typically within two percentage points of each other. Reporting year 2022 is the first since 2016 in which FFS improper payment rates have increased. FFS improper payment rates have generally declined since 2016, as have MA’s improper payment rates. However, CMS’s pause on improper payment activities in 2020 also likely undercounts the Medicare improper payment rates reported in the 2021 and 2022 reports.
Documentation problems—such as failing to submit medical records along with billing records—are the most common form of improper Medicare payment.21 In FFS, such problems could lead to a failure to demonstrate that a service was medically necessary; in MA, it may mean that a patient’s diagnosis could not be confirmed for risk adjustment payments.22
One factor that sets MA and Part D apart from FFS is that their private plans can deploy more tools to control utilization, such as prior authorization requirements. While some have decried such requirements as barriers to access of care for beneficiaries, policymakers should be careful not to impose unnecessary obstacles on their use because they serve as a deterrent to waste, abuse, and improper utilization.
Importantly, Medicare is the U.S.’s largest single health care program and the second largest federal program with an estimated $846 billion in Fiscal Year 2023 spending.23 Therefore, even with lower error rates than Medicaid and CHIP, the Medicare program’s sheer size indicates that improper payments should remain an important concern for policymakers.
Taking Improper Payments Seriously
Unfortunately, improving program integrity is much harder when federal officials do not even acknowledge the severity of the problem. Rather than conducting appropriate audits, CMS has instead touted findings in its first year of reporting data from the federal ACA exchanges, while pointing out that the FFS improper payment rate remains under the 10 percent mark.
CMS has also taken pains to point out that improper payments are not necessarily fraud or abuse. However, the Justice Department has uncovered billions of dollars in fraud in recent years.2425 Fraud related to COVID-19 response efforts has become more salient.26 Thus, it is reasonable to suspect that fraud has increased along with other types of improper payments over the past few years. Although improper payments do not account for utilization of care that is of little value or that may be harmful to patients, improper payment rates of this magnitude demonstrate some combination of a poor program design as well as government failure to properly manage America’s largest federal health care programs.
Conclusion
This year’s improper payments data might be most charitably summed up as “less bad than last year’s,” but this is too generous given CMS’s shortcomings in measurement and data collection. Even taking these numbers at face value, enormous errors and misspending permeate Medicaid and CHIP. Yet, as discussed above, the reported improper payment rates for Medicaid and CHIP are much lower than reality because of how CMS largely failed to conduct meaningful eligibility reviews over the past two years.
Overall, as the federal role in the American health care system has increased, so too have waste, fraud, abuse, and erroneous payments. The tens of millions of Americans who rely on these programs, as well as taxpayers, deserve better than this enormous mismanagement and careless spending. As massive federal deficits and the impending insolvency of Medicare’s Part A trust fund present increasingly urgent concerns, change is needed more than ever. Policymakers should reform government health programs in ways that expand patient control of the dollars as patients would then have incentives to ensure higher value expenditures. And the political leadership in charge of managing these programs must prioritize program integrity efforts.