


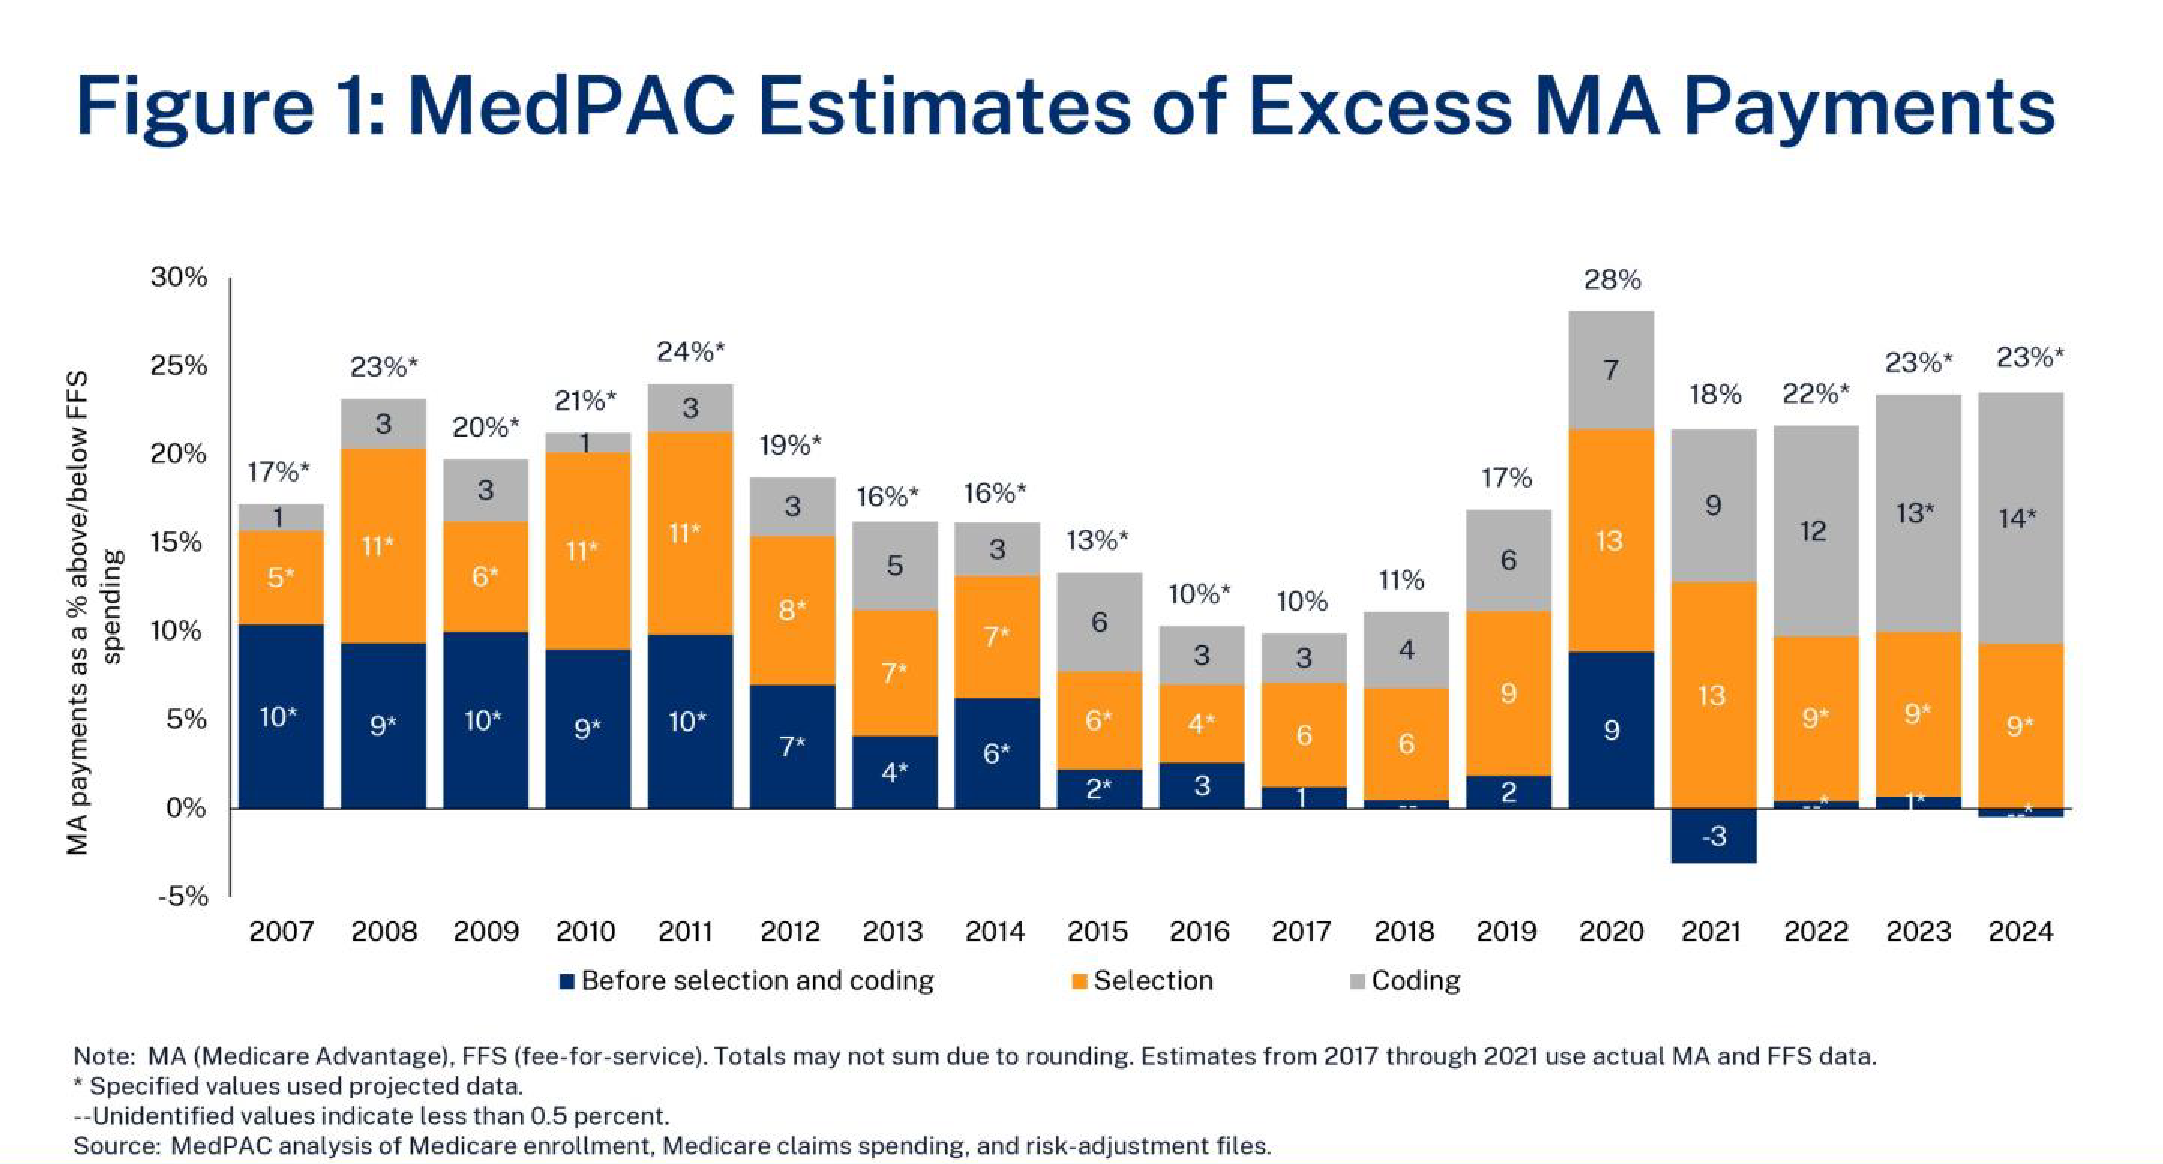
Medicare Advantage (MA) is a program where private insurance plans cover core Medicare benefits (besides hospice) and may offer drug coverage, supplemental benefits, and reduced premiums or cost-sharing relative to traditional fee-for-service (FFS) Medicare. MA plans typically have lower costs than FFS for providing Part A and B benefits.1 However, some argue MA is overpaid. In its January 12, 2024, public meeting, Medicare Payment Advisory Commission (MedPAC) staff estimated that 2024 MA spending is 23 percent higher than FFS ($88 billion) due to coding intensity (14 percent or $54 billion) and favorable selection (9 percent or $36 billion).2 Figure 1 shows MedPAC’s estimates of these two factors over time. Ensuring efficient Medicare spending is an important goal, but policymakers should understand the full context of this analysis.
Key Takeaways
- MedPAC recently estimated that MA payments are 123 percent of FFS spending due to coding intensity and favorable selection.
- While coding intensity and favorable selection are important issues, MedPAC likely overestimates MA’s excess payments from these factors.
- Policy changes can address these factors, but some may have negative consequences on MA program design and plan incentives.
Background
MA plans receive capitated payments that are primarily set by county-level benchmarks of average FFS spending and by plan bids. Payments are risk-adjusted, which means that plans receive higher payment for enrollees with higher expected costs and lower payment for enrollees with lower expected costs. This is intended to counteract the incentive that would otherwise exist for plans to avoid expensive enrollees. Risk adjustment payments are calculated based on demographic factors (age, sex, disability status, and Medicaid eligibility) and patient health condition. The latter is determined by patient diagnoses reported by plans or, more recently, from encounter data. The Centers for Medicare and Medicaid Services (CMS) constructs a model estimating risk scores from
enrollees’ expected relative costs.
Because plans receive more payment for patients with more risk factors, they have an incentive to report diagnoses more thoroughly than FFS does. “Coding intensity” refers to higher MA risk scores—and score growth—relative to FFS. CMS by law must reduce payments by at least 5.9 percent to account for this factor.
Discussion
In January 2024, MedPAC estimated that MA coding intensity is 20.1 percent, leading to 14.2 percent in overpayments after the statutory adjustment.3 About half of this is due to diagnoses that result from health risk assessments in the Medicare Annual Wellness Visit (17 percent) or chart reviews (34 percent). Two key factors provide context on coding intensity:
- Higher coding intensity does not necessarily mean that MA risk scores are inherently inaccurate or that the underlying diagnoses are incorrect. Policymakers should be mindful that the intent of risk adjustment is to properly compensate plans for sicker and costlier enrollees and ensure that they do not avoid those patients. Accurately reporting the factors that may impact patient costs is crucial to this effort and can help to ensure proper care.
- Because FFS payments are largely not risk-adjusted, there is less incentive to thoroughly record diagnoses for FFS enrollees. Similar efforts to systematically increase coding accuracy in FFS would likely increase its risk scores and reduce estimated coding intensity.
While policy changes can attempt to address particularly aggressive coding practices and avoid excessive risk adjustment for enrollees who are not actually sicker, they should be well-targeted and minimize the potential unintended consequences resulting from a few well-known proposals:
- MedPAC has recommended excluding diagnoses that result from health risk assessments from risk scores. This could disincentivize plans from encouraging preventive screenings intended to identify health risk factors and lead them to push extra unnecessary visits to confirm diagnoses in medical records, driving up utilization and costs.
- Reducing payment across the board harms some plans more than others because risk scores and diagnostic practices vary. According to MedPAC, 83 percent of enrollees belong to plans with coding intensity in excess of the 5.9 percent adjustment (including seven of the eight largest MA organizations), and 17 percent have plans where the reductions exceed coding intensity.
- Expanded program integrity efforts or law enforcement activities can help address egregious or unlawful upcoding.4
Background
MA payments are based on average FFS costs. The implicit assumption of this arrangement is that risk-adjusted health care spending in MA is equal to FFS—that is, enrollees with the same risk score in MA and FFS are expected to have the same health care costs on average (although actual costs may be above or below expectations). “Favorable selection” occurs if MA consistently attracts enrollees with lower spending than expected by their risk scores. Theoretically, this allows plans to bid lower than FFS-based benchmarks can without having to provide more efficient coverage.
Discussion
In January 2024, MedPAC staff estimated that favorable selection reduces MA health care spending by 9 percent.5 MedPAC argues that MA benchmarks therefore do not accurately reflect the cost of MA enrollees, leading to overpayments that are additive to those from coding intensity.
Several factors may lead MedPAC to overestimate favorable selection in MA:
- The lack of incentive to thoroughly code diagnoses in FFS means that those with higher FFS spending have risk scores that are too low. Furthermore, MedPAC has said that coding differences account for a small, but non-zero, share of favorable selection: Risk scores for MA entrants were 2 percent higher than scores for those staying in FFS in 2017.6
- Contrary to what MedPAC has previously found, another study suggests that favorable selection decreases as enrollment in MA continues over time.7 This study looks at mortality rates in MA and FFS rather than spending before and after switching to MA, which means the results are more generalizable to the full Medicare population because it includes those who remain in MA or FFS rather than focusing on those who switch.
- Spending is not perfectly correlated with health status. Certain groups that are disproportionately more likely to enroll in MA than FFS, such as racial and ethnic minorities, may have lower average FFS spending not because they are healthier but because they consume fewer health care services, perhaps due to difficulties accessing or navigating care.8 Indeed, unique aspects of MA’s design—such as a mandatory out-of-pocket cap and integrated coverage offerings from special needs plans—may encourage more enrollment by sicker individuals. On the other hand, Medigap coverage, which is concentrated among wealthier beneficiaries, leads to higher FFS spending.9
Policymakers should keep in mind that favorable selection is partly due to structural and policy differences between MA and FFS:
- MA plans achieve efficiencies relative to FFS by limiting their provider networks based on quality or cost and by managing utilization of unnecessary or costly services. This may dissuade those who consume more health care from enrolling in MA. Although MedPAC argues that savings from favorable selection occur before MA plans produce efficiencies in care delivery, these practices do seem to have an indirect impact based on this dynamic. If FFS had more mechanisms to control low-value utilization, these incentives may change.
- Default enrollment in FFS means a beneficiary must make an active decision to switch to MA, which will be more likely for those who can tolerate a network and utilization management.
- Medicare hospice coverage is provided only by FFS (even for those in MA). The lack of an integrated hospice benefit in MA may lead terminally ill enrollees with higher costs to switch to FFS. About half of MA disenrollments in the last year of life are hospice users.10
- Supplemental Medigap plans raise FFS spending by up to 27 percent by reducing or removing the costs borne by beneficiaries at the point of care without having to internalize the full impact on the overall cost of coverage, as MA plans do. Restricting first-dollar Medigap coverage could address this incentive.11 Medigap plans can also charge higher premiums to those switching from MA to FFS, which discourages initial MA enrollment.
Conclusion
As policymakers review MedPAC’s estimates, it is important to recognize various factors that may overstate the extent of excess MA payments or may identify the wrong policy levers to address them.
Ensuring that MA operates efficiently is a worthy policy objective. Managing issues, such as coding intensity in MA, could help keep Medicare fiscally sustainable while delivering high quality care to beneficiaries. But these efforts should be informed by a proper diagnosis of the problem.12