Dr. Joel M. Zinberg
Joel M. Zinberg, M.D., J.D. is the Director of the Public Health and American Well-Being Initiative at Paragon Health Institute,…
Reforming Government, Empowering Patients
Navigation

This paper looks at how states that implemented more severe interventions during the pandemic did not meaningfully improve health outcomes — and had much worse educational and economic outcomes — compared to states that imposed less restrictive measures.
The COVID-19 pandemic led to government interventions into the social and economic structures of our society that were unprecedented in their severity and duration. The fact that different states and localities took different approaches to imposing these measures created an opportunity to determine whether these interventions improved health outcomes, what economic and social side effects the interventions caused, and whether the interventions influenced people’s decisions about where to live.
This paper compares a quantitative measure of government interventions from the Oxford COVID-19 Government Response Tracker—a systematic collection of information on policy measures that governments have taken to combat COVID-19—to health, economic, and educational outcome measures in all 50 states and the District of Columbia. We use the Government Response Index, which is the Oxford researchers’ most comprehensive index.
Our results show that more severe government interventions, as measured by the Oxford index, did not significantly improve health outcomes (age-adjusted and pre-existing-condition adjustedCOVID mortality and all-cause excess mortality) in states that imposed them relative to states that imposed less restrictive measures. But the severity of the government response was strongly correlated with worse economic (increased unemployment and decreased GDP) and educational (days of in-person schooling) outcomes and with a worse overall COVID outcomes score that equally weighted the health, economic, and educational outcomes.
We also used Census data on domestic migration to examine whether government pandemic measures affected state-to-state migration decisions. We compared the net change in migration into or out of states in the pandemic period between July 1, 2020, and June 30, 2022, with the migration patterns over five pre-pandemic years. There was a substantial increase in domestic migration during the pandemic compared to pre-pandemic trends. There was also a significant negative correlation between states’ government response measures and states’ net pandemic migration, suggesting that people fled states with more severe lockdowns and moved to states with less severe measures.
A comparison of two populous states that took divergent approaches to government pandemic measures—Florida and California—exemplifies the impact of government measures. Florida relaxed lockdowns after a short time, resulting in a low Oxford COVID-19 Government Response Index score, whereas California imposed strict and prolonged lockdowns and had one of the highest index scores in the nation. Yet the two states had roughly equal health outcomes scores, suggesting little, if any, health benefit from California’s severe approach. But California suffered far worse economic and education outcomes. And both states had substantial increases in their pre-existing domestic migration patterns. California’s severe lockdowns seemed to elicit a jump in its already high out-migration, while Florida experienced a significant in-migration increase during the pandemic as compared with pre-pandemic trends. Florida’s commitment to keeping schools open was likely a significant factor in attracting people from around the country.
This study confirms what multiple other studies have documented: Severe government measures did little to lower COVID-19 deaths or excess mortality from all causes. Indeed, government measures appear to have increased excess mortality from non-COVID health conditions. Yet the severity of these measures negatively affected economic performance as measured by unemployment and GDP and education as measured by access to in-person schooling. States such as Florida and countries such as Sweden that took more restrained approaches and focused protection efforts on the most medically vulnerable populations had superior economic and educational outcomes at little or no health cost. The evidence suggests that in future pandemics policymakers should avoid severe, prolonged, and generalized restrictions and instead carefully tailor government responses to specific disease threats, encouraging state and local governments to balance the health benefits against the economic, educational, health, and social costs of specific response measures.
The COVID-19 pandemic that began in the early months of 2020 elicited unprecedented government interventions in the economic and social structures of our society. These measures included mandatory, state-enforced closures of businesses, schools, and recreational and religious facilities; restrictions on public gatherings; stay-in-place orders; and masking and social distancing requirements. It also included government economic measures to support incomes and freeze financial obligations and government health measures to facilitate vaccination and create testing and contact tracing programs. This paper often refers to the government measures imposed during the pandemic collectively as lockdowns.
Previous pandemic plans never anticipated imposing these sorts of measures for more than limited amounts of time. Yet during the COVID-19 pandemic, they were often applied for many months and, in some locations, for years.
Since public health decisions are generally reserved to the states as police powers under the U.S. Constitution, each state decided which measures to impose and for how long. Different states and localities took different approaches, creating a natural experiment to determine if these measures improved health outcomes and what economic and social side effects they caused.
One of the authors of this paper (Mulligan) previously co-published a study measuring and comparing different economic (measured by states’ increase in unemployment and decrease in GDP, both adjusted for state industry composition), health (measured by COVID-associated deaths that have been adjusted for states’ age distributions and pre-existing health conditions, and all-cause excess mortality), and educational (measured by days of in-person instruction percentage) outcomes across the 50 states and District of Columbia through March 2022.1 The study also computed each state’s overall outcomes score by equally weighting the three outcome measures.
The study found no apparent relationship between economic outcomes and health outcomes, indicating that states that withdrew the most from economic activities through lockdown measures did not improve health by doing so. The economic outcomes score was strongly positively correlated with the education outcomes measure, suggesting a relationship between states’ willingness to resume normal economic activities and normal in-person schooling.
But the study did not measure the severity of government measures directly. The economic outcomes score functioned as a surrogate, indicating a state’s willingness to close down normal activities.
This paper uses the calculated health, economic, and educational measures from the earlier paper and compares them with a direct measure of government interventions, the Oxford COVID-19 Government Response Tracker—a standardized and systematic cross-national, cross-temporal measure of government responses to the pandemic including containment and closure policies, economic policies, health system policies (including but not limited to testing and masking policies), and vaccine policies. The Oxford researchers produced four indices that aggregate the data into a single number from zero to 100. We utilized the most comprehensive of the indices, the Government Response Index (hereinafter referred to as the Oxford Government Response Index or simply the Oxford index).2
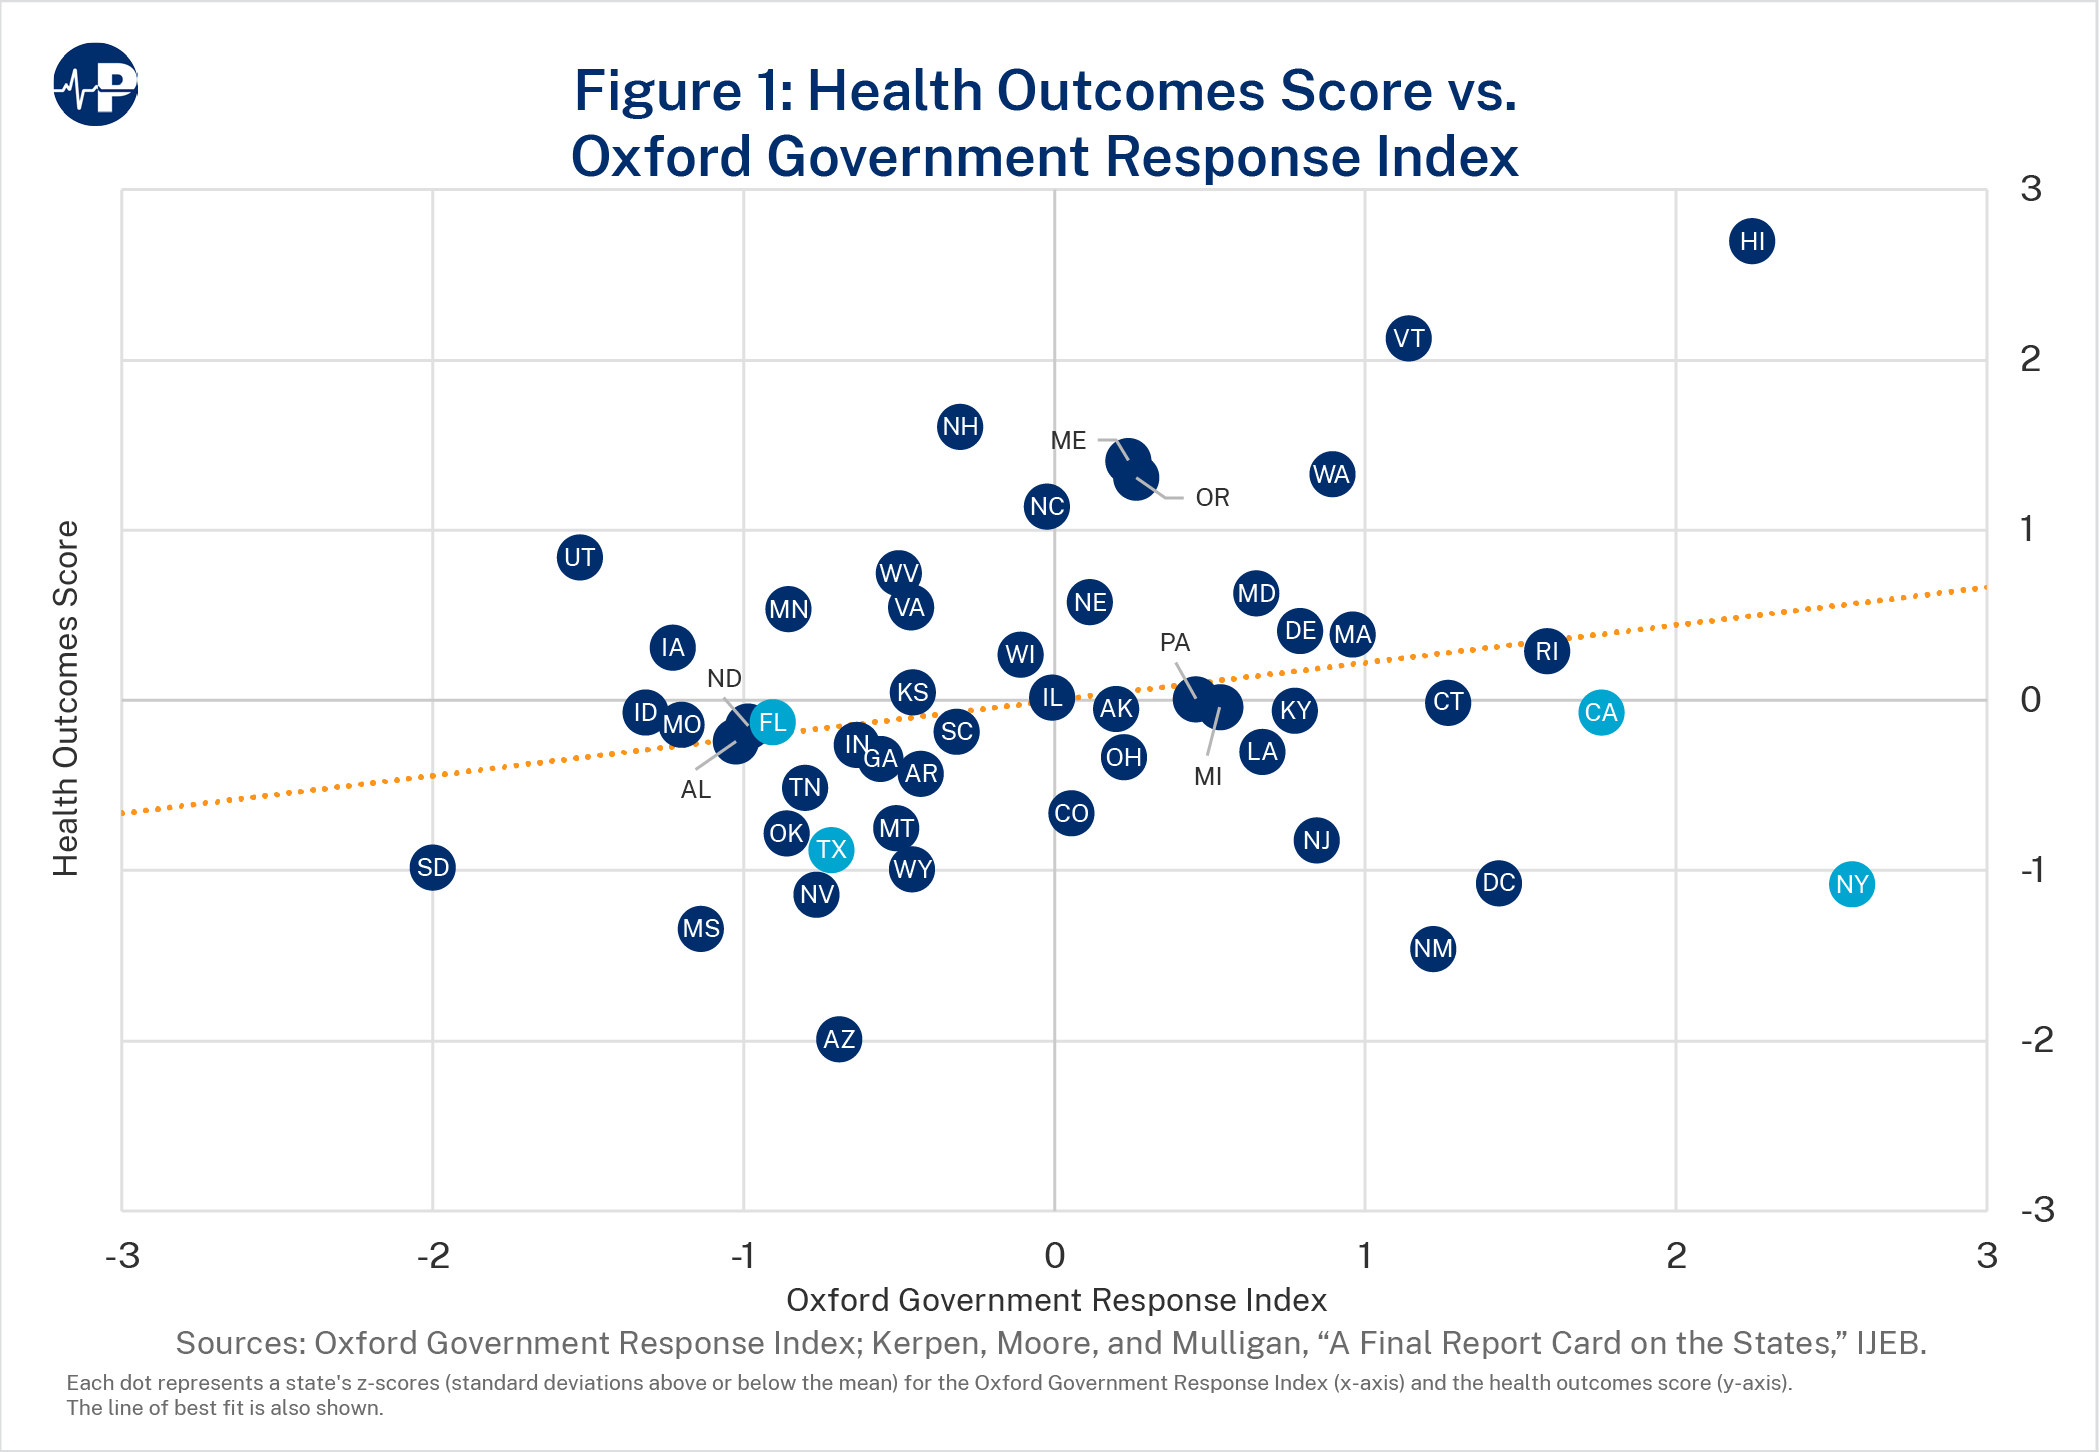
Our results show that the Oxford index is not correlated with the health outcomes score, confirming the conclusion of the earlier paper that more severe lockdowns did not result in improved health outcomes. But the severity of government response was strongly correlated with both worse economic outcomes and worse overall outcome scores.
While academically interesting, statistical scores and indices may not accurately reflect what citizens actually experience. We therefore checked whether people disliked lockdowns enough to move away from them by examining the relationship between the government response measures and interstate migration. We compared the net change in migration into or out of states in the 2020–22 pandemic period with the average migration values over five pre-pandemic years and found a substantial increase in domestic migration during the pandemic. Comparing states pandemic migration changes (in or out) with their Oxford Government Response scores indicated that many people voted with their feet. Higher government response scores (more severe lockdowns and interventions into the economy and health systems) were negatively correlated with migration. In other words, people left lockdown states and moved to states with less severe measures.
Finally, we illustrate the impact of government measures by comparing two of the largest states in the nation, California and Florida, that took opposite approaches. Florida, like the rest of the nation, initially imposed lockdowns in the spring of 2020 but began relaxing those measures in the late spring/early summer and completely removed most by the fall of 2020. It had a low Oxford index score. California, in contrast, imposed strict and prolonged lockdowns that are reflected in one of the highest Oxford index scores in the nation. These disparate approaches were notable given that it was apparent early in the pandemic that COVID-19 infection mortality rises sharply with advanced age. California has one of the youngest populations in the country yet imposed strict measures while Florida, with the second oldest population in the nation, took a more restrained approach.
Despite their differing approaches, the two states had roughly equal health outcome scores. This suggests there was little, if any, health benefit from California’s severe lockdowns. But California suffered far worse economic and education outcomes. And both states, which already accounted for a large percentage of annual domestic migration—inflows in the case of Florida and outflows for California—saw jumps in these pre-existing patterns. California’s severe lockdowns seemed to elicit a large increase in out-migration, while Florida experienced a significant in-migration increase during the pandemic as compared with pre-pandemic trends.
Prior to the COVID-19 pandemic, the most lethal and widespread respiratory disease pandemic was the 1918 influenza pandemic, popularly but inaccurately labelled the Spanish flu. Some American cities and localities employed lockdown-type measures in 1918, but they were not very stringent and were of short duration (one to 10 weeks, with average of four to five weeks).3
Barro found that lockdown measures in the second and most lethal wave of the 1918 influenza pandemic (September 1918 to February 1919) reduced the ratio of peak to average death rates but had only a small and statistically insignificant effect on overall deaths.4 He speculated that they were not more successful because the average duration of each was only around one month or because lockdowns mainly delay deaths rather than eliminating them.
A well-known 2006 article by D. A. Henderson and his colleagues at the University of Pittsburgh Medical Center concluded that serious mitigation measures such as stay-at-home orders, school closures, and generalized mask wearing were unlikely to make a significant difference in a new pandemic but could adversely affect the provision of medical care and other essential services and have serious negative economic and social consequences.5 Multiple pre-2020 pandemic plans prepared by the World Health Organization; the U.S. Centers for Disease Control and Prevention (CDC); and the health agencies of Canada, the United Kingdom, and Sweden had rejected lockdowns as a legitimate strategy in the event of a new pandemic.6
Yet, when the spread of a new coronavirus from China to the rest of the world became apparent in January and February 2020, public health officials advocated the imposition of severe lockdown measures in an attempt to stem the spread of the virus and reduce the death toll. They were heavily influenced by epidemiological models that predicted that without physical measures to reduce human-to-human contact and interrupt viral transmission, a new virus entering a population with no immunity to it would spread exponentially, overwhelming the hospital system and leading to huge numbers of deaths.
Perhaps the best known and most influential model was from the Imperial College London. In March 2020, it predicted there would be 510,000 deaths in Great Britain and 2.2 million deaths in the United States by July 2020. The Imperial College modelers therefore recommended imposing lockdown measures indefinitely until a vaccine became available—despite recognizing that “[t]he social and economic effects of the measures which are needed to achieve this policy goal will be profound.”7
Those “social and economic effects” proved to be “profound” indeed. One early estimate put the economic costs of business shutdowns in the United States at $7 trillion per year.8 These economic costs disproportionally impacted those who were less educated and less affluent.9 Social costs included feelings of social isolation and estrangement, which led to other mental and physical health issues, especially among the elderly.10
And we are only just now learning of the enormous educational losses and associated economic costs of shutting down schools for extended periods of time.11 It is estimated that learning losses, as documented by math and reading test score declines, will translate into the average student having 5.6 percent lower lifetime earnings and the average state having a 1.9 percent lower GDP each year for the remainder of the 21st century.12 Declines in students’ pass rates on state standardized math and reading assessments were larger in districts with less in-person schooling, and the value of in-person learning was larger for districts with larger populations of Black students.13 CDC data suggest that children who received virtual or combined instruction also experienced decreased physical activity and decreased mental or emotional health compared with children who received in-person instruction.14 Unfortunately, public health policymakers failed to balance these massive social and economic costs against the presumed health benefits of government measures.
Another problem was that neither public health policymakers nor epidemiological modelers took account of voluntary changes in individual behaviors that would occur in reaction to the virus regardless of government policy.15 As Mulligan, Murphy, and Topel wrote in a 2020 article, “The fact that individuals put great value on their own health and longevity means that there are strong individual incentives to engage in self-protection.”16 Peoples’ voluntary actions—such as staying home and avoiding crowds and close contacts—to diminish the risk of contracting COVID-19 would decrease the impact of government-mandated lockdowns. Similarly, peoples’ willingness or unwillingness to comply with lockdown measures would affect lockdown outcomes.17
Ignoring people’s voluntary actions resulted in inaccurate predictions of harm, which in turn led to inefficient outcomes. People’s assessment of their personal risk—because they have more information about their conditions than policymakers do and because they are the best at assessing their life priorities and their risk tolerance—leads to a better cost-benefit tradeoff calculus than mandating restrictions for everyone regardless of their risk. This was particularly the case with COVID-19, which was a serious risk only to the elderly and those with chronic health conditions such as obesity and diabetes.
The Imperial College’s modelers acknowledged that an absence of “spontaneous changes in individual behavior” would be “unlikely” but went ahead and assumed none anyway.18 The resulting outlandish and unrealistic mortality estimates profoundly influenced policymakers to impose stringent measures and, in some cases, extend them for years.19
These government measures were unevenly applied across the 50 states and the District of Columbia. After an initial period of relatively uniform lockdowns at the outset of the COVID-19 pandemic in the spring of 2020, states and localities applied different approaches, with some relaxing and then ending lockdowns and other measures and others extending them through 2020 and 2021. This reflects our constitutional structure, which reserves most public health decisions to state and local governments.20
To evaluate whether the lockdown measures espoused by Imperial College and public health officials had their intended health benefits and to determine at what economic and educational cost, we used a database of pandemic-response policies that a team at Oxford University’s Blavatnik School of Government is maintaining (the Oxford Covid-19 Government Response Tracker) and using to derive indices of government measures undertaken to combat the pandemic. The most comprehensive of the indices is the Oxford Government Response Index consisting of 16 variables, including eight containment and closure policies (such as workplace closings, restrictions on public events, and stay-at-home requirements); two economic policies (income supports and debt/contract relief such as eviction moratoriums); and six health system policies (including but not limited to testing and masking policies and vaccination delivery policies).21
We compared the states’ Oxford Government Response Index scores with economic (as measured by states’ increase in unemployment and decrease in GDP), health (as measured by COVID-associated deaths and all-cause excess mortality), and educational outcomes (as measured by in-person instruction percentage) across the 50 states and the District of Columbia as calculated in a previous study published in early 2022.22 Most government measures had been relaxed by that point.
Since COVID infection mortality is strongly related to advancing age and to peoples’ underlying medical conditions, the earlier study adjusted observed COVID deaths to account for different age distributions and the prevalence of obesity and diabetes—the conditions most strongly associated with COVID mortality—in different states. Because the pandemic particularly affected some industries (such as entertainment, hotels and food, mining, and energy production), the unemployment and GDP changes were adjusted for states’ preexisting industry composition in relation to the national average. Finally, the earlier study calculated a single combined score that equally weighted the z-scores23 of the three measures (health, economic, and education) and transformed it to a zero-to-100 scale.24
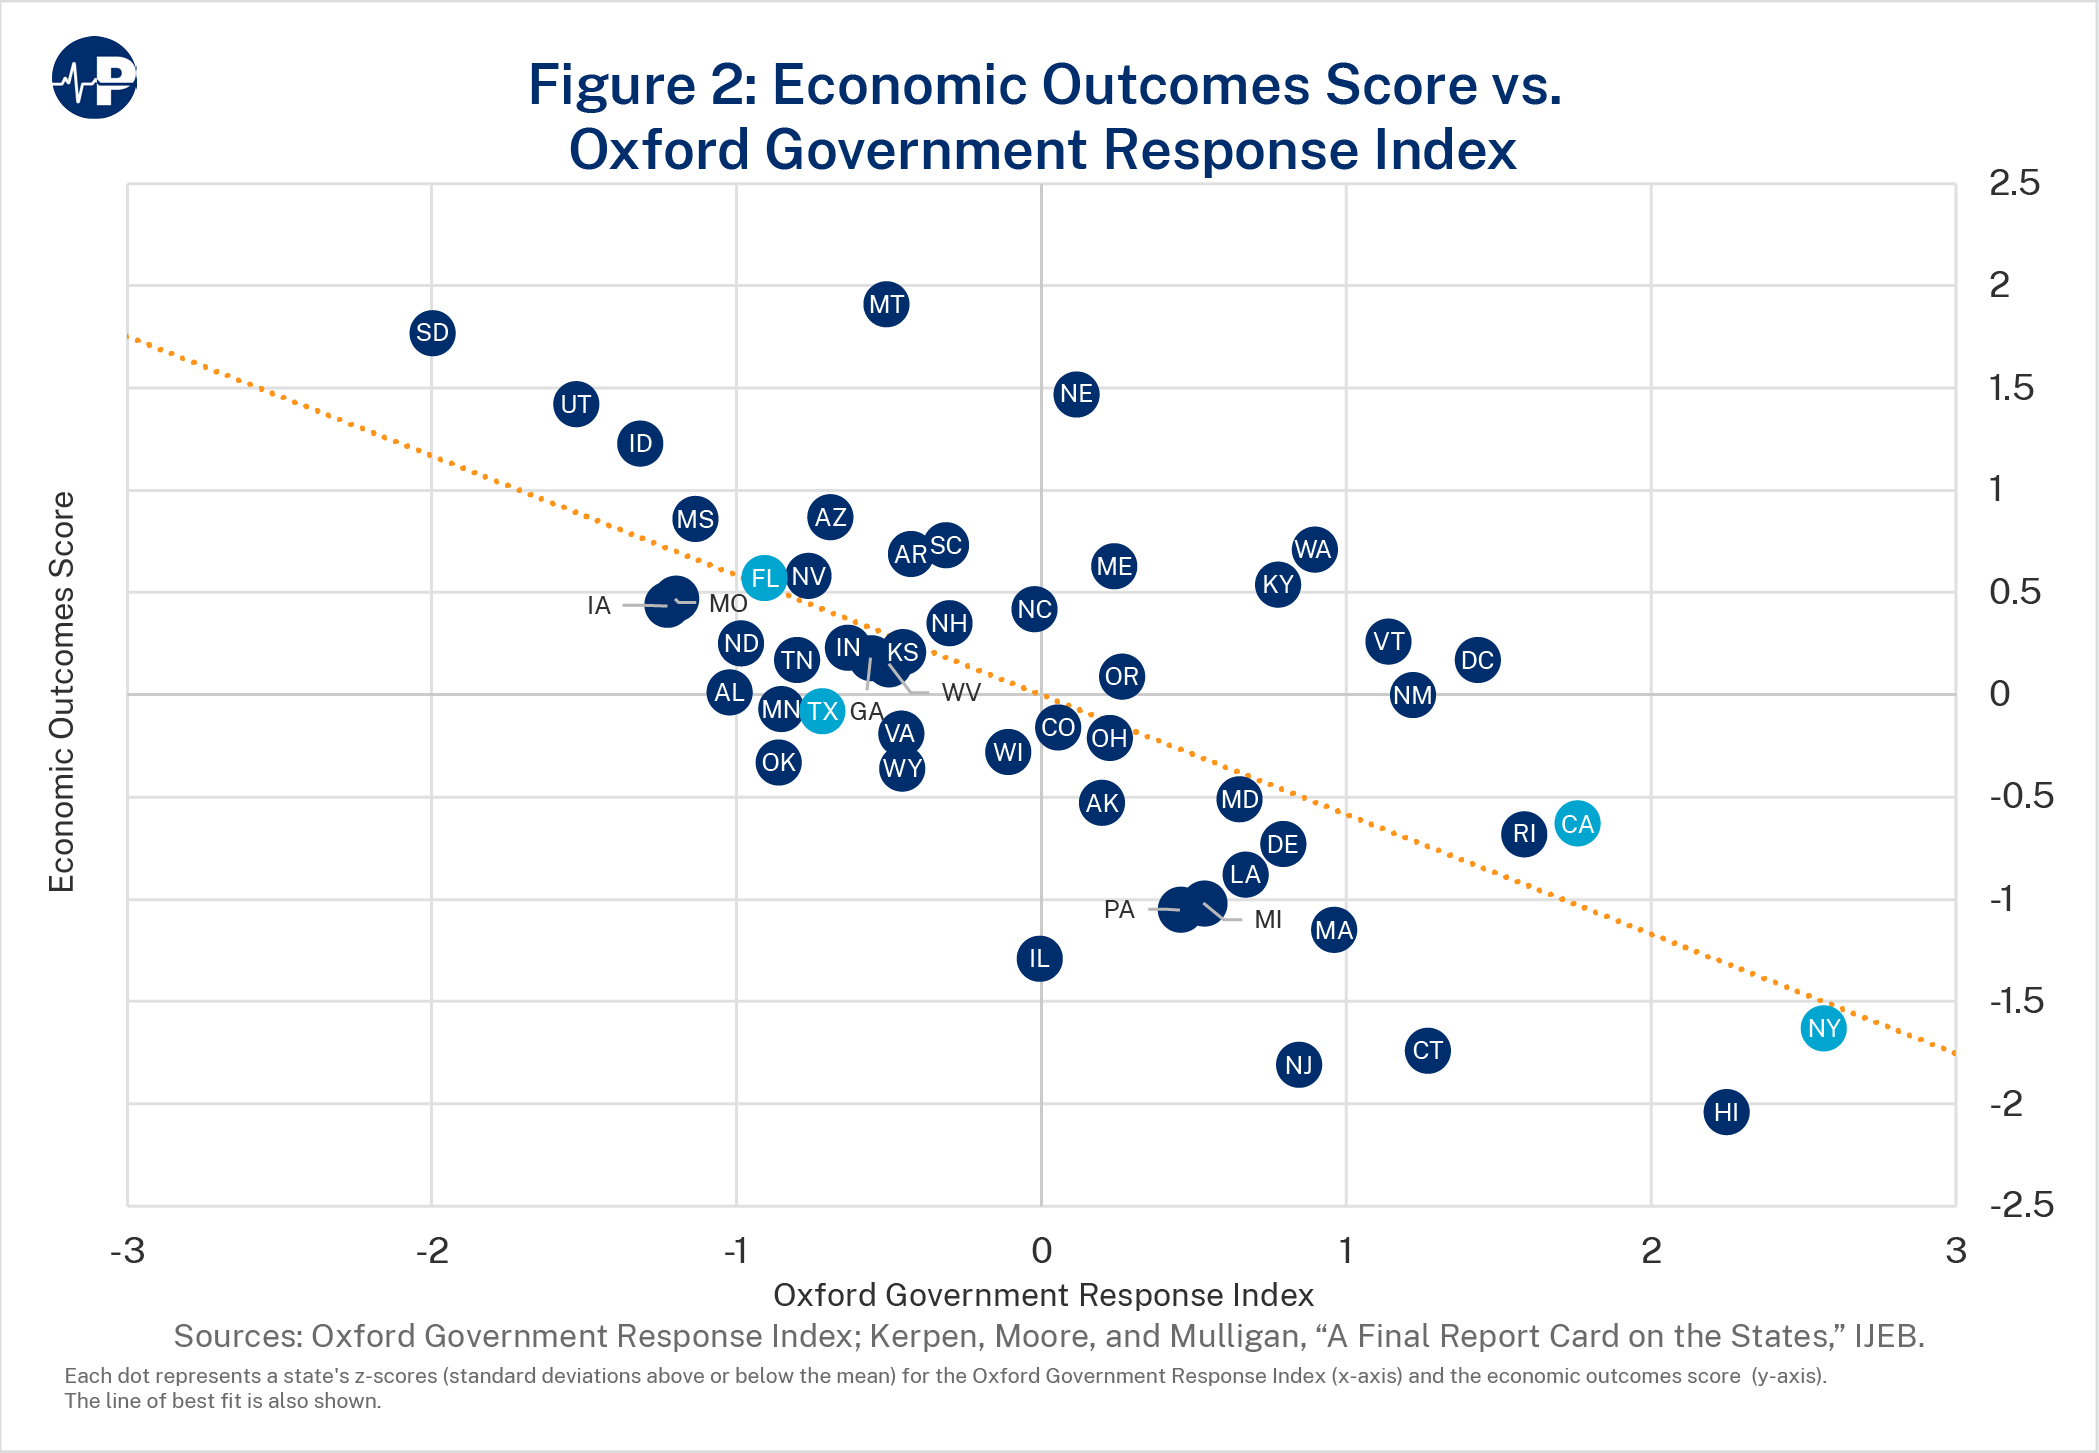
This is consistent with the earlier study’s findings that states with locked-down economies did not have significantly better health outcomes.27 In that study, the economy score functioned as a surrogate for the severity of lockdown measures. As Figure 2 shows, the economic outcomes score is strongly negatively correlated (β=-0.58; p<0.001) with the Oxford Government Response Index (states with more stringent lockdowns had worse economic outcomes), confirming that it was a good surrogate for lockdown measures.
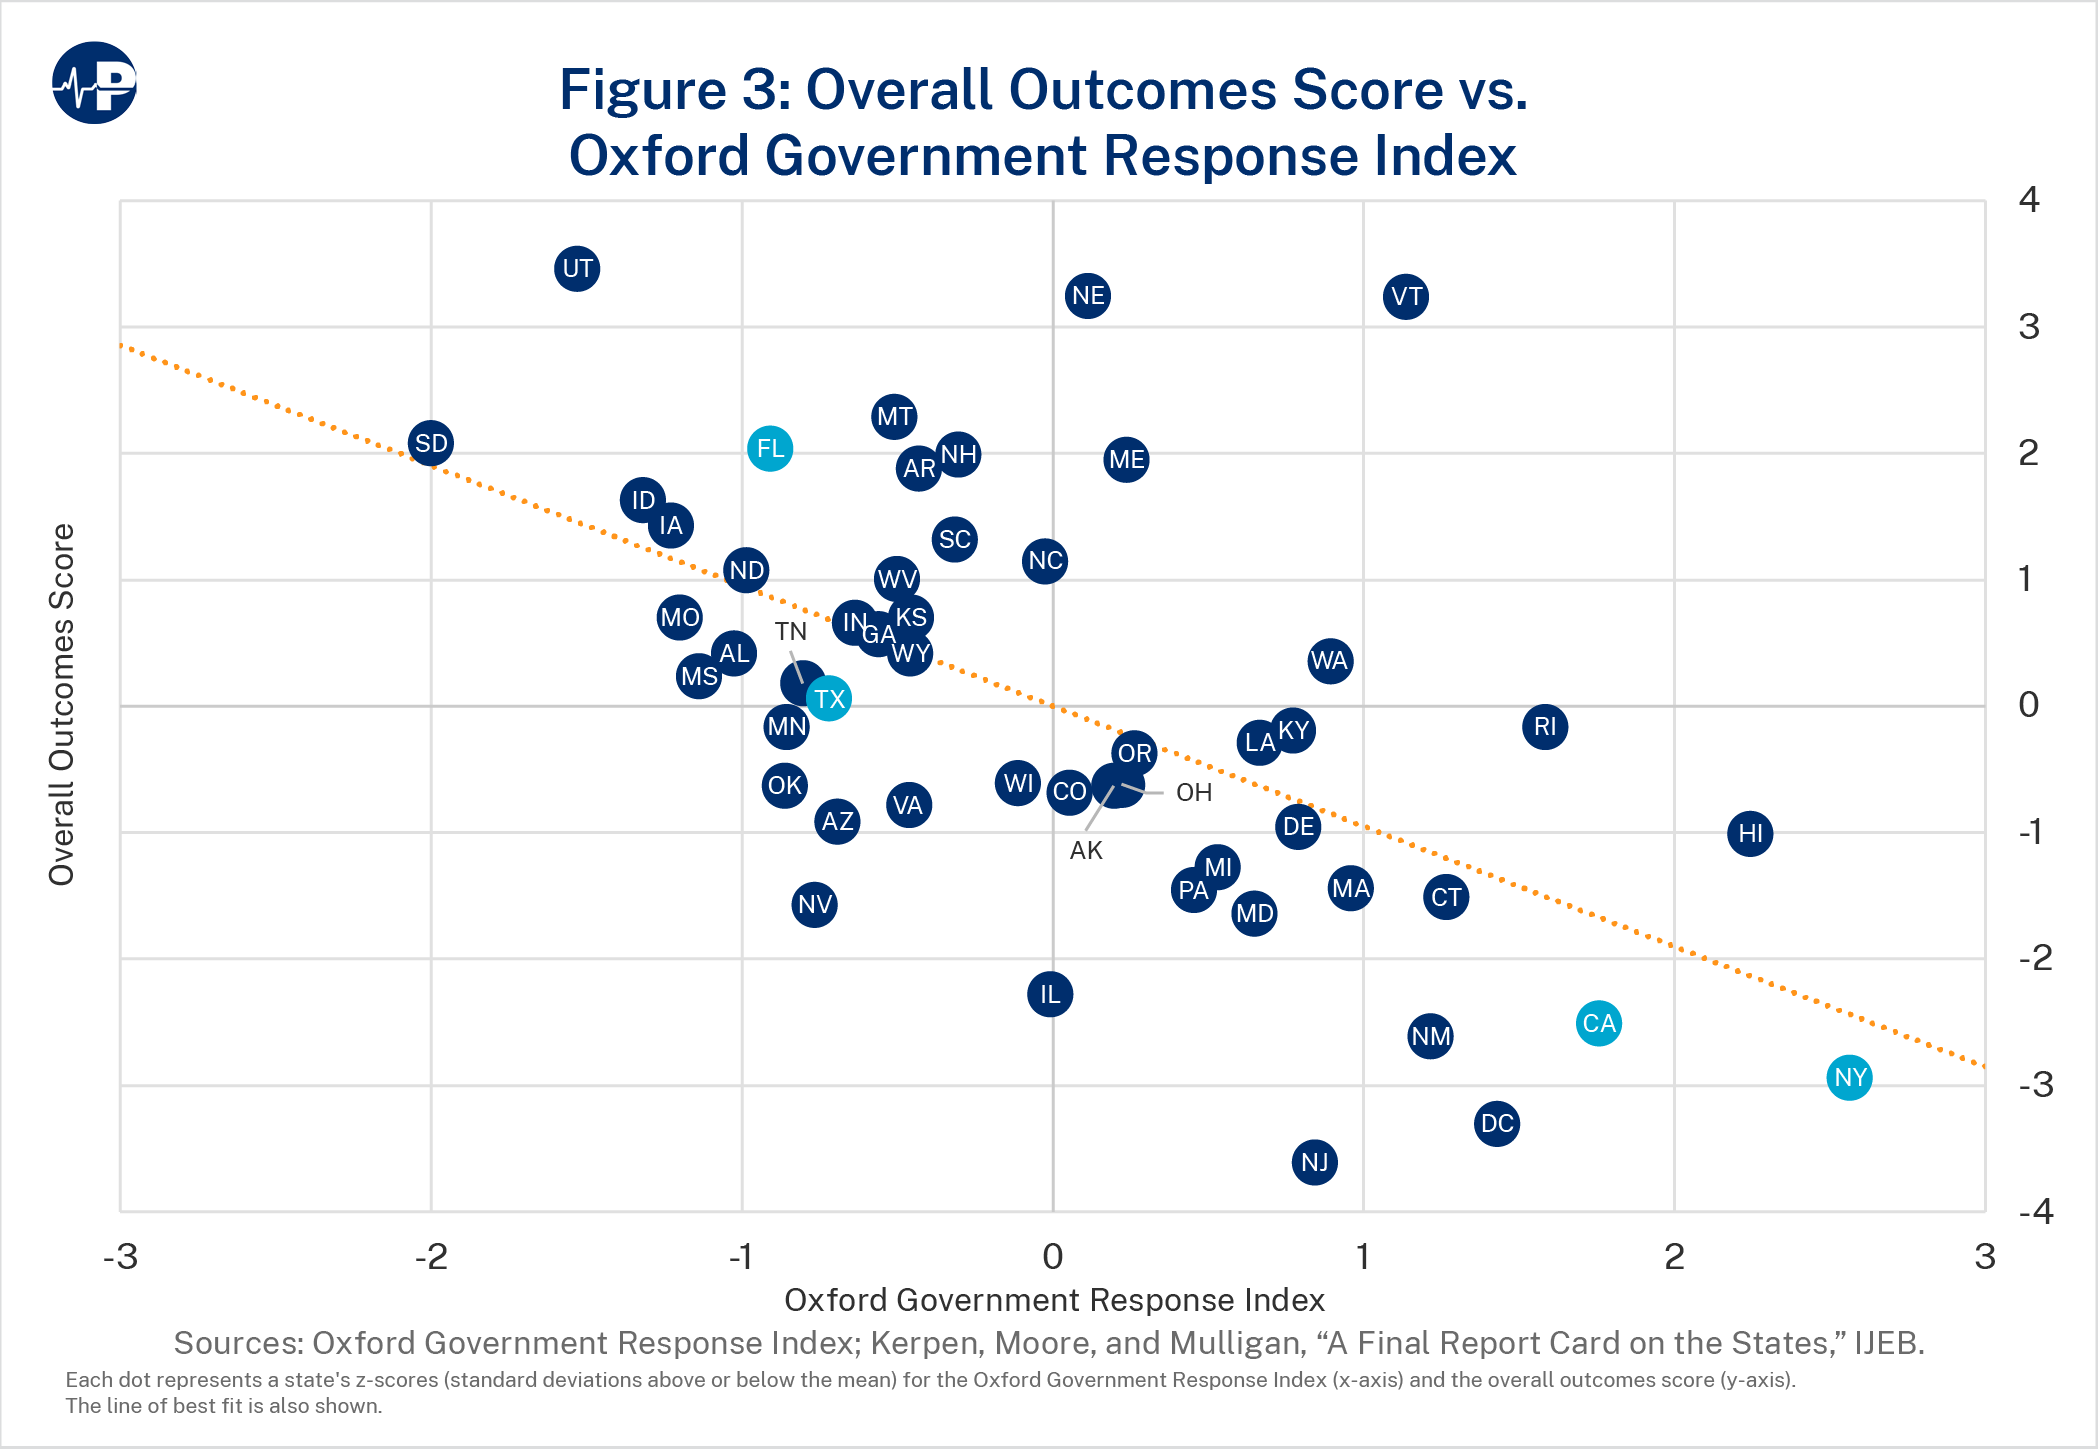
Finally, Figure 3 shows a strong negative correlation between the Oxford Government Response Index and an overall outcomes score (β=-0.95; p<0.001), meaning that states with more stringent lockdowns had worse total outcomes. The overall outcomes score was calculated by equally weighting the z-scores of the economic outcomes, the health outcomes, and the education outcomes results that had been previously calculated.28
Table 1 shows the regression coefficients between the Oxford Government Response Index with our variables in the first column and illustrates two robustness checks we performed in the second and third columns. The coefficients in the first column are unweighted by state population. The second column provides the coefficients, with weighting by state population. The final column weights by state population and factors in state population density. Accounting for states’ populations and population densities had little impact on the size, sign, and significance of the coefficients. The results are consistent across these specifications:
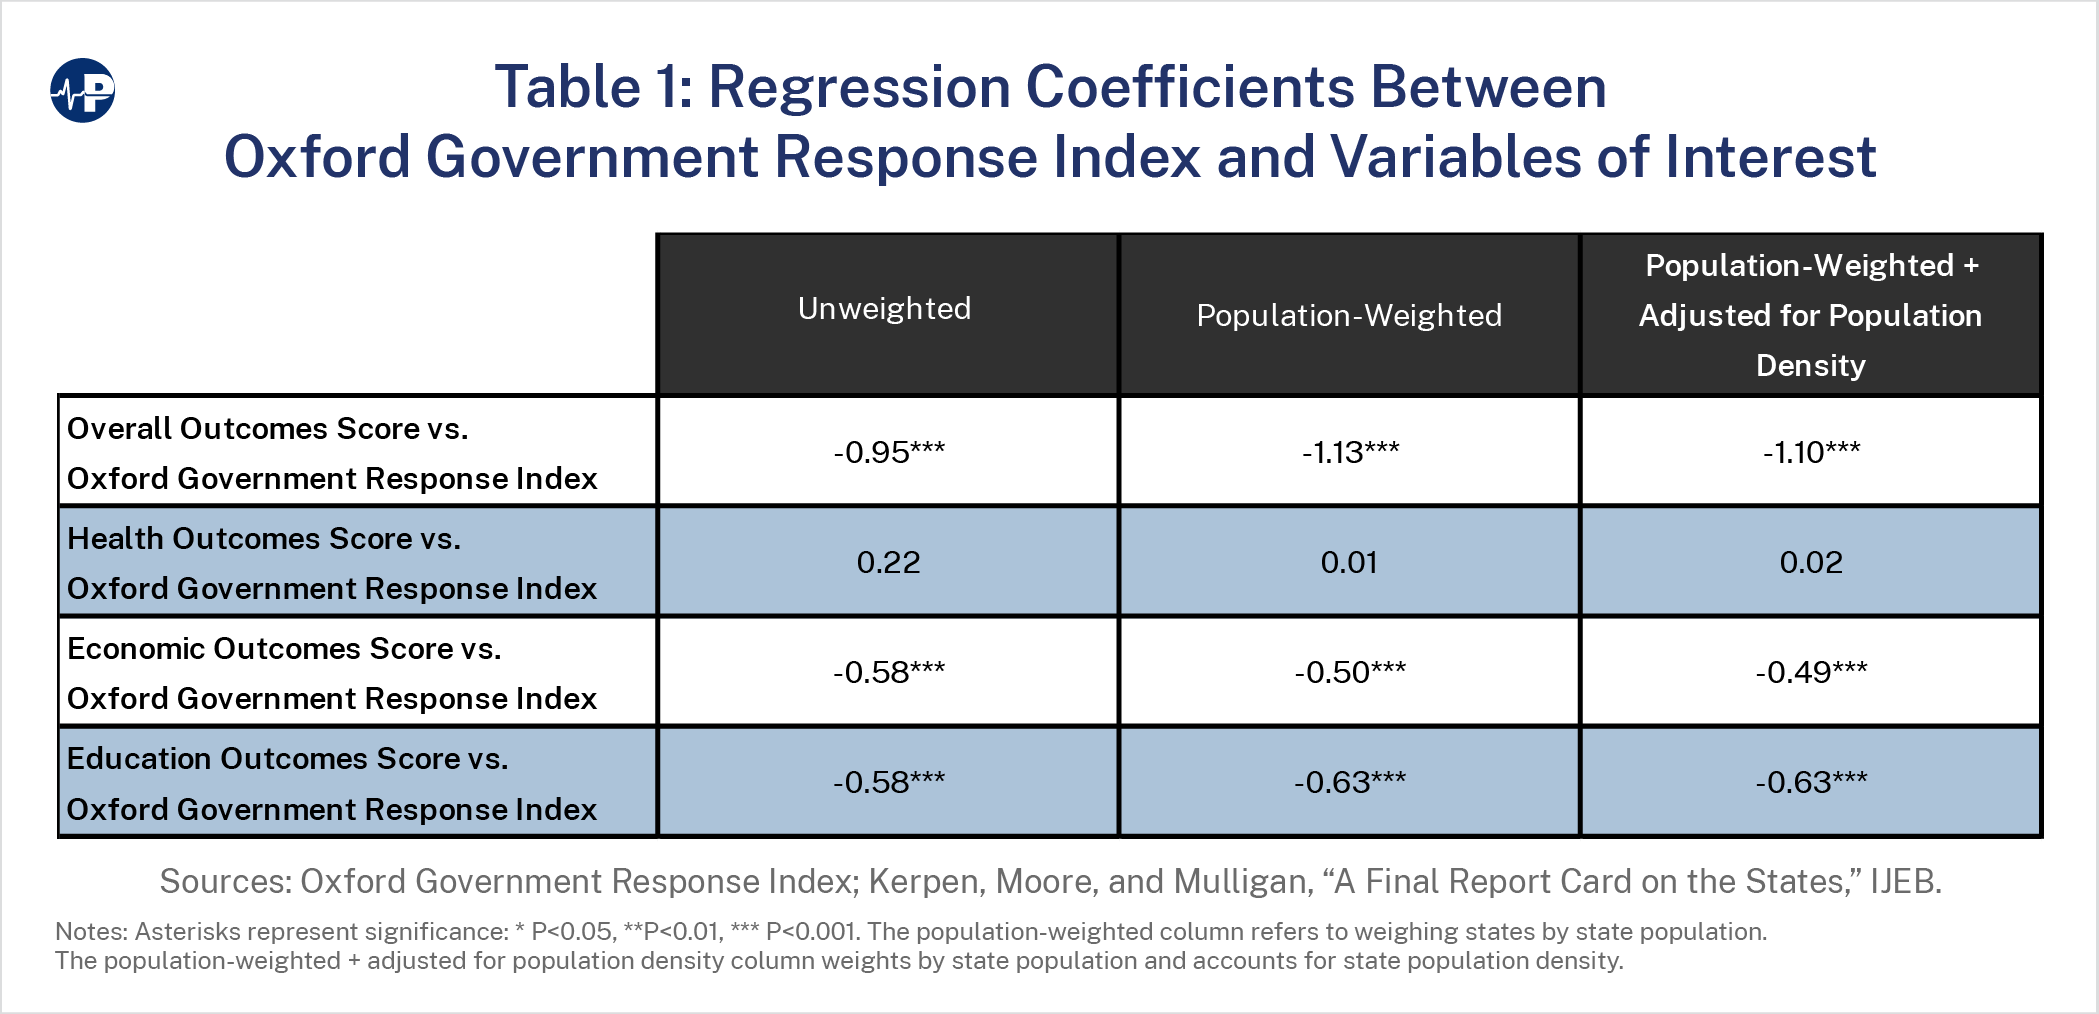
States with more severe government measures did not experience health benefits but had much worse economic outcomes, education scores, and overall pandemic government response scores. Notably, the small but statistically insignificant relationship (at the 5 percent level) between the Oxford Government Response Index and the unweighted health outcomes score (column 1) remained insignificant and became essentially zero when weighted by state populations (column 2) or weighted by state population and state population density (column 3).
Some have posited that population density is significantly associated with increased risk of COVID-19 disease, hospitalization, and death, as it is more difficult to socially distance in dense areas, and that mitigation measures will have more impact in dense areas.29 Others have disputed the importance of population density, finding no significant relationship between counties’ density and COVID infection or death.30 When we recalculated the results adjusting for population density, we found no change in the results (see Table 1).
In 1956, economist Charles Tiebout’s classic paper, “A Pure Theory of Local Expenditures,” posited that people choose where to live by selecting communities that have the attributes they prefer, including the levels and types of services provided and rates of taxation by the local government.31 In other words, people vote with their feet, sorting themselves into preference-homogenous jurisdictions. Assuming people are relatively free to move, this creates an efficient provision of local public goods in accordance with the preferences of residents that maximizes their personal utility.
People could also vote with their feet in response to their preferences for the severity of pandemic lockdown measures. Once travel restrictions imposed during the early months of the pandemic were relaxed, people could more easily relocate to jurisdictions whose lockdown policies matched their preferences. While there are high costs to moving, such as loss of community and a potential need to change jobs (a difficulty that was alleviated somewhat by expanded telework flexibilities), lockdown policies caused people to move on the margin. This could have been particularly relevant for families with school-age children given the variation in in-person school openings and closures across states in the 2020–21 and the 2021–22 school years.
To study this possibility, we obtained domestic migration data by state from the U.S. Census Bureau’s Population Estimates Program (PEP). We examined the domestic migration variable in PEP, which each year—counting inflows (positive) in some states and outflows (negative) in other states—sums to zero across all states. Net domestic migration for a given geographic area is the difference between the number of people moving in and the number of people moving out during that year, and it excludes international immigration. PEP’s measured year runs from July 1 of the preceding calendar year to June 30 of the reported calendar year. Thus, 2019 refers to July 1, 2018, to June 30, 2019.
We compared migration during the pandemic (July 1, 2020, to June 30, 2022) with five prepandemic years (2015-2019 or July 1, 2014, to June 30, 2019) as a measure of pre-pandemic interstate domestic migration trends. We excluded PEP year 2020 (July 1, 2019, to June 30, 2020) from the analysis because the first half of the year was a normal, pre-pandemic period, and the second half of the year was the opening months of the pandemic. In addition, severe travel restrictions in the opening months of the pandemic (spring of 2020) disrupted normal movement between states, markedly reducing domestic migration. Total annual migrations across states in the pre-pandemic years averaged 786,042 and ranged from 752,586 (in 2018) to 852,688 (in 2016). Migration jumped in the pandemic years of 2021 and 2022 to 1,063,730 and 1,195,235, respectively. This suggests that the pandemic spurred state-to-state movement.
Some of the increase in 2021 could reflect a catch-up of migration that was restricted during the previous year. Migration in 2020 was only 223,016. Because the mid-spring through summer is the most popular time to move (80 percent of moves occur between April and September32), the severe travel restrictions in the first half of calendar year 2020 (corresponding to the second half of the 2020 year for the Census PEP) likely delayed a significant number of moves. But this would not explain the substantial increase in pandemic migration in 2022, which was even larger than the 2021 increase.
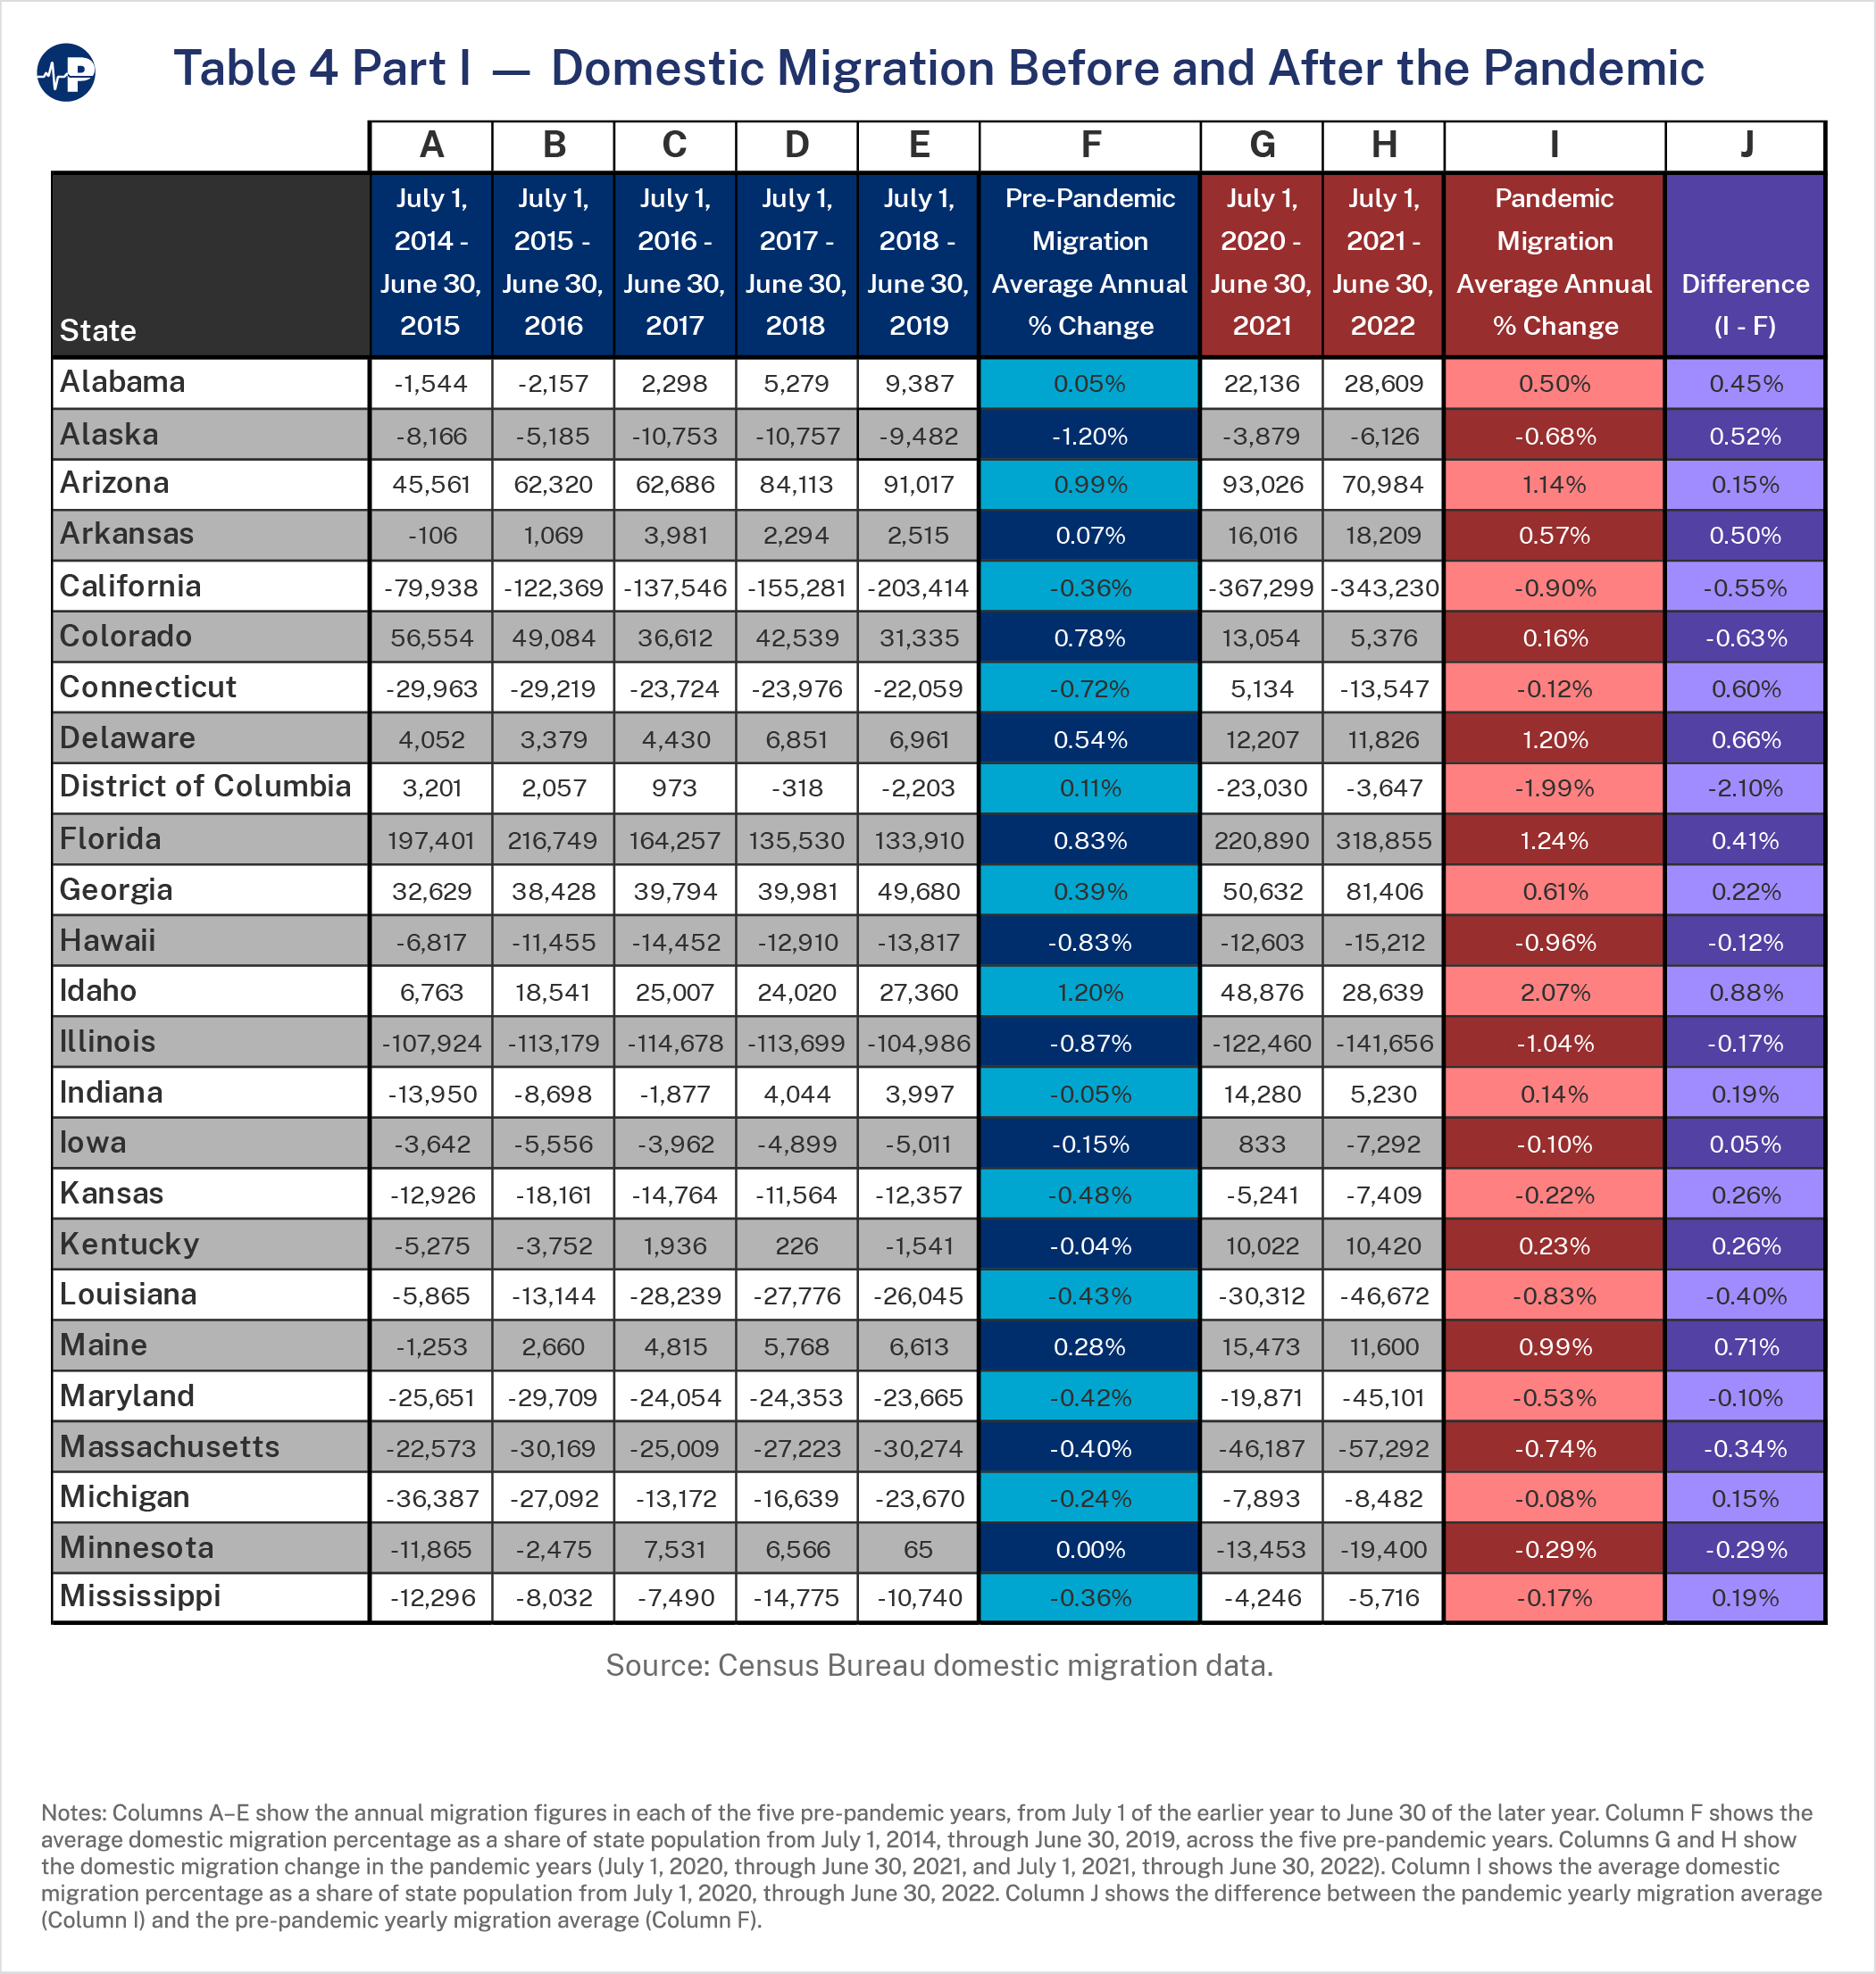
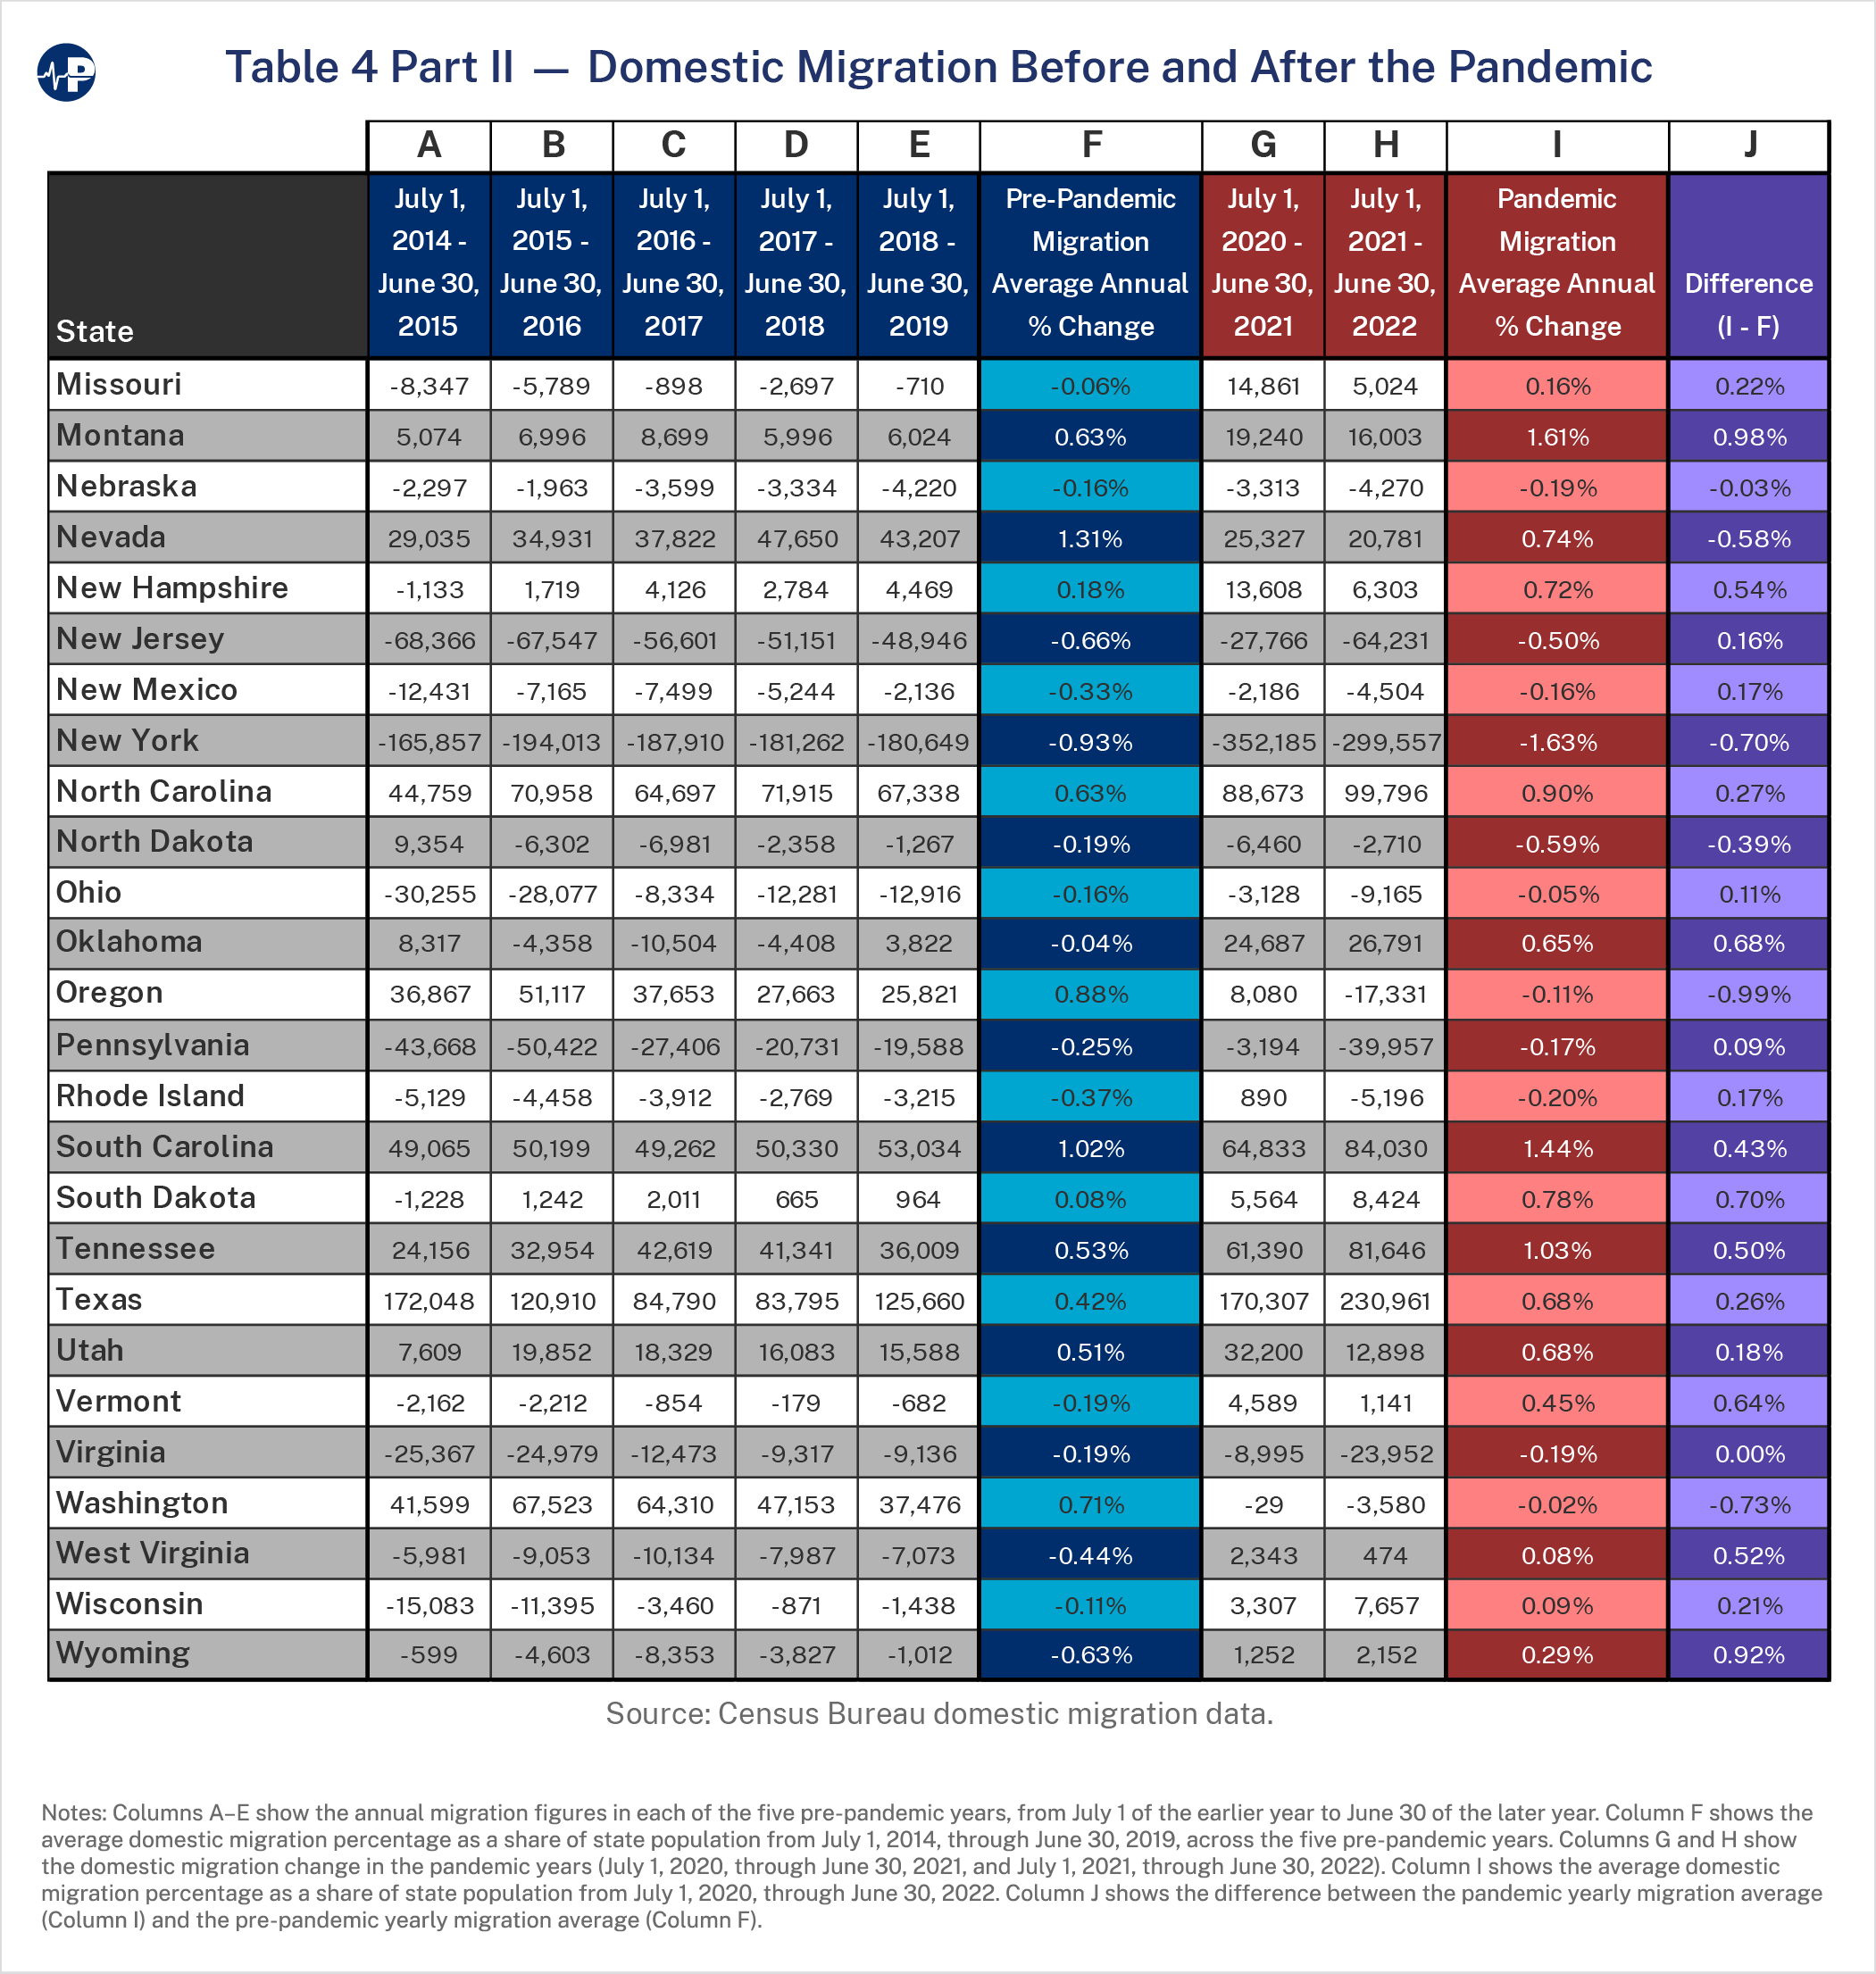
The pandemic migration change (the difference between migration in the pandemic period and that of the pre-pandemic period) was calculated by taking the average annual change in migration in the pandemic years (2021 and 2022) as a percentage of the state population and subtracting the average annual migration in the pre-pandemic years (2015–19) as a percentage of that state’s population. If states had a net inflow, the percentage is positive. If states had a net outflow, the percentage is negative. For example, a 1 percent value means that the state’s increased domestic in-migration in the pandemic period as compared with the pre-pandemic period was 1 percent of the state’s population. See Table 4 in the Appendix for the domestic migration patterns.
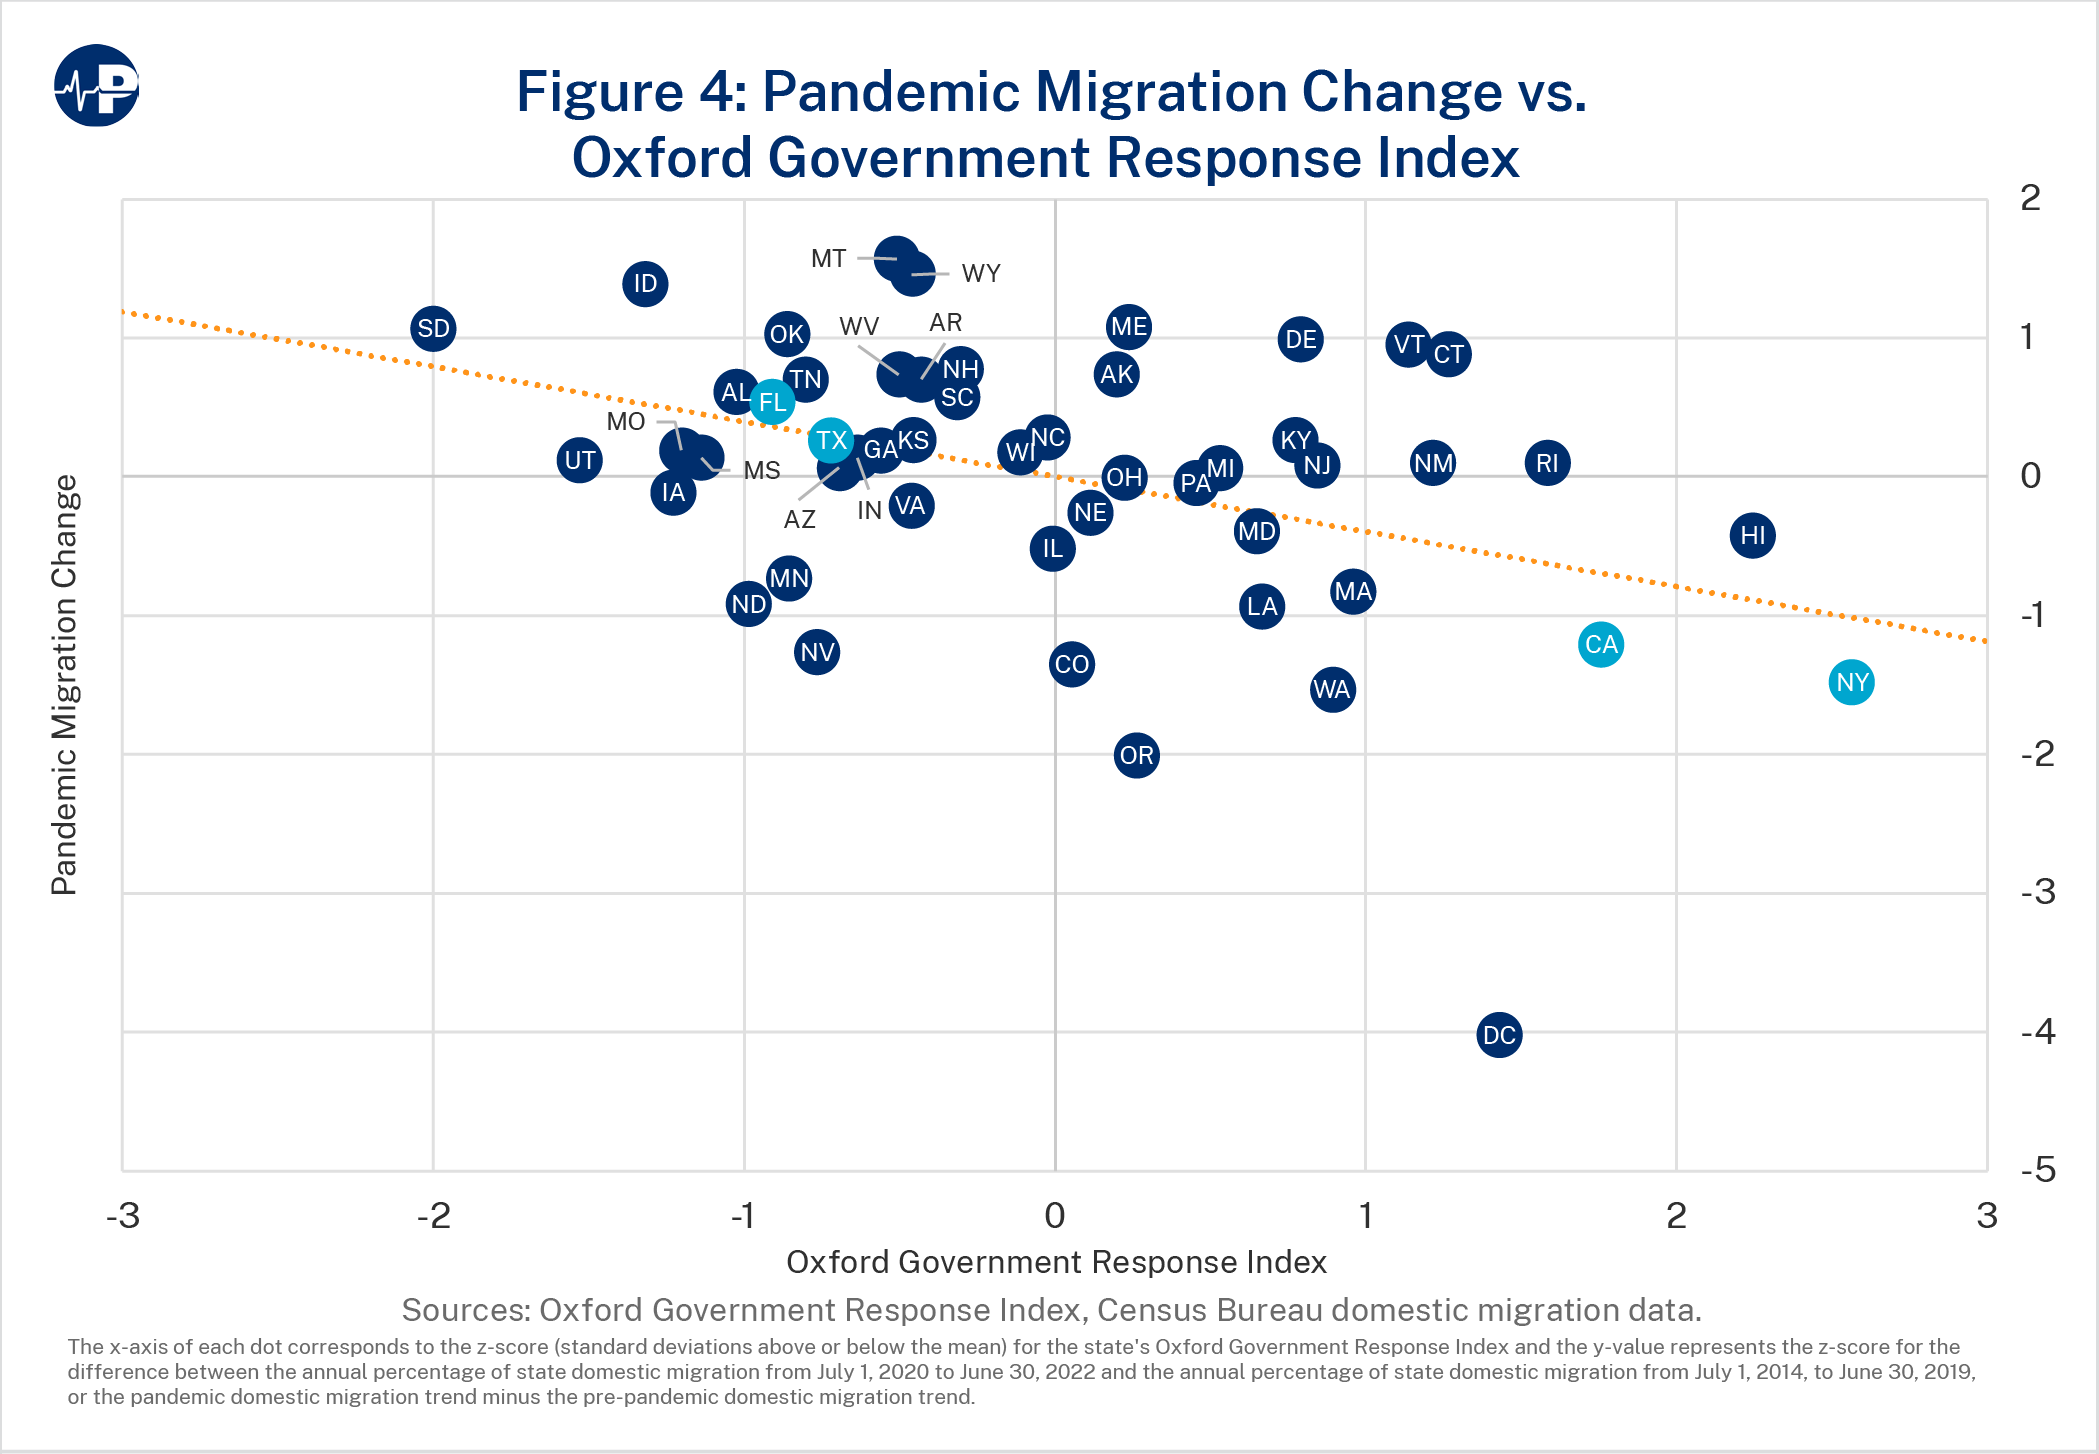
The pandemic migration change was then regressed against the overall government response measure from the Oxford Government Response Index. As illustrated in Figure 4, there was a significant negative correlation between states’ government response measures and states’ net migration change (β=-0.40; p=0.004). The takeaway: the more severe the lockdowns, the greater a state’s migration outflow.
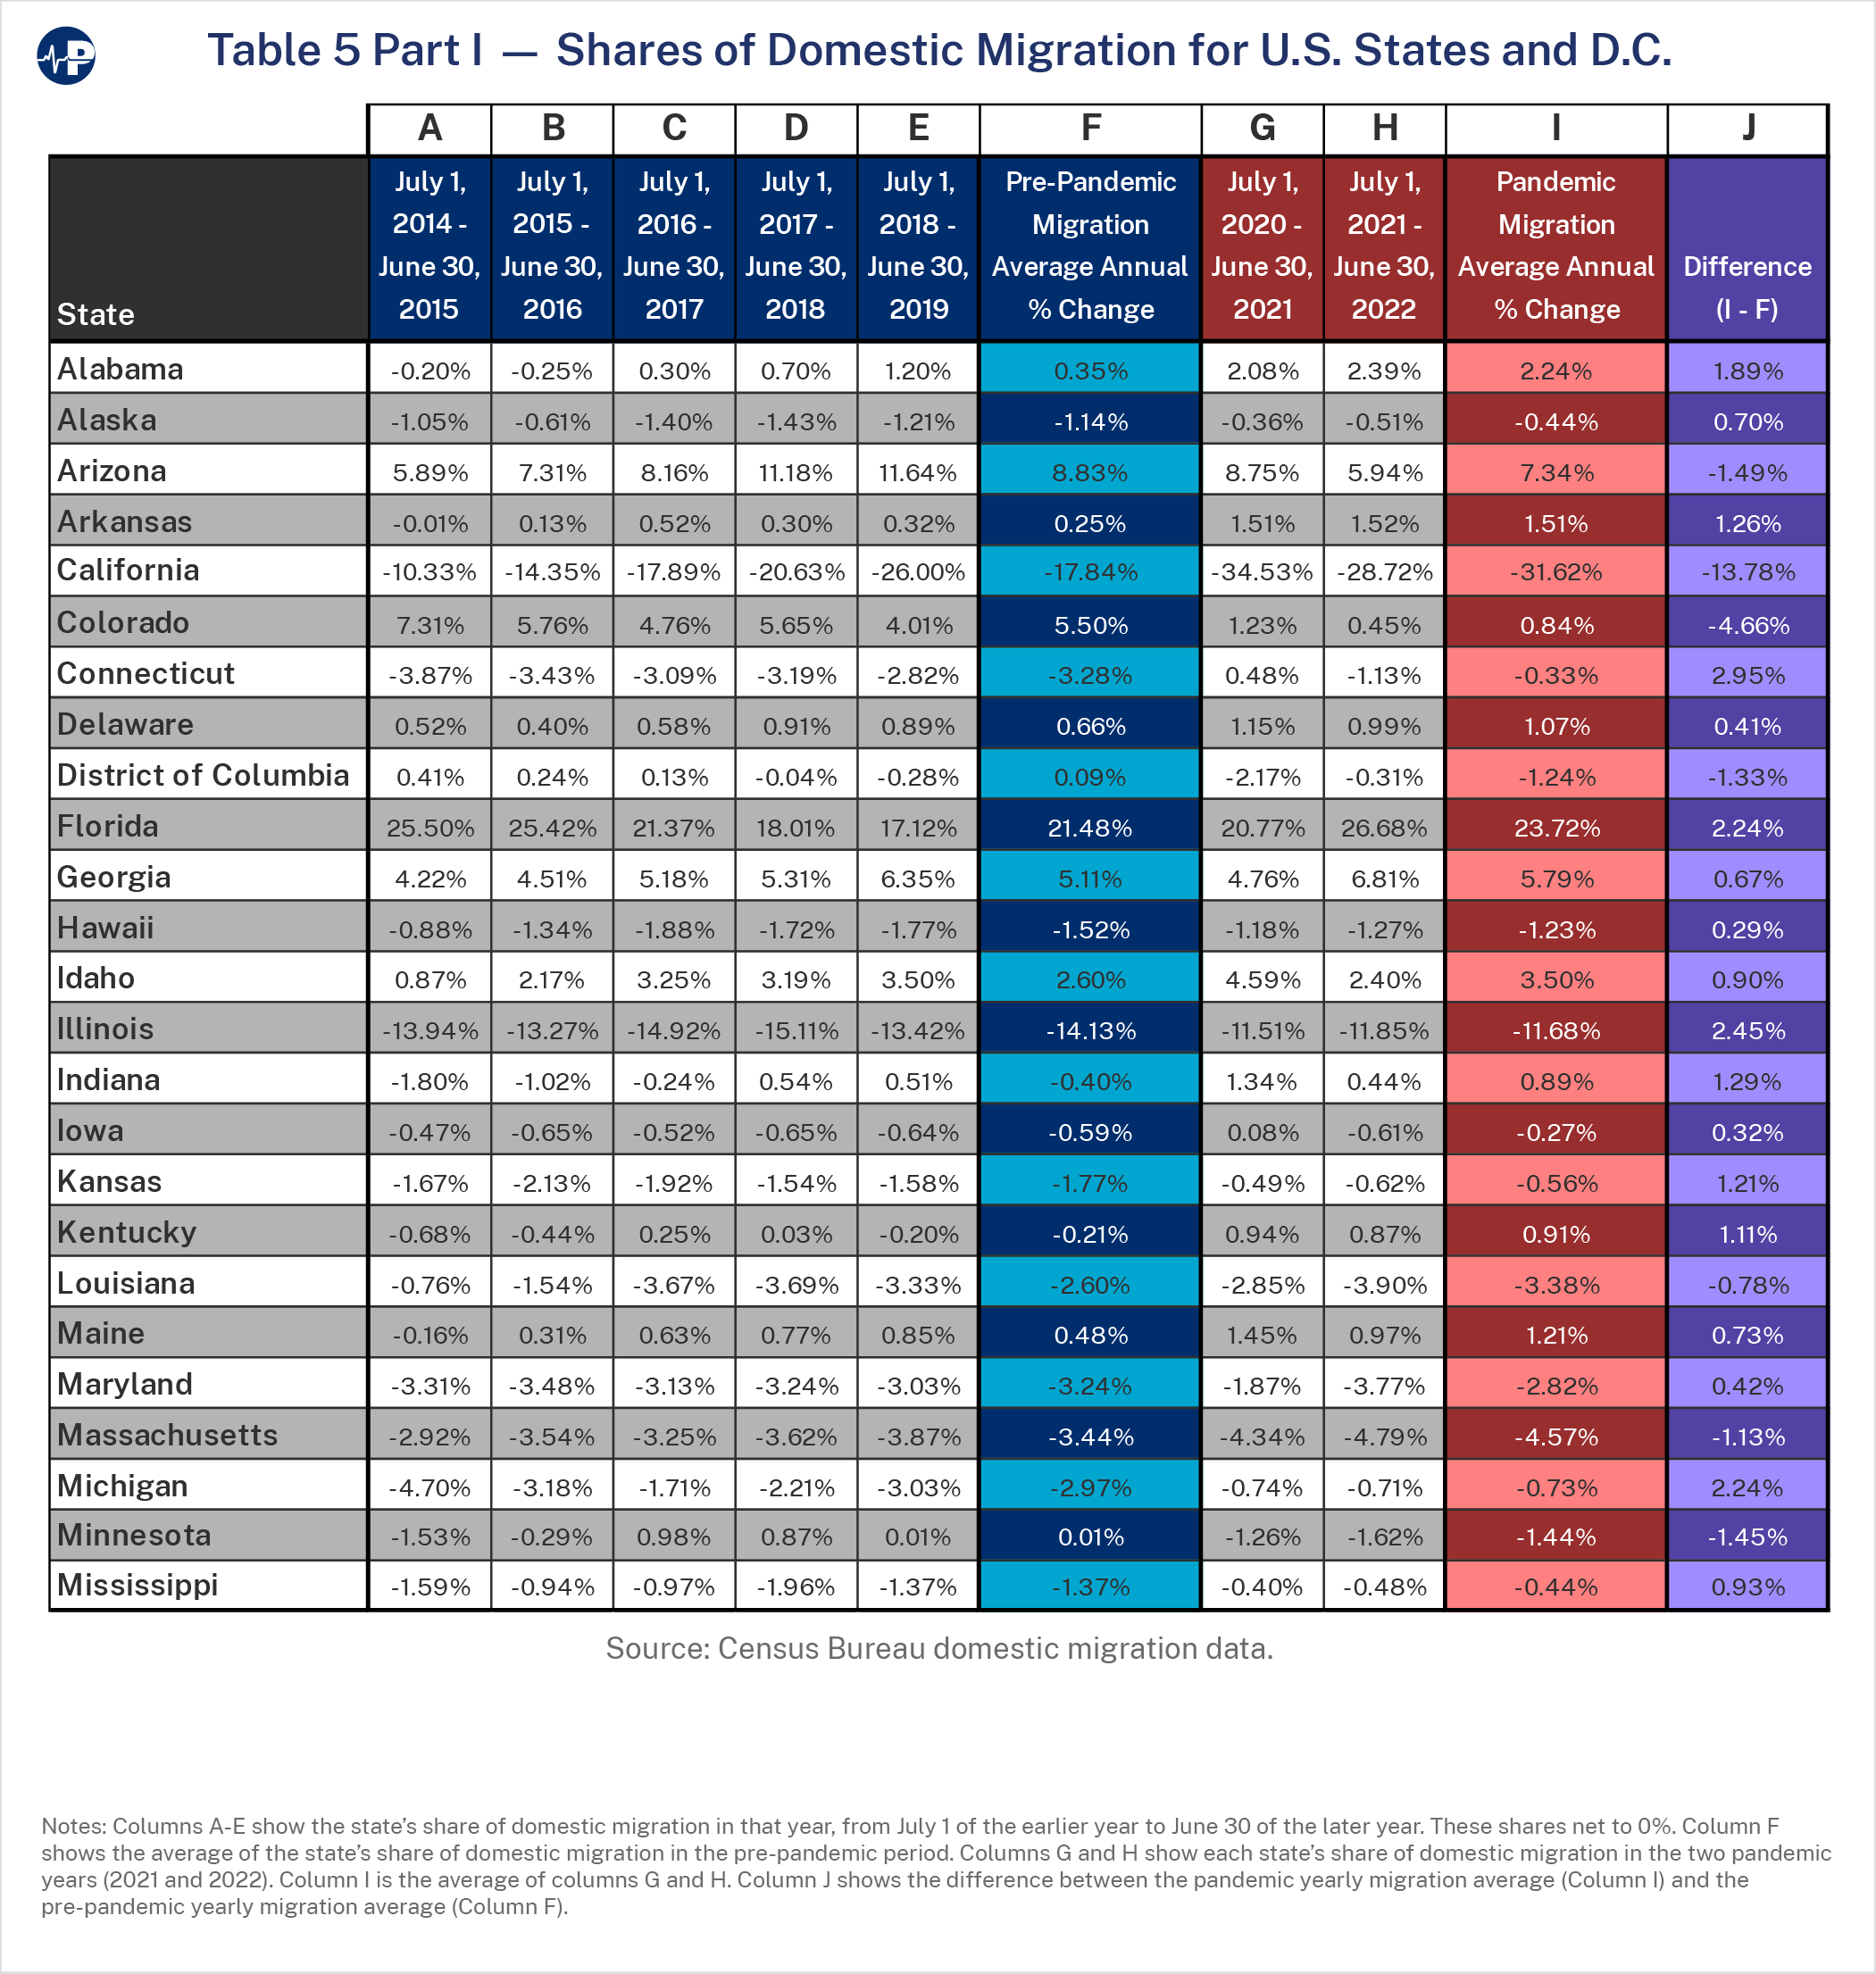
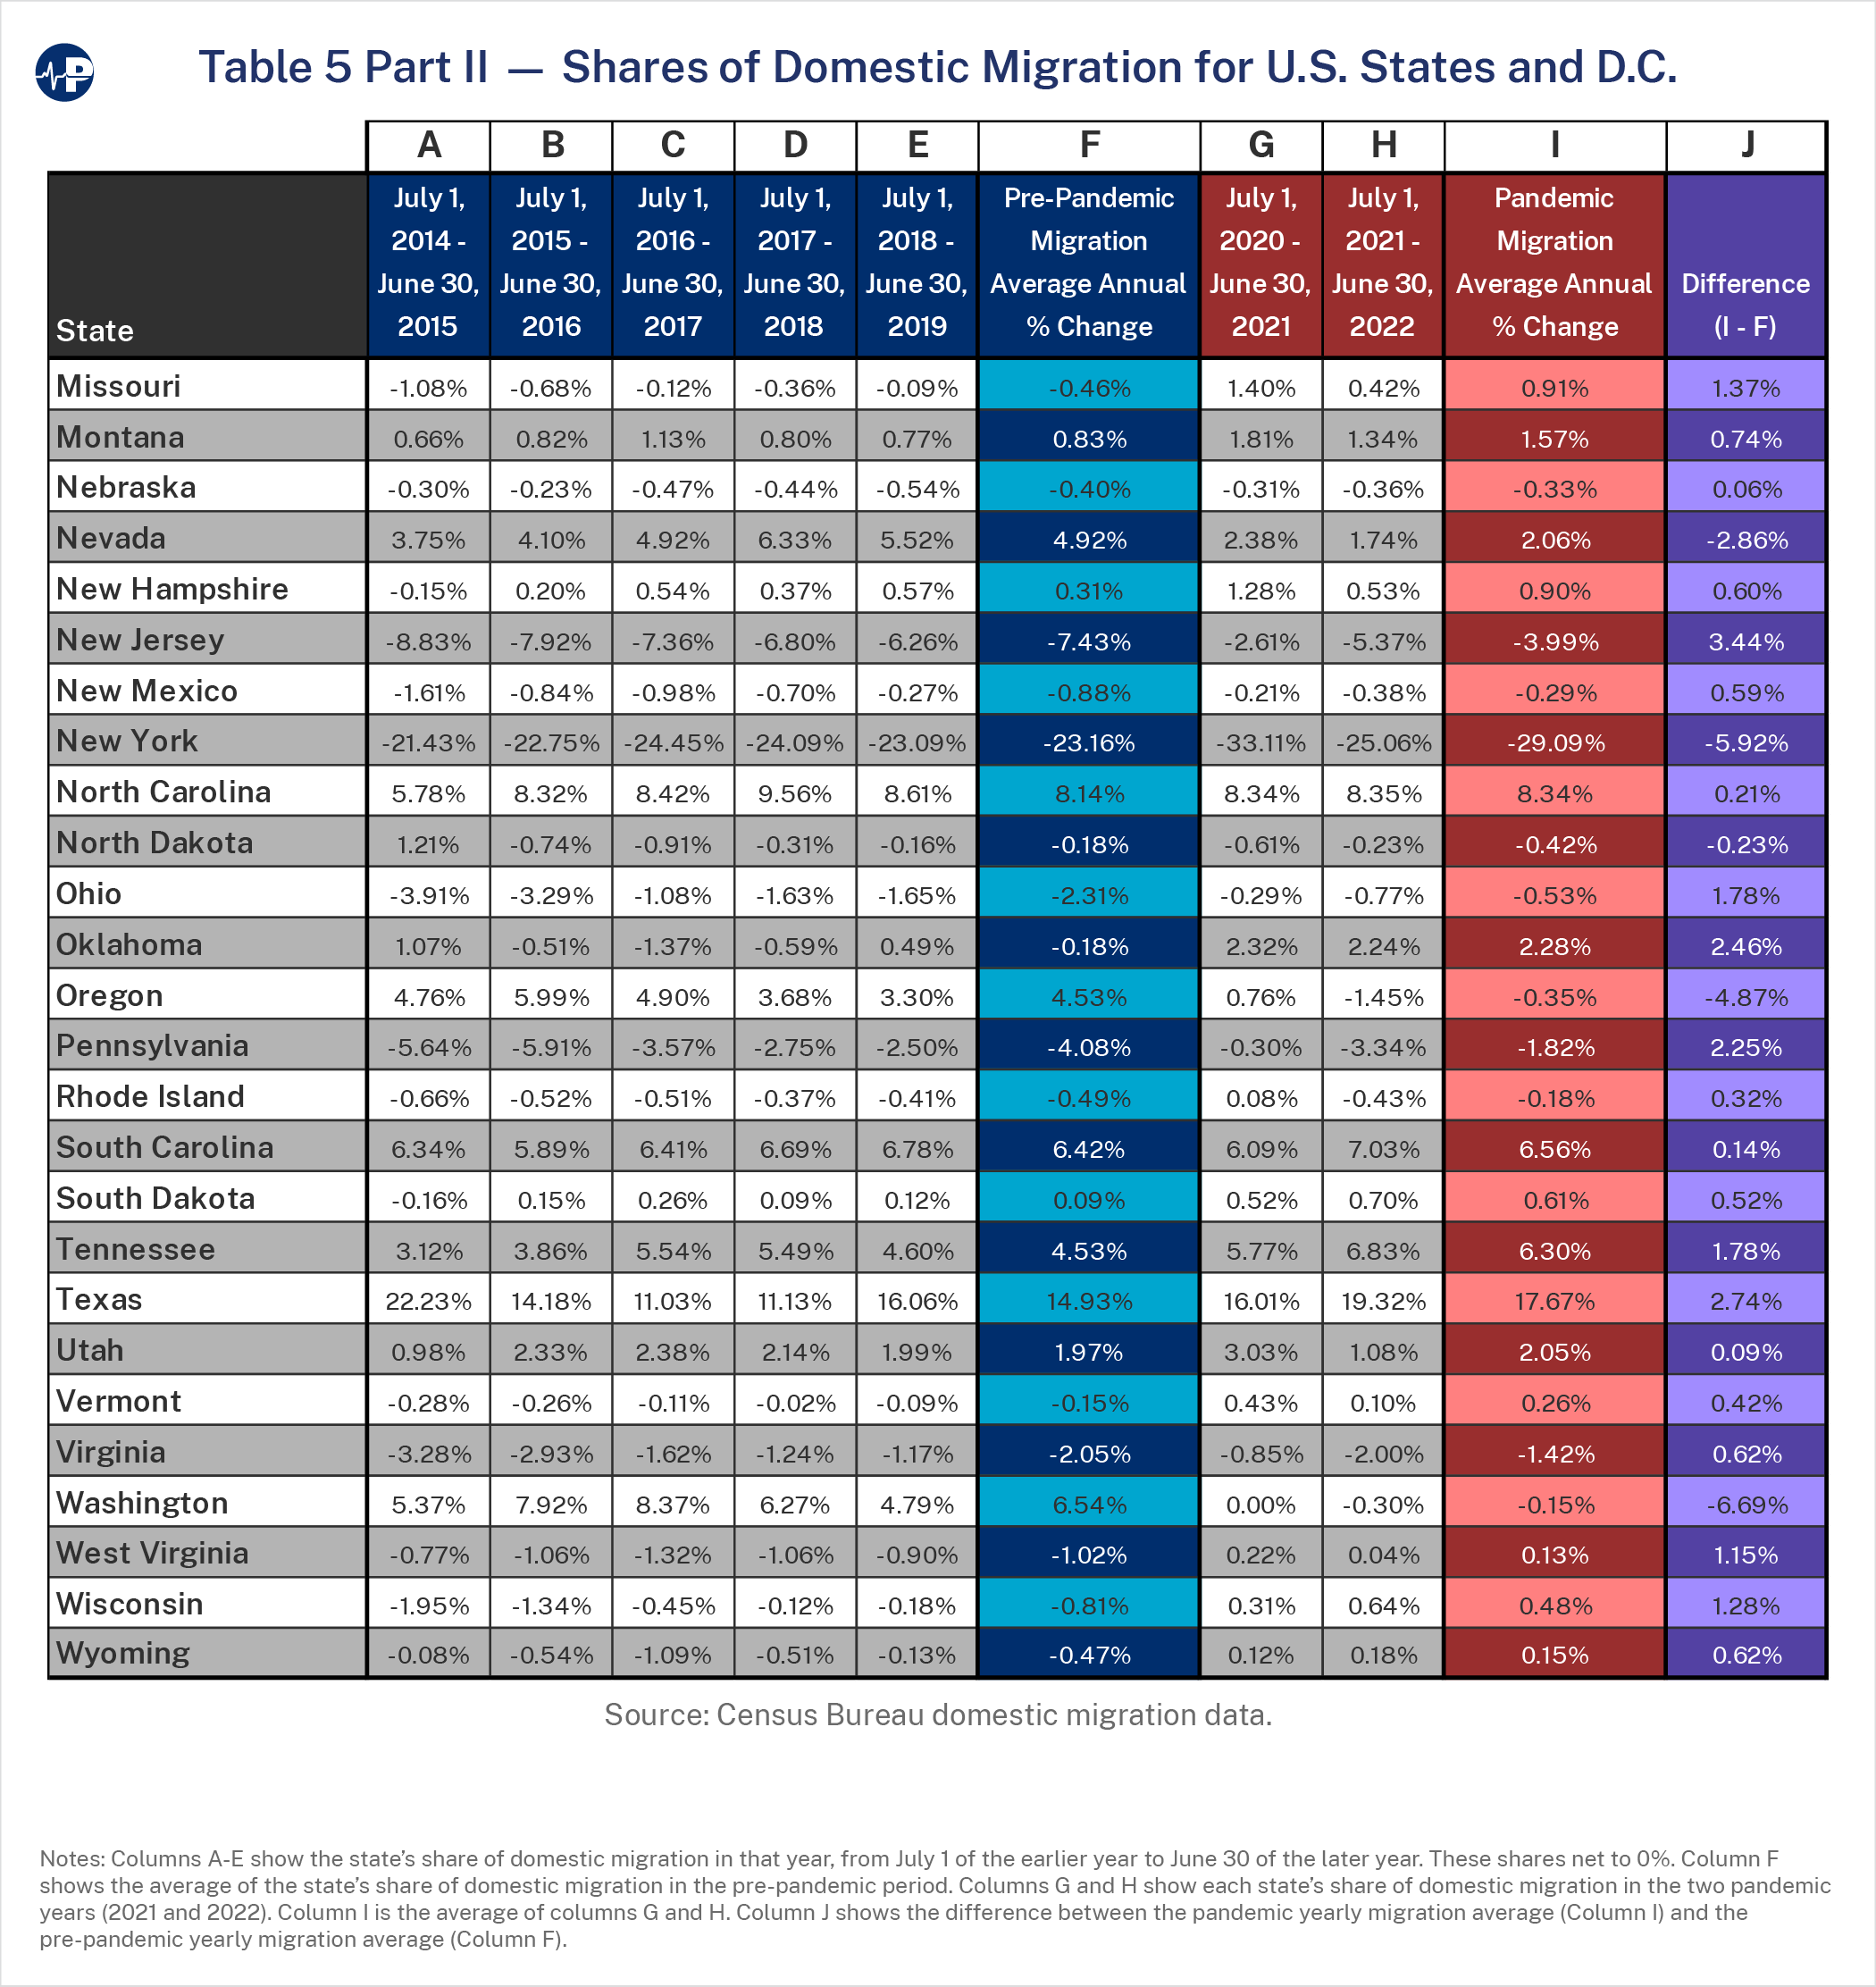
To demonstrate the robustness of these findings, we calculated the annual migration patterns a second way as each state’s share of total migration that year. This was determined by dividing each state’s net domestic migration that year (the difference between inflows and outflows, resulting in a positive or negative number), by the total domestic migration in the same year. Every domestic migrant in a given year was an outflow from one state and an inflow to another. Therefore, total outflows equal total inflows, either of which is equivalent to total nationwide domestic migration that year. Adding every state’s net domestic migration together sums to zero across all the states. Changes in a given state’s net migration as a share (percentage) of total migration from year to year likely indicate changes in public sentiment toward that state relative to other states.
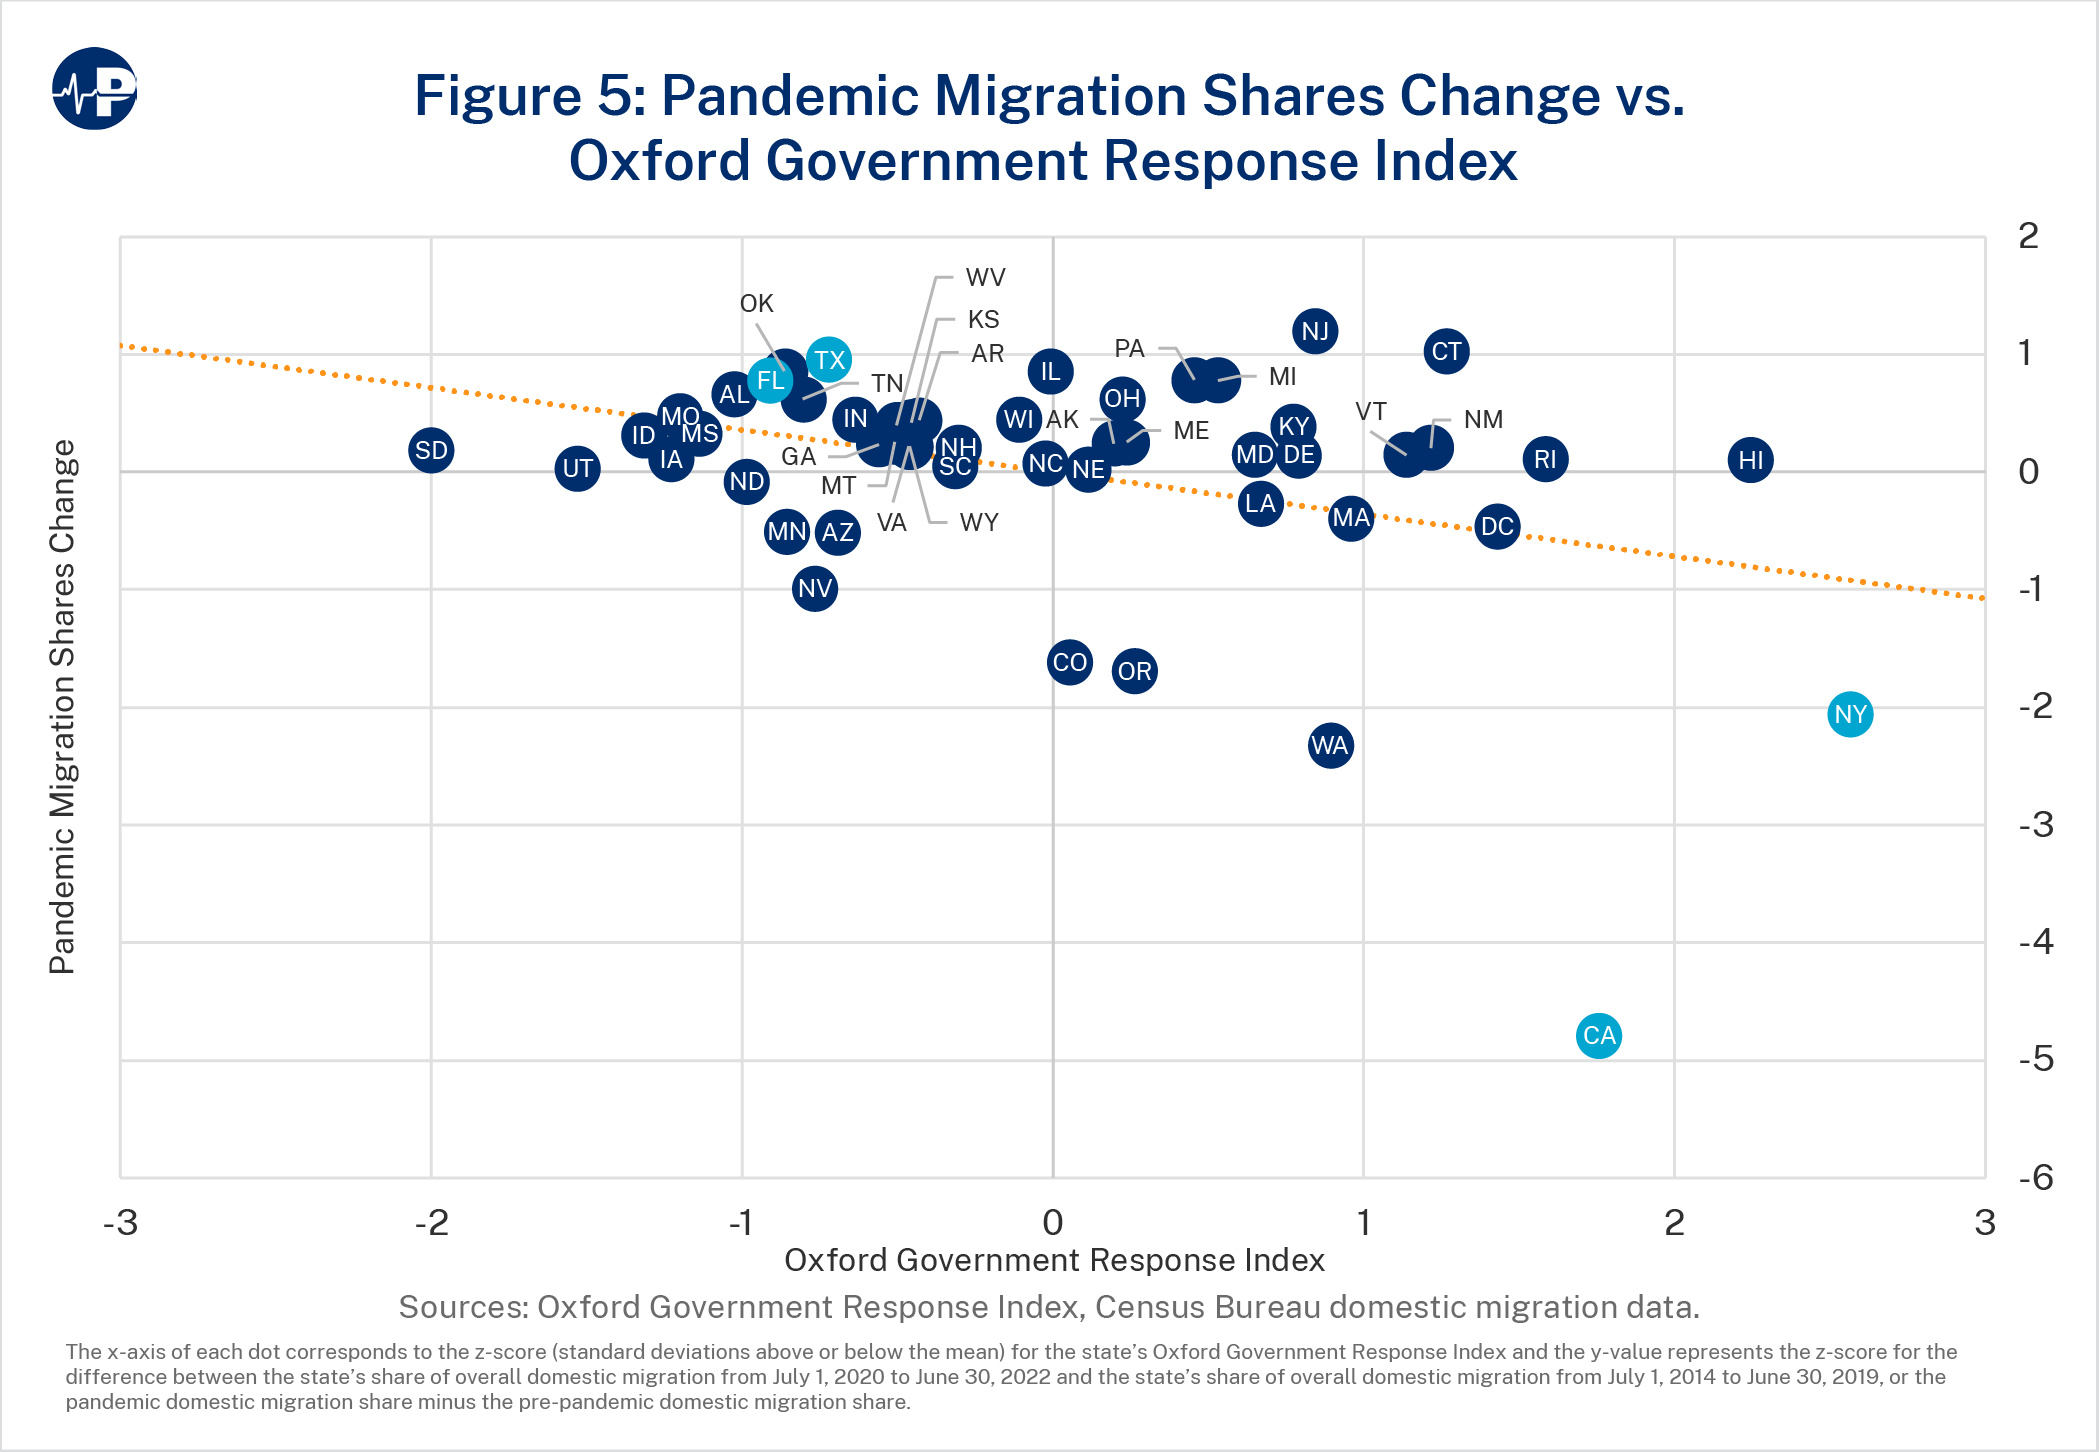
The changes in states’ shares were then regressed against the Oxford Government Response Index, and, as Figure 5 shows, the result was the same: a significant negative correlation (β=-0.36; p=0.010) with lockdown severity. See Table 5 in the Appendix for the state share of domestic migration in each of the five pre-pandemic years and the two pandemic years.
The importance of lockdown severity as a motivating factor in spurring out-migration becomes apparent when we look at two of the highest lockdown scorers on the Oxford index: New York and California.33 New York and California total 18 percent of the nation’s population, but both saw huge jumps in out-migration in the first pandemic year 2021 (July, 1, 2020, to June 30, 2021) so that together their outflows accounted for more than two-thirds of all net domestic migration outflows (67.6 percent) that year. In the second pandemic year 2022 (July 1, 2021, to June 30, 2022), New York and California had 53.8 percent of all net domestic migration outflows. Over both pandemic years, California lost 710,529 domestic residents (1.8 percent of its July 1, 2020, population) and New York lost 651,742 domestic residents (3.2 percent of its July 1, 2020, population).
In the five pre-pandemic years, California’s share of outward migration rose steadily from a low of 10.3 percent in 2015 to a high of 26.0 percent in 2019, with an average of 17.8 percent. It increased to 34.5 percent in the first pandemic year of 2021 before falling to 28.7 percent in the second pandemic year of 2022. California’s fall to a share of outward migration that appears consistent with its pre-pandemic trend likely reflects the large and continuing nationwide surge in domestic migration in 2022 (1,195,235), which was 12 percent higher than 2021 (1,063,730). California’s domestic outflow increased from 79,938 people in 2015 through 203,414 people in 2019 then spiked in the pandemic years, totaling a net loss of 367,299 people in 2021 and 343,230 in 2022.
New York’s share of the nation’s outward migration was large and relatively stable, with an annual average of 23.2 percent in the five pre-pandemic years and 23.1 percent in 2019. It increased to 33.1 percent in 2021 before dipping to 25.1 percent in 2022. In numerical terms, New York’s average annual loss was 181,938 people in the pre-pandemic period, but the loss nearly doubled from 180,649 people in 2019 to 352,185 people in 2021. As in California, New York’s loss remained high in 2022 at 299,557 people but formed a lower percentage share of the higher total domestic migration in 2022.
Some of the 2021 increase in New York could reflect people fleeing New York City, which was an early epicenter of COVID-19 in the United States. While this undoubtedly occurred, it was unlikely a major factor for the entire year. The 2021 migration year begins on July 1, 2020, at which point the early New York COVID-19 surge was over. Cases in New York City and New York State excluding New York City both peaked in early April 2020, then declined and thereafter began to follow national trends. COVID-19 deaths in New York peaked in April and again in May 2020 for the city but then largely followed national trends. In fact, New York City and New York State missed an upswing in COVID-19 deaths that occurred nationwide in the summer of 2020.34
In contrast, the 14 states with the highest shares of inflow migration during the two pandemic years (see Table 5 in Appendix) all had Oxford index scores below the average (i.e., less severe government responses). Florida led all states with positive domestic migration in 2021 and 2022 (539,745 people, or 2.5 percent of the state’s July 1, 2020, population), followed by Texas (401,268 people, or 1.4 percent of the state’s July 1, 2020, population), North Carolina (188,469, or 1.8 percent of the state’s July 1, 2020, population), and Arizona (164,010, or 2.3 percent of the state’s July 1, 2020, population). These four states alone accounted for 57.3 percent of the net in-migration from July 1, 2020, through June 30, 2022.
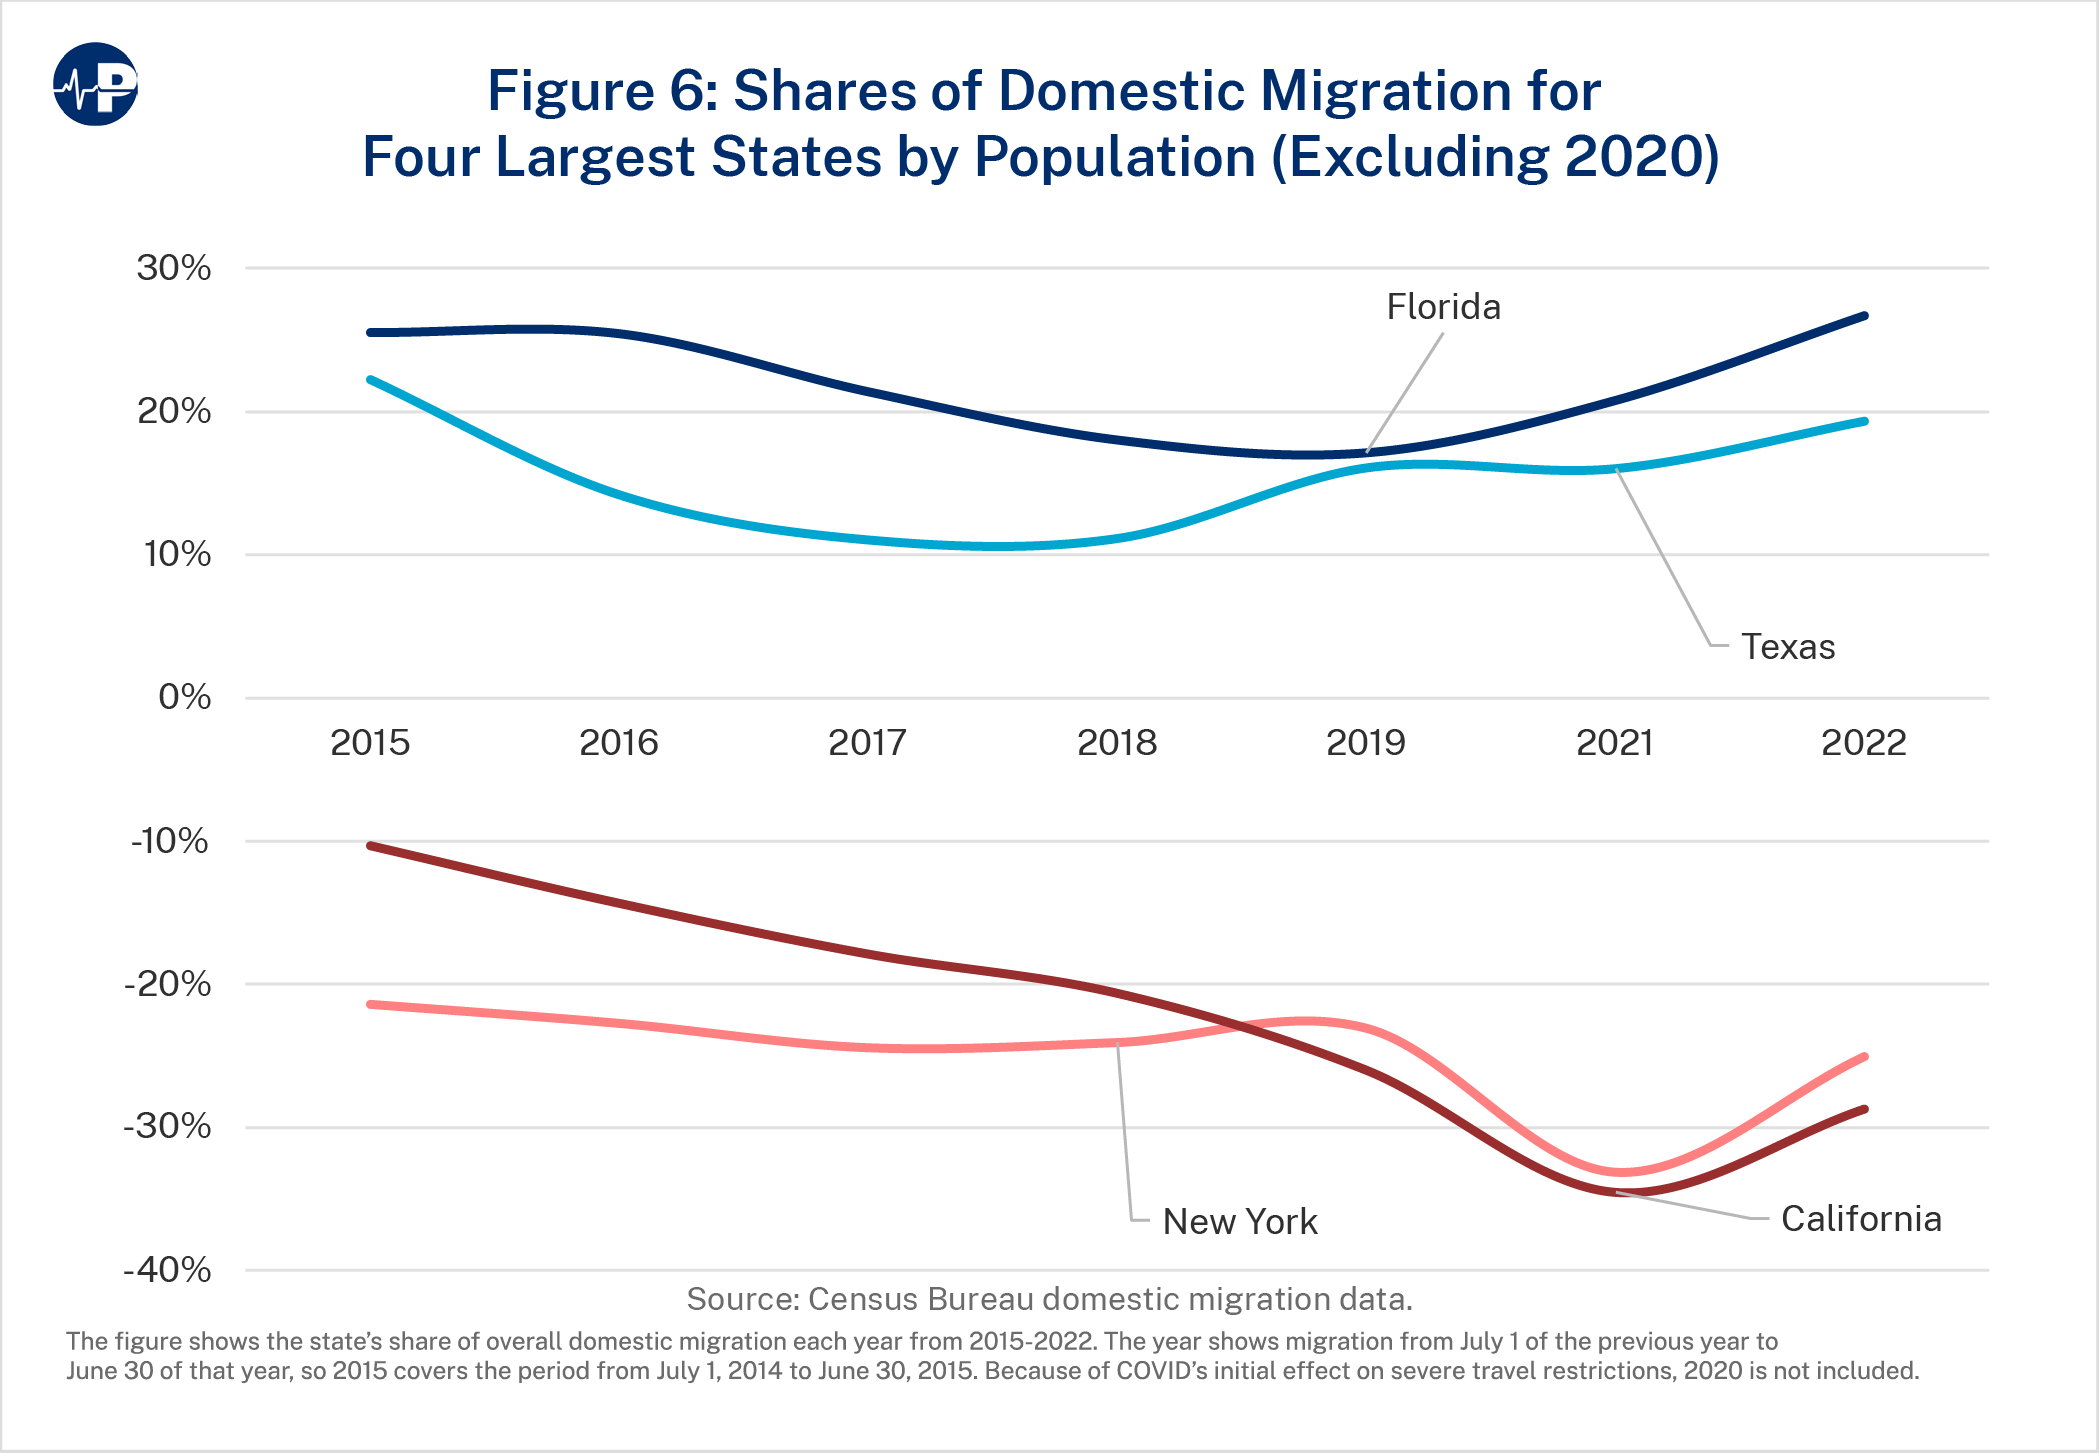
Figure 6 shows the time trend for the top two states by out-migration shares (California and New York) and the top two states by in-migration shares (Florida and Texas).
U.S. Census Bureau data indicate there was a spike in domestic out-migration from major metropolitan areas to smaller metropolitan areas and non-metropolitan areas during the pandemic.35 Smaller counties tended to have increases in net domestic migration, while larger counties (those with populations of 500,000 or more) tended to have decreases in net domestic migration.36
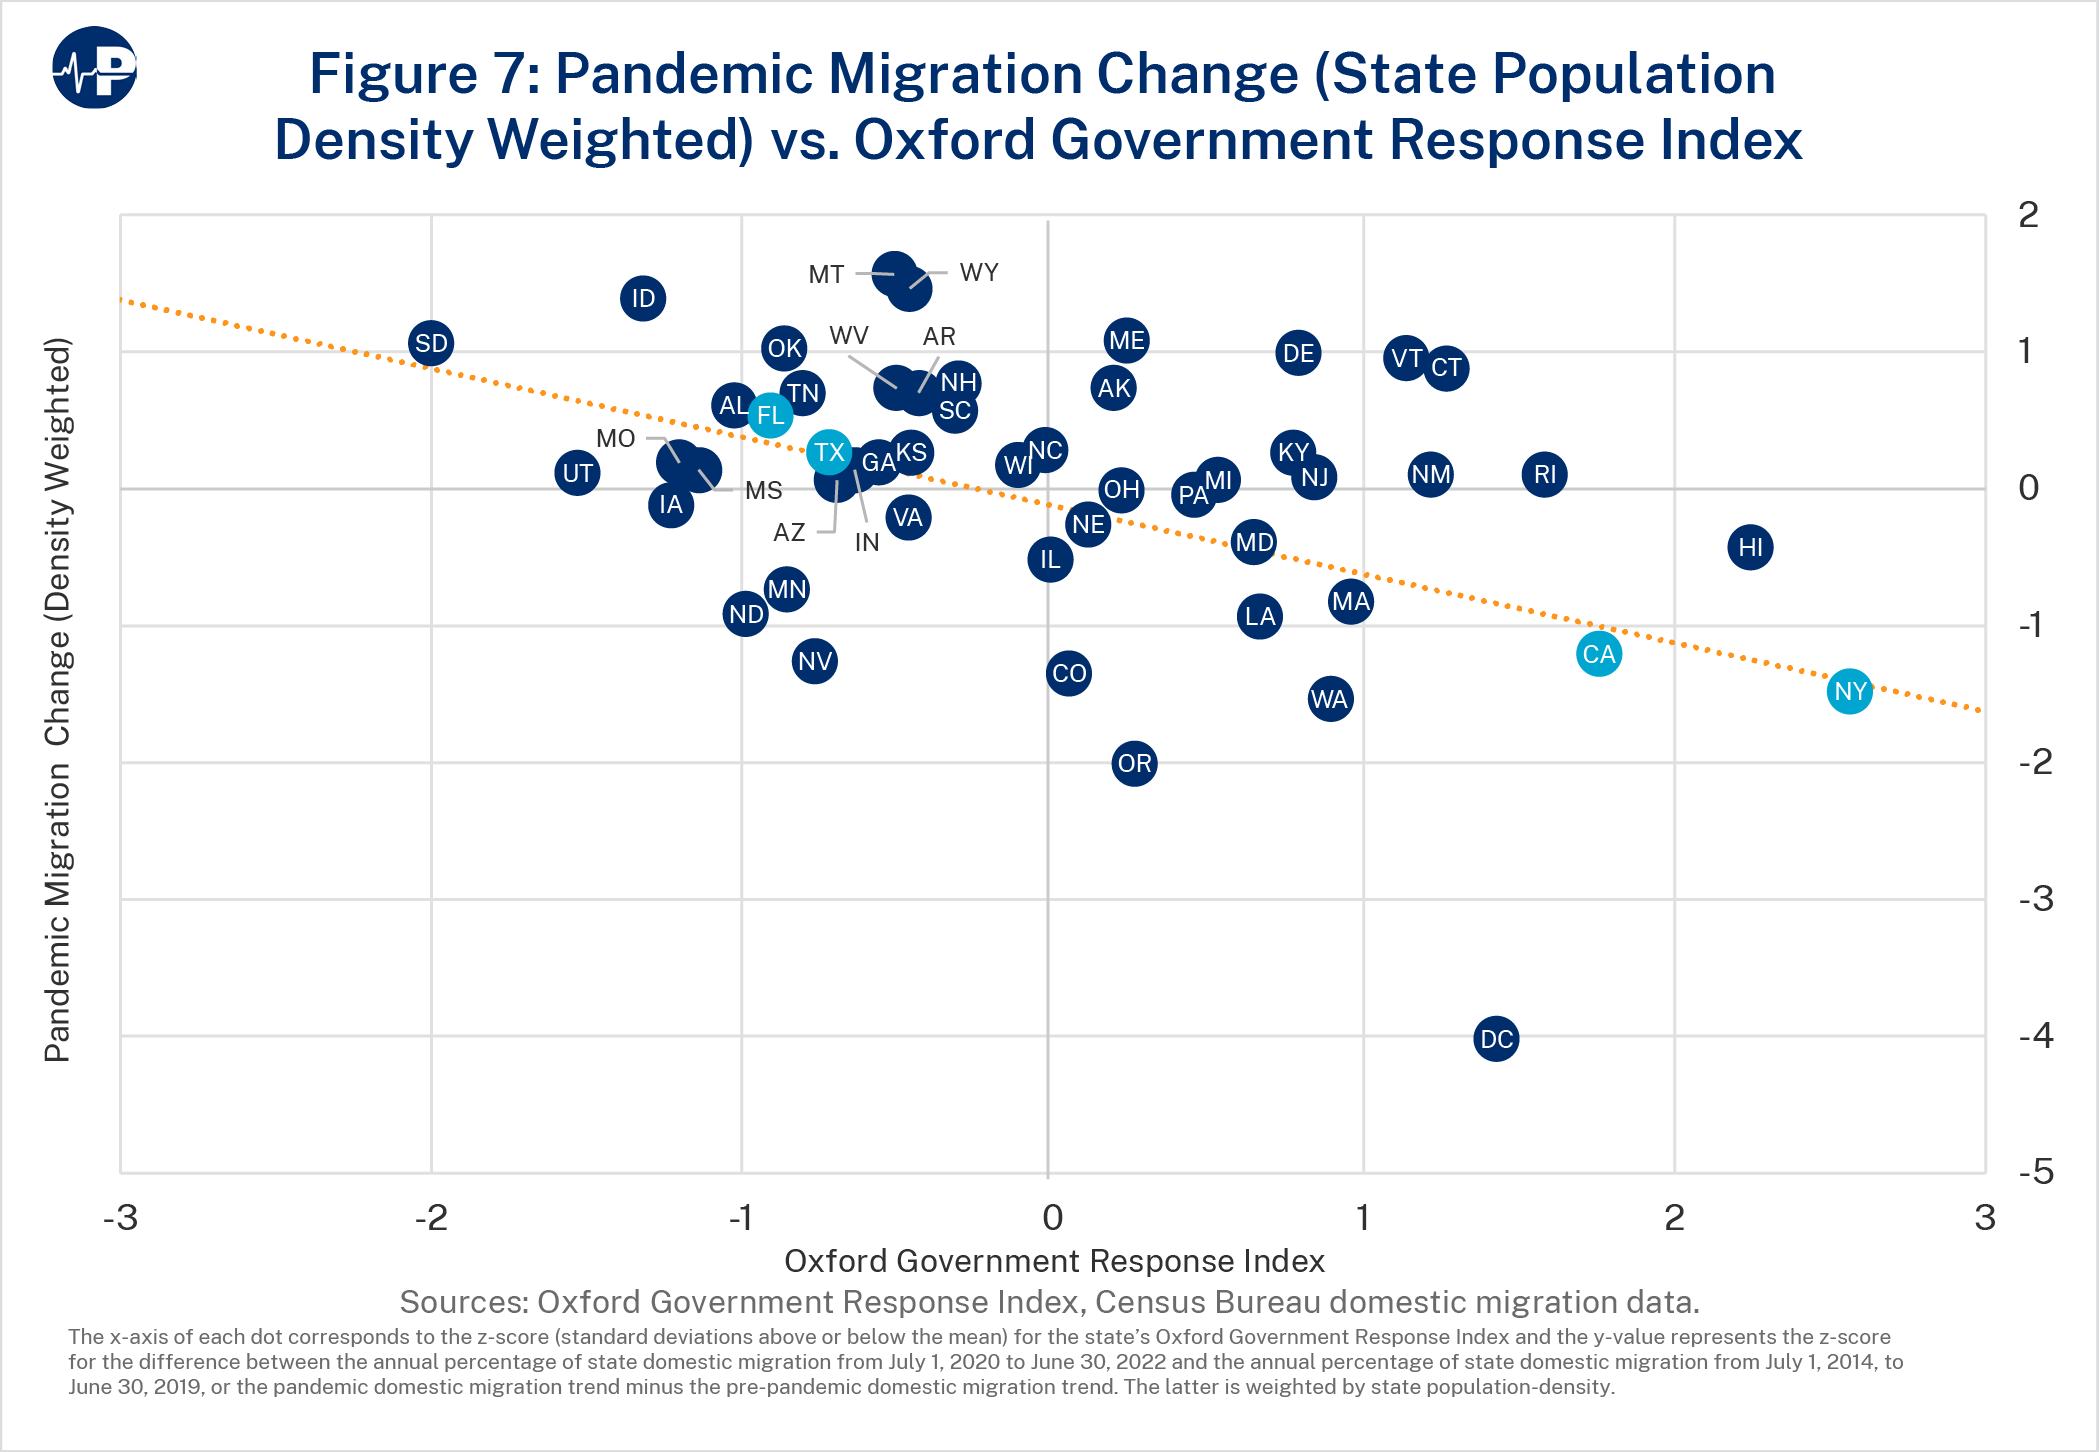
We therefore performed a third migration analysis to account for each state’s population density so that the results would not be influenced by the fact that some states have more densely populated, large urban areas while other states are more rural. As indicated in Figure 7, this adjustment did not affect the results: Lockdowns are still significantly negatively correlated with migration (β=-0.25; p=0.037).
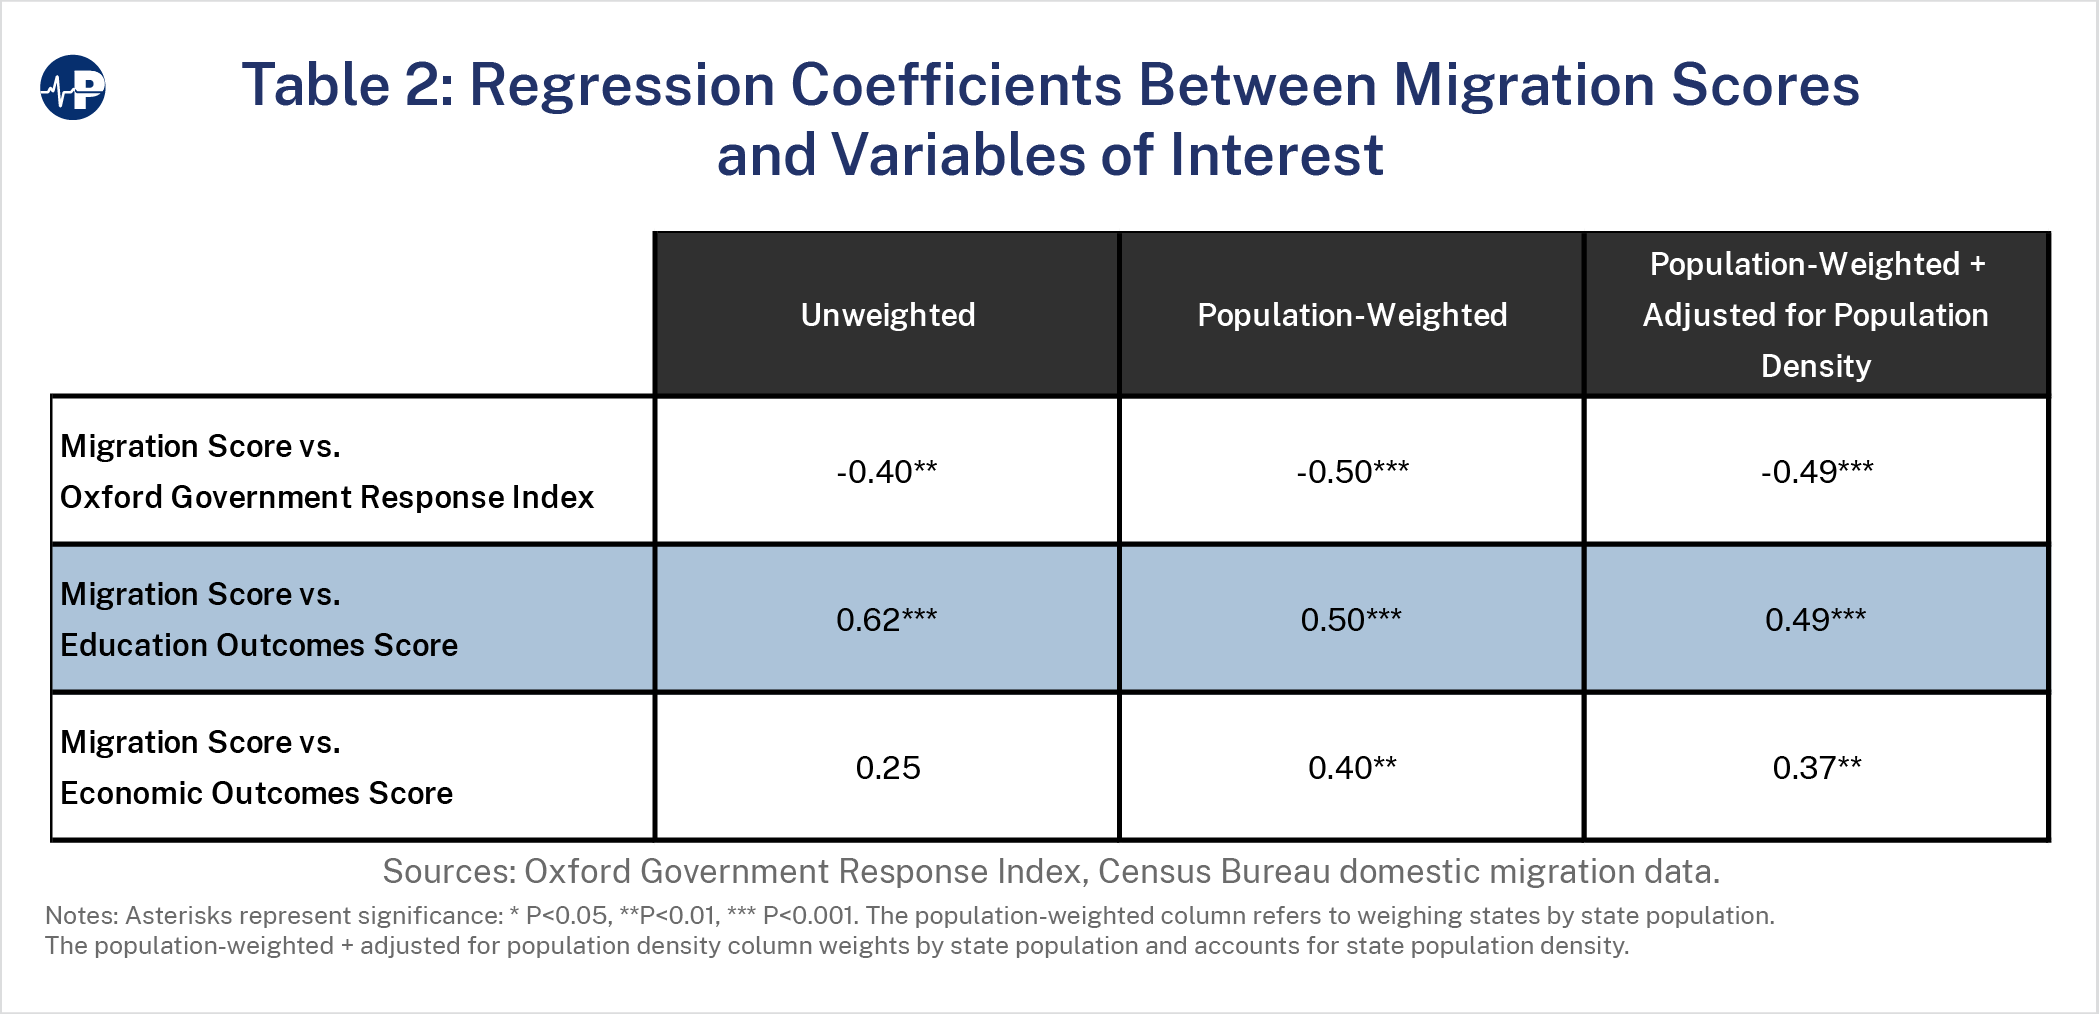
Table 2 shows that the overall government response, the education outcomes score (number of days of open school), and the economic outcomes score were all associated with state-tostate migration. People moved away from more stringent lockdown states, where schools were more likely closed, and moved to less stringent states, where schools were more open. Anecdotal reports suggest that families with school-age children leaving states with closed schools for states with open schools was a major component of interstate moves.37
Two states—Florida and California—epitomize the dissimilar approaches to lockdown measures by states across the nation. Looking at the outcomes of their policies is instructive.
Both are geographically large, heterogenous states with substantial populations. In 2020, when the pandemic began, Florida was the nation’s third most populous state with roughly 21.5 million people. California was the most populous with roughly 39.5 million people.38
California and Florida took markedly different approaches to the pandemic. California was a standard bearer for lengthy and severe lockdown measures. Florida, in contrast, adopted a“focused protection” strategy that directed mitigation strategies toward sheltering high-risk populations such as the elderly but avoided generalized lockdowns. Governors of both states publicly criticized their counterparts in the other state. Federal officials and many in the media joined in with frequent criticisms of Florida Governor Ron DeSantis.
Florida initially imposed lockdown measures like every other state during the spring of 2020. But by May 2020, it started a phased reopening of businesses, including restaurants and theme parks at reduced capacity, provided they followed social distancing and sanitary protocols.39 When Governor DeSantis barred public school districts from imposing mask mandates for the upcoming school year, President Biden told the governor to “get out of the way” of local districts attempting to stop COVID spread.40
Following experts such as Stanford’s Jay Bhattacharya, Harvard’s Martin Kulldorff, and Oxford’s Sunetra Gupta—the same experts responsible for issuing the Great Barrington declaration on October 4, 2020, that advocated “focused protection” of vulnerable populations—Florida began to concentrate its mitigation and protection efforts on nursing homes and hard-hit hospitals.41 Unlike New York and several other states that required nursing homes to admit hospital discharged patients without testing for COVID, Florida set up dedicated COVID-only nursing centers to house COVID-positive elderly patients discharged from hospitals.42
In September 2020, Florida lifted remaining restrictions on restaurants and bars and required local school districts to offer in-person instruction five days a week. In a May 3, 2021, executive order, Governor DeSantis barred local governments and school systems from imposing COVID-19 restrictions, including mask rules. Florida’s relaxation elicited condemnation that it was moving too fast. CDC Director Dr. Anthony Fauci complained, “Certainly Florida I know, you know, I think jumped over a couple of checkpoints.”43 The media vilified DeSantis as irresponsible and dangerous.44 Some labeled him “DeathSantis.”45
In his March 2, 2021, State ofthe State address, Governor DeSantis noted that Florida’s renunciation of lockdown measures leftthe state in a much better position than other states. “Florida’s schools are open—and we are one of only a handful of states in which every parent has a right to send their child to school in-person. All Floridians have a right to earn a living—and our citizens are employed at higher rates than those in the nation as a whole.”46
The following day, President Biden criticized states such as Florida that lifted restrictions on businesses and rescinded mask mandates as engaging in “Neanderthal thinking.”47
Meanwhile, other large states such as California continued lockdown measures. California Governor Gavin Newsom claimed, “With respect, we’d have 40,000 more Californians dead if we took (the DeSantis) approach.… I do not look for inspiration to that particular governor.”48 Yet Florida’s age-adjusted, per capita COVID mortality rate is roughly the same as California’s.
The results of this study largely support the Florida approach. California had the third-highest raw score on the Oxford Government Response Index (57.66), well above the national average (49.85).49 Florida, in contrast, was well below the average with a score (45.81) that puts it among the lowest states in the nation. California was worst in the nation in terms of in-school education days. Florida was the third best. Table 3 shows the results as z-scores (standard deviations from the mean).
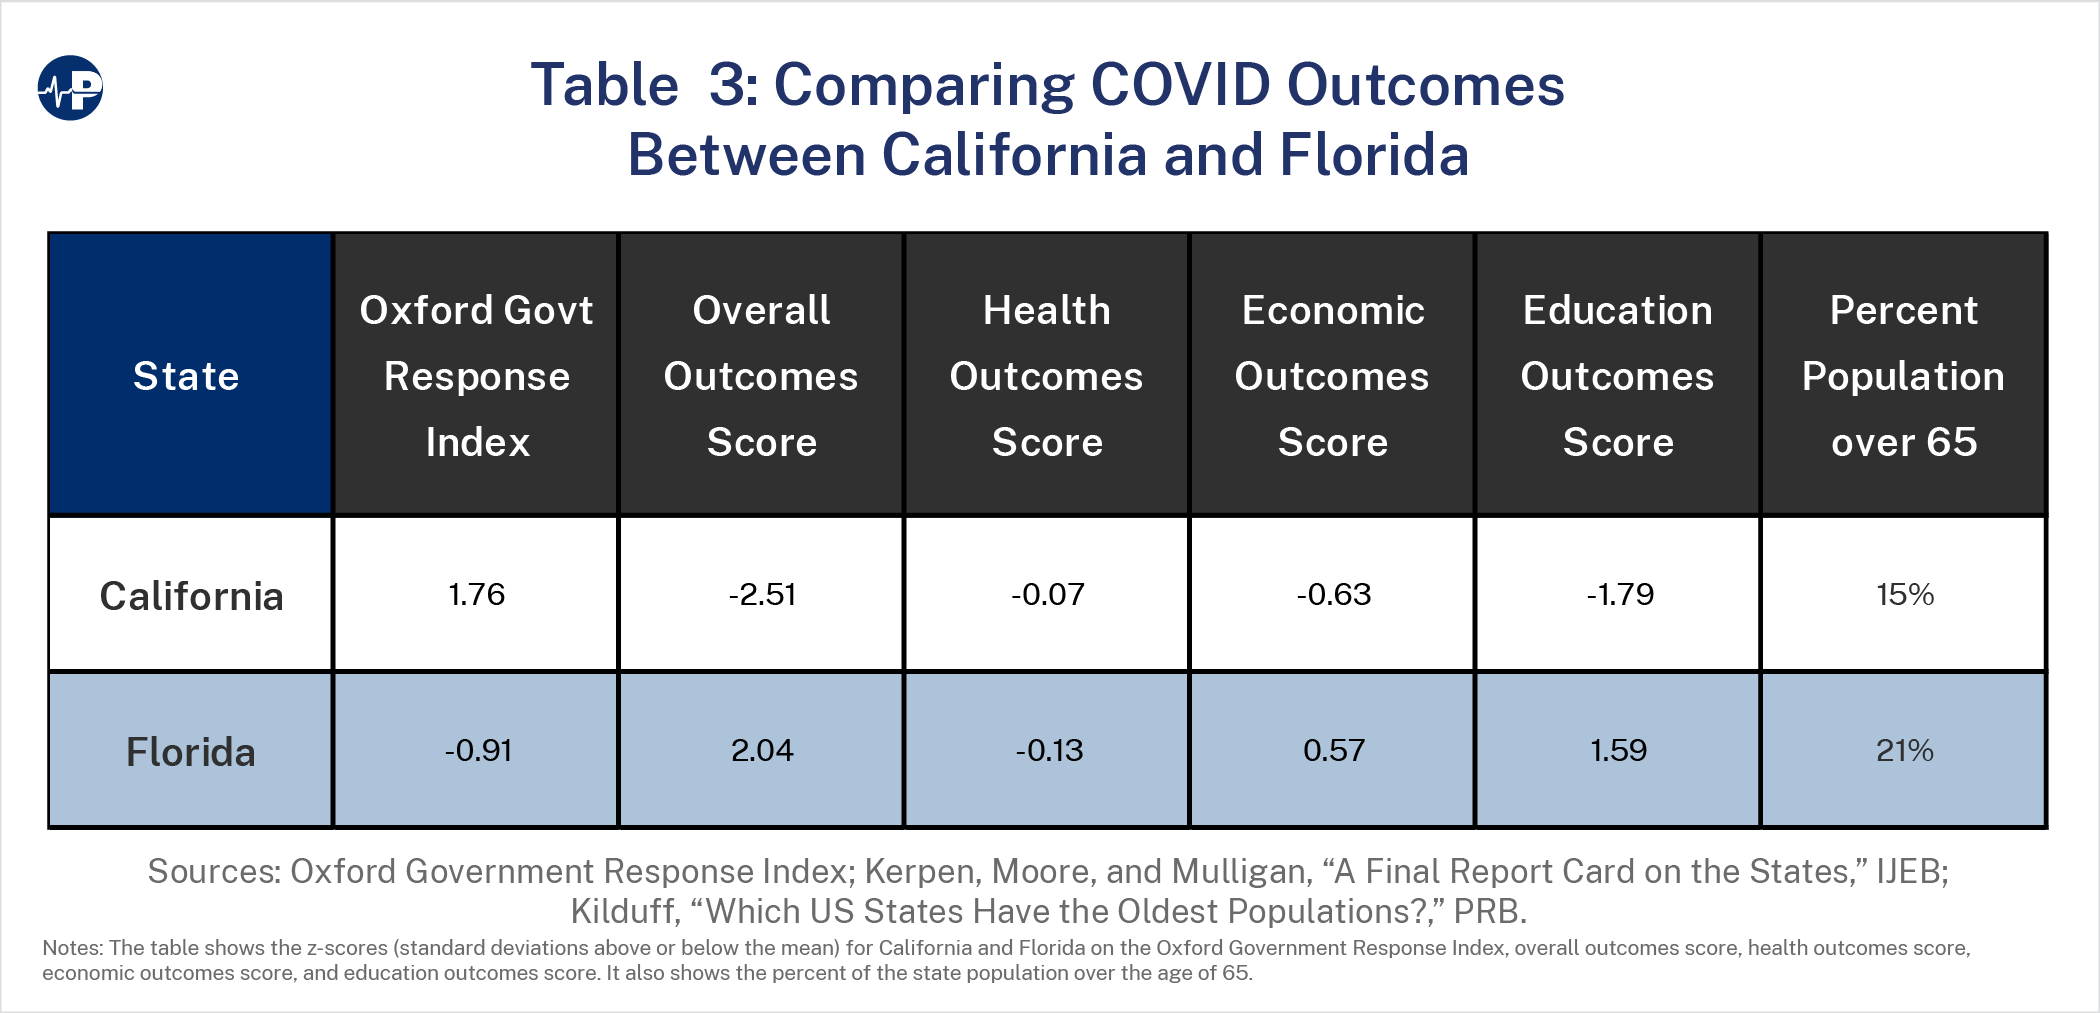
Florida and California have roughly equal age- and disease-adjusted health outcomes scores, suggesting there was no substantial health benefit from California’s severe lockdowns. And California suffered harm from those measures, scoring far worse than Florida on the economics outcomes (1.20 standard deviations apart), the education outcomes (3.38 standard deviations apart), and the overall COVID score (4.55 standard deviations apart).50
California applied severe lockdowns despite seemingly having less need to do so than Florida. Far and away the most important factor in determining the severity of COVID-19 illness is age. There is an exponential relationship between age and COVID-19’s infection fatality rate. The estimated infection fatality rate is very low for children and younger adults (0.002% at age 10 and 0.01% at age 25), increases to 0.4% by age 55, and then soars with advanced age (1.4% at age 65, 4.6% at age 75, and 15% at age 85).51 These relative fatality rates have stayed consistent through successive time and viral variant periods.
Any comparison of states must therefore account for the different age distributions of their populations and especially the percent of the population that is 65 and older. Florida has the second-highest percentage of population 65 and older (21.3 percent) in the nation.52 In contrast, California is 45th (15.2 percent).
Despite its elderly population and “focused” approach, Florida had the 22nd best age-adjusted COVID-19 death rate per 100,000 population (292) among the 50 states, Puerto Rico, and District of Columbia. That puts it in the same ballpark as young, mandate-heavy California, which was 15th best (270).53
The Florida approach proved to be better overall. The lockdown measures imposed in California and other (largely blue) states did little to improve health outcomes (see Figure 1 above) and led to significantly worse economic scores and overall COVID response scores than in Florida (see Figures 2 and 3 above). Florida had a roughly average health outcomes score while sustaining economic activity and 96 percent open schools.54 Domestic migration patterns show a stark difference in response to the differing lockdown approaches between the two states. In the five pre-pandemic years we studied (2015–19), Florida had consistently large migration inflows that averaged 169,569 per year. California had consistently large migration outflows averaging 139,710 per year. As Figure 6 shows, Florida’s inflows started to decrease toward the end of the pre-pandemic period, while California’s outflows showed consistent annual growth.
Both states experienced large increases from their pre-pandemic migration trends during the pandemic year of 2021. California’s outflow rose from 203,414 in 2019 to 367,299 in 2021, an 81 percent increase and a 163 percent increase over the average annual outflow during the five pre-pandemic years.55 California’s outflow remained high in 2022 with a net exodus of 343,230 people. Florida, in contrast, saw a jump from 133,910 in-migrants in 2019 to 220,890 in-migrants in 2021, a 65 percent increase. Florida’s 2021 in-migration was a 30 percent increase over its pre-pandemic annual average. The inflow to Florida accelerated further in 2022, with a net 318,855 people moving to the state between July 1, 2021, and June 30, 2022.
California accounts for 11.8 percent of the nation’s population, but its out-migration was 34.5 percent of the total domestic migration in 2021 and 28.7 percent in 2022, up from a 17.8 percent annual average in the pre-pandemic years and 26.0 percent in 2019. Meanwhile, Florida, with 6.6 percent of the nation’s population, accounted for 20.8 percent of domestic 2021 migration—virtually the same as its five pre-pandemic years annual average share of 21.5 percent but above its 17.1 percent share in 2019. Florida’s share continued to increase to 26.7 percent of domestic migration in 2022 (see Table 5 in Appendix).
A study from the Federal Reserve Bank of Chicago that used a different data source than we did (United Van Lines records of interstate moves) and covered a different time period (calendar years 2018–19 for the pre-pandemic period and 2020–21 for the pandemic period) had similar findings, although the magnitude was different, likely because it included the first six months of 2020 when there were travel restrictions. California had the greatest number of outbound moves in both the pre-pandemic period and in the pandemic period, and California’s outbound moves as a percentage of its total annual moves increased from 56.2 percent to 59.4 percent. Florida, which had the highest number of inbound moves pre-pandemic, saw its respective share of inbound moves as a percentage of its total annual moves increase from 57.2 percent to 61.7 percent during the pandemic.56
Hundreds of studies since the pandemic onset have failed to document that compulsory measures significantly curtailed COVID deaths.57 Multiple reviews and econometric studies have shown that the severity of mitigation measures imposed by states and countries had essentially no relation to their health outcomes.58
Shelter-in-place orders during the first wave of the pandemic had little impact on COVID spread or deaths. Many people were already voluntarily social distancing before the impositions of government orders, and others failed to comply with those orders.59 One review of studies conducted in late 2020 and 2021 avoided the false assumptions in many early studies that overestimated the benefits and underestimated the costs of lockdowns. It concluded that lockdowns had, at best, a marginal effect on COVID-19 death largely because of voluntary changes in behavior.60 People avoided social contact before government lockdowns were imposed and, to some extent, failed to comply with them when local disease conditions abated but lockdowns remained in place.
This study documents that government measures, across states, to combat the pandemic did little to improve health outcomes as measured by COVID-19 deaths and all-cause excess mortality. But the intensity and duration of these measures had negative impacts on economic performance as measured by unemployment and GDP by state and on education as measured by access to in-person schooling.61
Lockdown measures disproportionally impacted those who were less educated and less affluent. The Federal Reserve found that 20 percent of those working in February 2020 lost their jobs, but the figure was 39 percent for those living in households earning less than $40,000 per year. This was likely related to the fact that while 63 percent of workers with bachelor’s degrees were able to work remotely, only 20 percent of workers with high school degrees or less could work from home during the spring of 2020.62
Pandemic school closures and the substitution of virtual/remote learning for in-person school resulted in large, persistent, negative educational and economic effects that differed by income and race. There were significant declines in elementary students’ pass rates on state standardized math and reading assessments in the 2020-21 school year. Districts with more in-person schooling had significantly lower declines in pass rates, and the value of in-person learning was larger for districts with larger populations of Black students.63 The U.S. Department of Education’s National Assessment of Educational Progress found that average mathematics scores for fourth-graders decreased by five points in 2022 compared to 2019, while scores for eighth-graders dropped eight points—the largest average score declines ever recorded in that subject. In reading, average scores for both grades fell three points to levels not seen in more than 17 years.64 It is estimated that these math and reading learning losses will translate into the average student having 5.6 percent lower lifetime earnings and into the average state having a 1.9 percent lower GDP each year for the remainder of the 21st century.65 Another study estimates that high school students from poor neighborhoods suffered a learning loss of 0.4 standard deviations, or, when translated into grades, a half-point decline in grade-point average, while students from affluent areas had essentially no learning loss. These learning losses are difficult to offset and will likely impair poor children’s economic futures.66
Educational disruptions did not only impact learning and economic outcomes. CDC data suggest that children who received virtual or combined instruction experienced decreased physical activity and decreased mental or emotional health compared with children who received in-person instruction.67
Pandemic response measures also led to several adverse health outcomes. Smoking, drinking, and waistlines increased.68 Mulligan and Arnott document an increase in non-COVID deaths from stroke, heart attack, diabetes, obesity, drug overdose, alcohol-induced causes, homicide, and traffic accidents at a combined annual rate of 97,000 per year above the previous trend beginning in April 2020.69 These excess deaths, which occurred disproportionately among the nonelderly, continued unabated through at least the first half of 2022 at higher levels than 2020 and 2021, even as COVID-19 deaths have receded.70
The fact that COVID-19 case fatality rose steeply with advancing age was apparent very early in the pandemic. Studies predicted that targeting containment measures toward the most vulnerable age group—the elderly—could generally achieve the same health outcomes at far lower economic cost than uniform restrictive policies.71 Nevertheless, nearly all countries and many U.S. states imposed uniform lockdown measures, and some kept them in place for extended periods of time.
A notable exception was Sweden. Unlike other countries that imposed stricter lockdown measures, Sweden mainly focused on voluntary measures and personal risk-reward calculations. There were early compulsory measures that limited the size of public gatherings, banned visitation of most elderly care residents, and introduced distance learning for those aged 17 and older. But preschools for ages 1–6 and schools for ages 7–16 were kept open. Restaurants and businesses remained open with some restrictions such as social distancing rules. Public authorities urged people aged 70 and older to limit personal contacts, and citizens of all ages were also asked to social distance, wash their hands regularly, avoid nonessential travel, and work from home if possible. But face masks were neither required nor encouraged. Mobile phone data showed a substantial decrease in mobility in Swedish society in early March 2020 that occurred even before recommendations to limit travel and to work from home were issued.72
An early systematic literature review by a Swedish epidemiologist concluded that keeping schools and kindergartens open is unlikely to drive the pandemic and impact COVID-19 mortality rates in older people, because children accounted for a small fraction of COVID-19 cases, had social contacts mostly with peers or parents rather than older people, and were rarely the index case causing outbreaks.73 Subsequent work confirmed that keeping Swedish schools open was safe.
A study of hospital admissions during the first two months of the pandemic (mid-March to mid-May) in the Stockholm area found that pediatric admissions accounted for a minor part (0.7 percent) of the total admissions due to COVID-19 and that more than half of the children admitted with a primary diagnosis of COVID-19 were less than one year of age and hence were not in school.74 A study of severe COVID-19—as defined by intensive care unit (ICU) admissions—nationwide among Swedish children 1–16 years of age and their teachers during the initial four pandemic months (March through June 2020) found a low incidence of severe COVID among schoolchildren. There were just 15 pediatric ICU admissions, four of whom had pre-existing chronic medical conditions. None of the children died. There was no increase in age- and sex-adjusted relative risk of ICU admission among Swedish teachers as compared to other occupations.75
Despite its markedly less severe government mitigation measures as compared with other countries, Sweden’s health outcomes did not suffer. When adjusted for age, Sweden was right around average, with the 15th highest per capita COVID-19 mortality rate out of 26 European nations.76 While non-COVID excess deaths were elevated in Europe and the United States, they declined in Sweden.77
A national commission appointed by the Swedish government did several reports assessing the country’s COVID response. It concluded that focusing on voluntary measures rather than mandates “was fundamentally correct” from an infectious disease perspective and preserved Swedes’ personal freedoms, although more rigorous and intrusive disease prevention and control measures should have been undertaken early on (February/March 2020), especially to protect older people and other at-risk groups. Nevertheless, compared with the rest of Europe, “Sweden has come through the pandemic relatively well and is among the countries with the lowest excess mortality over the period 2020–2021.”78
Moreover, as our results would predict, Sweden’s less severe government lockdown measures resulted in better economic results. The International Monetary Fund found that Sweden’s less stringent strategy decreased the negative economic impact of the first stage of the pandemic.79 The Swedish economy did better in 2020 and recovered more quickly in 2021 than did that of most other European countries.80
The results of this study of disparate U.S. state responses, along with the findings of multiple other studies of government lockdown measures, lend support to the conclusion of the Swedish National Commission that it “is not convinced that extended or recurring mandatory lockdowns, as introduced in other countries, are a necessary element in the response to a new, serious epidemic outbreak.”