Paul Winfree
Paul Winfree, Ph.D., is the President and CEO of the Economic Policy Innovation Center (EPIC). He has served in top management…
Reforming Government. Empowering Patients.
Navigation
This paper analyzes the fiscal sustainability of U.S. federal health programs, projecting that without structural reforms, increased mandatory health spending will significantly reduce the government’s fiscal space within 25 to 50 years, threatening debt sustainability and economic stability.
In 2023, the federal government is expected to spend 6.2 percent of the economy (or more than $1.6 trillion) on mandatory health programs. These programs include Medicare, Medicaid, the Children’s Health Insurance Program (CHIP), and subsidies for insurance purchased through the exchanges established by the Affordable Care Act (ACA). The Congressional Budget Office (CBO) estimates that within 30 years, the federal government will annually spend at least 9 percent of the economy on those programs.
The growth in spending on federal health programs is unsustainable. In this paper, I find that spending on health programs will likely compromise the federal government’s ability to borrow money, as well as the sustainability of existing debt, within the next 25 to 50 years. This means that spending on federal health programs without structural reforms will significantly limit the federal government’s ability to take on additional debt to address a future economic recession, pandemic, war, or another adverse event. For these estimates, I use a method adopted by the International Monetary Fund (IMF) and a range of assumptions about interest rates and the amount of debt the Federal Reserve is able to hold, as well as other estimates from leading academics and risk management organizations.
I find that there are two main causes of debt accumulation over the next few decades: federal health spending and interest payments. I also find that the CBO’s assumptions of excess cost growth (i.e., the increase in spending per capita relative to per capita growth in the economy) for federal health programs are far lower than historical norms and thus may understate the level of health spending in the future. However, even if excess federal health costs were to be lower than historic levels, the capacity of the federal government to take on additional debt over the next few decades would not substantially change.
To ensure that the federal government’s borrowing capacity does not become exhausted within the next 25 to 50 years, the growth in federal health care spending must be reduced relative to baseline spending. I provide two scenarios that would provide additional borrowing capacity. These would require federal spending on Medicare, Medicaid, CHIP, and the insurance subsidies to be reduced by at least 7.5 percent of baseline spending, or 0.5 percent of the economy, over the 2025 to 2034 budget window. Beginning structural reforms sooner rather than later will allow a path of continuous growth in the budget for health programs while avoiding much larger, drastic cuts in the future as well as problematic future tax increases, inflation, and higher interest rates
Federal health programs are unsustainable without structural reforms. In this paper, I estimate the federal government’s “fiscal space,” which is its capacity for additional debt in response to an economic shock and examine the key contributors to the deterioration of U.S. fiscal space. Using the Congressional Budget Office’s baseline fiscal scenario, I find that the federal government will likely exhaust its fiscal space within the next 25 to 50 years. The main causes of this exhaustion are high growth in federal health spending and associated net interest costs. To preserve fiscal space, federal health spending must be reduced by at least 0.5 percent of GDP between 2025 and 2034.
In 2023, the federal government is expected to spend about 6.2 percent of the economy (or more than $1.6 trillion) on mandatory health programs. These programs include Medicare, Medicaid, the Children’s Health Insurance Program (CHIP), and subsidies for insurance purchased through the exchanges established by the Affordable Care Act (ACA). The Congressional Budget Office (CBO) estimates that within 30 years, the federal government will annually spend at least 9 percent of the economy on those programs.1 The absolute magnitude of federal health spending raises an important question: is this projected spending on federal health programs sustainable?
If mandatory spending on health programs continues to exceed growth in the economy, the unequivocal answer is “no.”2 But how unsustainable are the federal health programs over the next several decades? Furman and Summers have argued that policymakers should “stop their obsession” with budget deficits driven by existing entitlement spending, especially during periods with low interest rates.3 Blanchard argues that public debt has no fiscal cost when interest rates on government debt are lower than economic growth.4 This allows debt to be rolled over without increasing welfare costs associated with accumulating more debt. However, this approach could eventually break down once the existing stock of debt becomes so large that it cannot be rolled over and compromises fiscal solvency.5 Therefore, it is important to determine when this turning point could happen.
This determination is dependent on the capacity of the federal government to take on additional debt as the result of a fiscal shock. Recent reductions in economic output stemming from financial events (e.g., 2007-08 financial crisis) as well as other adverse events (e.g., the economic contraction associated with the COVID-19 pandemic) have introduced fiscal risks that have compelled the federal government to act as an “insurer of last resort.” In addition, these events will often automatically reduce government revenues and increase mandatory spending, particularly as unemployment increases. Policymakers will also face political pressure to increase discretionary spending to help counteract the wide-ranging effects caused by labor and business disruptions associated with these contractions.6
This capacity to take on additional debt without compromising the ability of the U.S. to access debt markets (i.e., borrow money)—or the sustainability of existing debt—is called the “fiscal space.” This paper estimates that, under CBO’s baseline fiscal scenario, the federal government will exhaust its fiscal space between 2045 and 2070 based on a variety of assumptions. Specifically, after the fiscal space is exhausted, the primary balance (i.e., the difference between the amount the government collects and the amount that is spent on federal programs excluding interest) will be unable to cover interest payments. In short, the money collected by the government will not cover the federal government’s minimum obligations. As a result, debt will grow continuously as a percent of the economy absent significant tax increases, which would be unsustainable and exacerbate other economic problems. This is the point at which the federal government will hit a hard debt limit or when debt markets will enforce a limit on the borrowing capacity of the federal government.7
There are two main causes of debt accumulation over the next few decades: federal health spending and net interest payments. I also find that CBO’s assumptions of excess cost growth (i.e., the increase in spending per capita relative to per capita growth in the economy) for federal health programs are far lower than historical norms and thus may understate the level of health spending in the future. However, even excess health costs that are lower than historical levels would not substantially change the capacity of the federal government to take on additional debt over the next 30 years.
Changing the trajectory of federal spending will require policy decisions that are beyond the scope of this paper. However, to avoid exhausting fiscal space, federal health spending will need to be reduced relative to baseline spending. I provide two scenarios of policy changes that would provide additional fiscal space. To avoid exhausting fiscal space over the next 30 years, federal health spending would need to be reduced by 7.5 and 18.3 percent of the baseline—or between 0.5 and 1.2 percent of GDP—over the 2025-2034 budget window. These reductions in spending may seem significant; however, beginning structural reforms sooner will allow a path of continuous growth in the budget for health programs while avoiding potentially draconian cuts in the future as well as problematic future tax increases, inflation, and higher interest rates.
The only major category of federal spending that is expected to grow faster than interest on the debt is spending on federal health programs. These programs include Medicare, Medicaid, the Children’s Health Insurance Program (CHIP), and subsidies for private insurance purchased on the exchanges created by the Affordable Care Act (ACA). These programs also account for a significant portion of the total budget. In 2022, about a quarter of all non-interest spending was dedicated to these mandatory health programs. Within 30 years, CBO estimates that about 40 percent of all non-interest spending will be on these programs.8
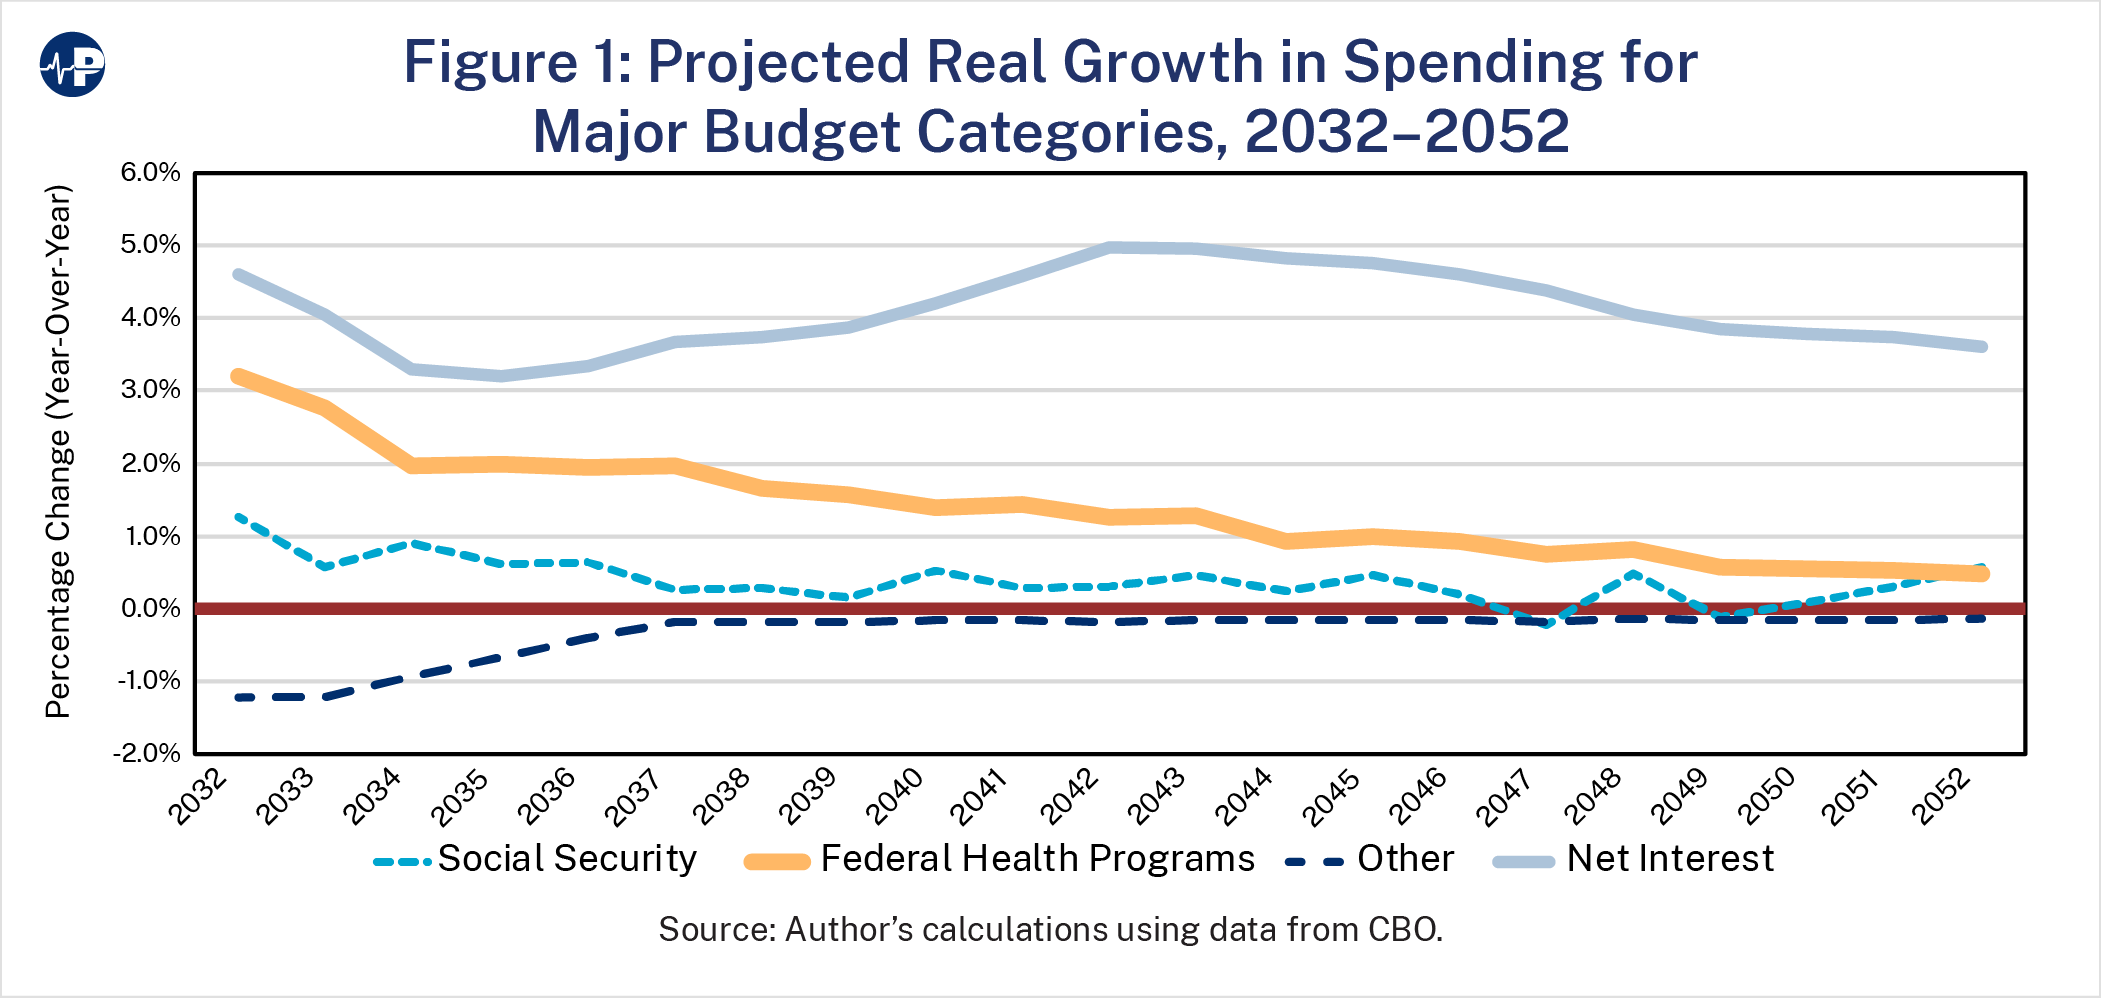
Figure 1 shows the projected real (i.e. inflation-adjusted) annual growth in spending under CBO’s long-term budget outlook that assumes excess cost growth will decline throughout the period.9 Between 2032 and 2052, annual spending on health programs (adjusted for inflation) is expected to grow between 0.5 and 3 percentage points. At the same time, interest payments are expected to grow faster than 3 percentage points indefinitely, primarily because of the growth in federal health spending. The expected growth in spending in other major categories is relatively modest. For example, CBO assumes that spending unrelated to health, Social Security, and interest will decline in real amounts. The recent increases in discretionary spending indicate that this expectation is likely unrealistic. Regardless, it demonstrates that spending growth in health, interest, and Social Security could begin to “crowd out” spending in other areas through the erosion of fiscal space.
A central estimate in this paper is the amount of fiscal space available to the federal government that is necessary for managing fiscal risks, including economic downturns. These fiscal risks could include normal business contractions, pandemics, wars, and other events that would affect the economy and result in significantly reduced revenue and increased spending. There are multiple characteristics of the United States that increase the amount of fiscal space available relative to other countries. These characteristics include a stable government, flexible monetary and fiscal policy systems that can adjust to high interest rates, the high demand for its debt as a safe asset, a dominant reserve currency, and relative trade openness.
To estimate the amount of remaining fiscal space, I must first estimate the level of debt at which primary balances will never be sufficient to pay net interest payments under the current spending and revenue baseline. In other words, it is the point at which after paying for all the government’s current commitments the U.S. Treasury will no longer have enough incoming revenue to service the debt. For this estimate, I use the fiscal space estimates for advanced countries derived from Ghosh et al. based on historical and projected interest rates as estimated by the International Monetary Fund (IMF). Historical rates include average interest rates on public debt since 1998.
Based on the historical and projected interest rates, the limit on which U.S. debt will increase continuously is 183 and 161 percent of GDP, respectively.10 There is also a dynamic component given that interest rates will significantly increase as the level of debt approaches a “hard limit”—the point at which investors will begin to lose faith in the ability of the U.S. to repay its debt. In other words, as debt increases, the government will need to pay higher interest rates on that debt to attract buyers, and it is difficult to know when the U.S. will hit its “hard limit.” Therefore, I use only the point at which the federal government will exhaust borrowing capacity for the purposes of this paper.
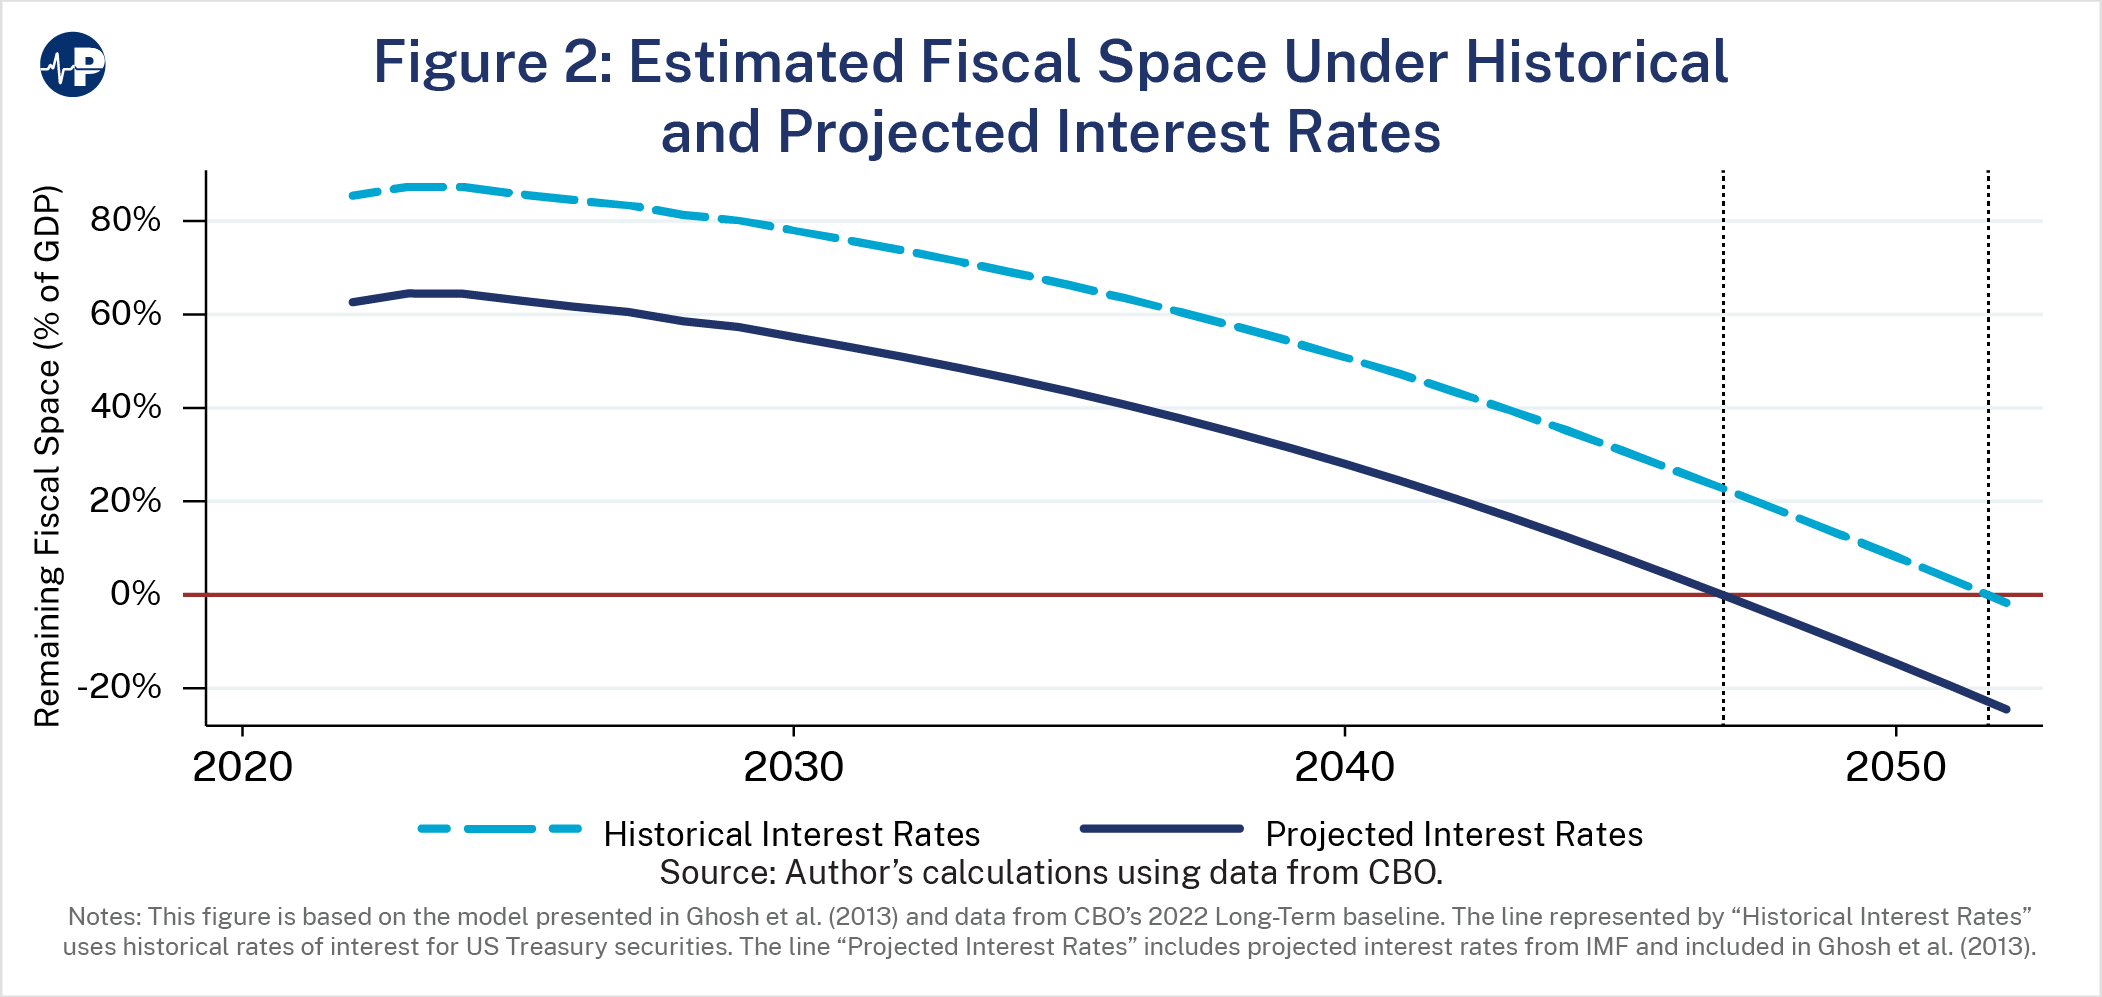
I then estimate the remaining fiscal space using debt projections as a percent of the economy under CBO’s long-term budget outlook.11 Figure 2 shows the remaining fiscal space assuming historical and projected interest rates on federal debt. The figure suggests that the federal government will exhaust all remaining fiscal space as early as 2047. In other words, the government will no longer have the capacity to take on additional debt without compromising market access or debt sustainability.
Importantly, these estimates also assume that there will be no events between 2023 and 2047 that reduce the amount of fiscal space in addition to what is already assumed under the CBO baseline. In other words, these estimates do not calculate for economic contractions, natural events, or wars that would necessitate a substantial increase in the stock of debt and worsen the situation. This analysis also does not account for other budgetary risks, such as the projected depletion of the Medicare Hospital Insurance (HI) Trust Fund in 2028 or the Social Security Old Age and Survivors Insurance (OASI) Trust Fund in 2032. If I estimate fiscal space while assuming that an event with fiscal effects such as the COVID-19 pandemic were to affect the federal budget in 2025, the fiscal space would instead be exhausted as early as 2045, dependent on projected or historical interest rate assumptions.
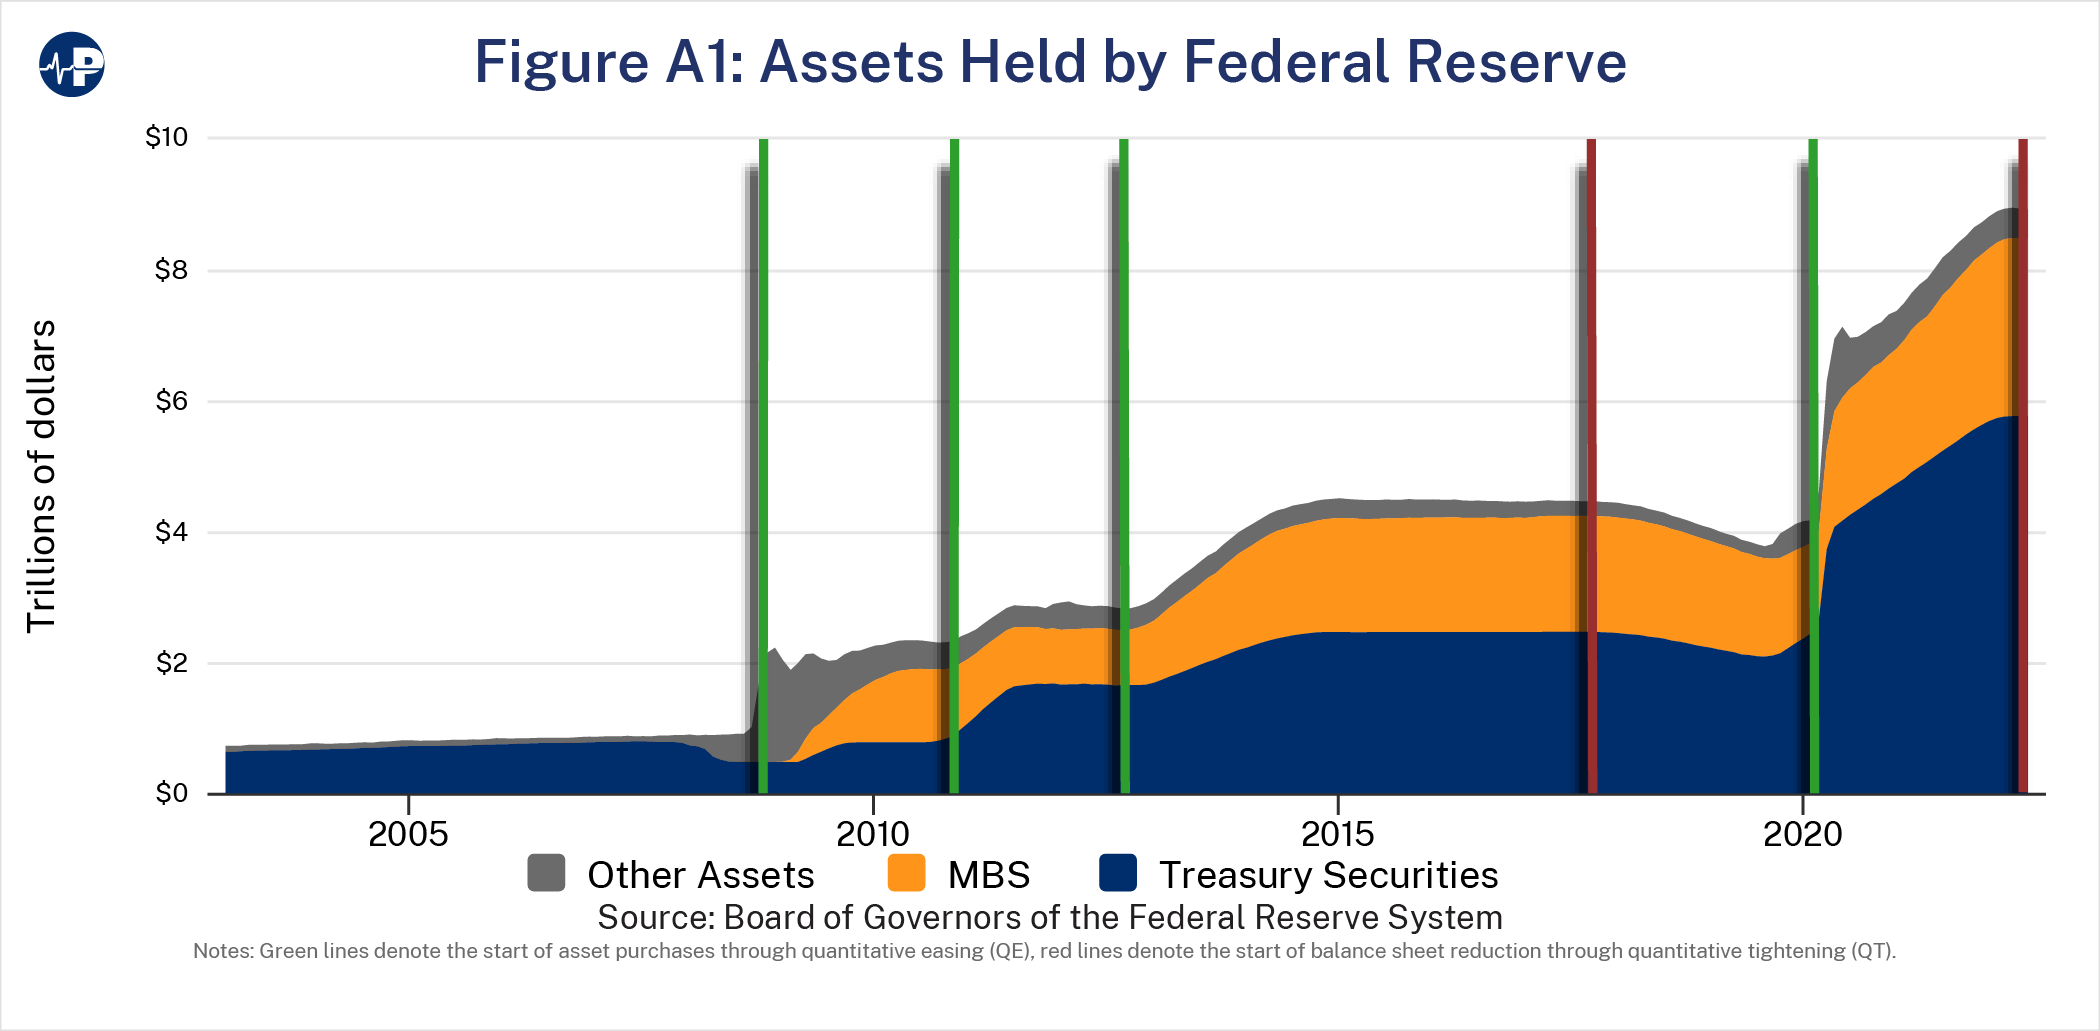
However, this calculation does not adjust for debt held by the Federal Reserve and was not included in the original estimation by Ghosh et al. Federal Reserve holdings have become much more significant since the COVID-19 pandemic; excluding these holdings from the calculation might reflect the effect of government debt on credit markets more accurately.12 For example, following the increased spending associated with World Wars I and II, no more than about a tenth of the debt was monetized.13 However, since the CARES Act was enacted in 2020, about 55 percent of the debt has been monetized (by the end of November 2022). Privately held debt amounts to almost the entire remainder with only a very small percentage of the new spending being paid for with additional revenues.14
It is likely that the Federal Reserve will monetize more debt in the future than it has historically. However, the upper threshold for how much debt the Federal Reserve can monetize is far short of 100 percent. Specifically, the Federal Reserve is limited by its mandate to maintain stable prices and to maintain its credibility to exert sound monetary policy. As the U.S. has recently experienced, a fiscal policy that puts pressure on the Federal Reserve to hold U.S. debt comes at the cost of higher inflation. Therefore, if the accumulation of federal debt reaches a point where the primary balances are never sufficient to pay interest payments, it would likely trigger either a fiscal or a currency crisis.
The U.S. government is also the world’s monopoly supplier of safe assets (U.S. Treasuries) and has historically exploited its market power by undersupplying safe assets.15 However, if private debt markets view U.S. Treasuries as less safe thereby reducing the U.S. monopoly position, the welfare of people in the rest of the world will increase as the welfare of those in the U.S. will decrease. Other countries, therefore, have an incentive to engage in reforms that challenge the U.S.’s monopoly status in providing safe assets to the rest of the world.
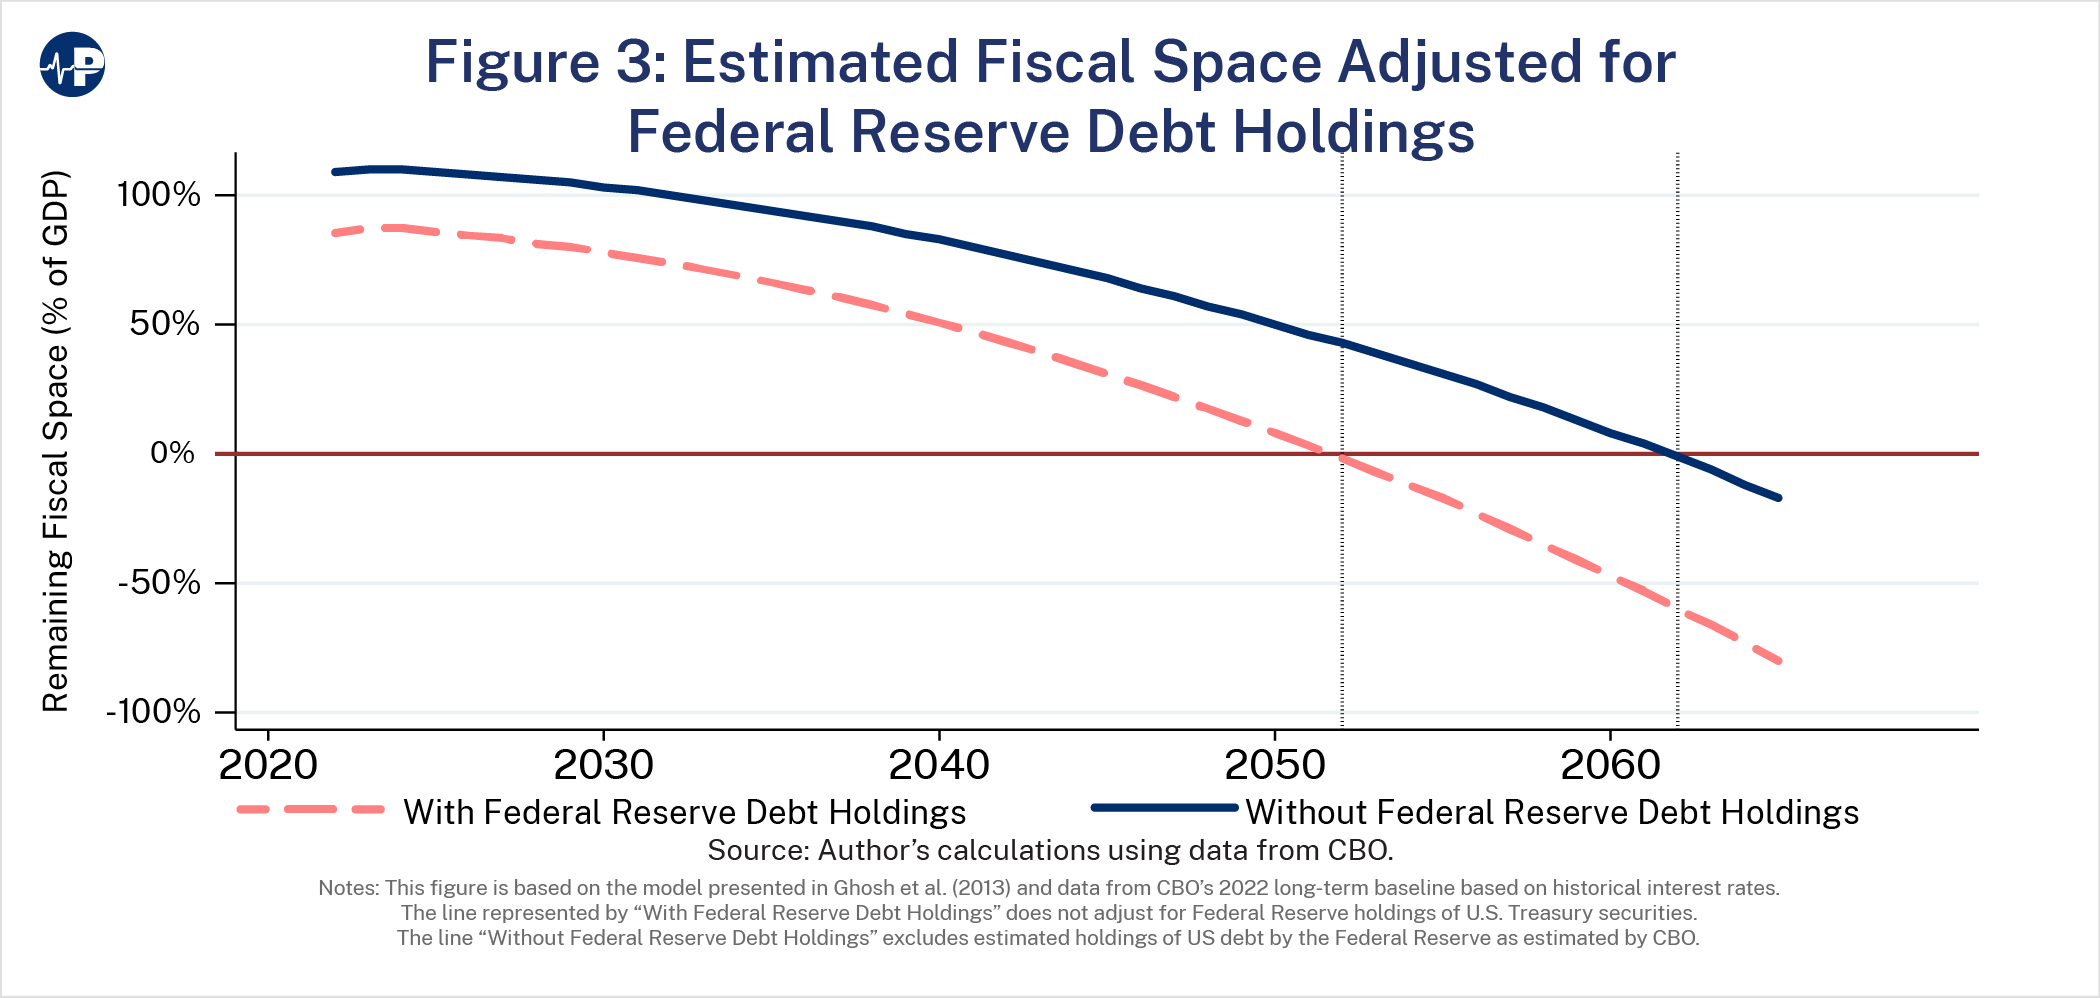
Currently, the Federal Reserve holds about 24 percent of the publicly held debt, although it is in the process of reducing its balance sheet.16 CBO assumes that debt held by the Federal Reserve will decline to 13 percent within the decade.17 In Figure 3, I compare two scenarios where the Federal Reserve’s holdings are excluded against the fiscal space calculation relative to including them in the fiscal space calculation. Excluding the holdings shifts the estimate of the exhaustion of fiscal space by 10 years. In the case where historical rates are used, this moves the exhaustion date from 2052 to 2062.
Moody’s Analytics also provides an estimate of fiscal space. In 2021, Moody’s estimated that the U.S. had about 150 percent of GDP of remaining fiscal space.18 If this more optimistic scenario is correct, it would shift fiscal space exhaustion another eight years, or until 2070. However, Moody’s estimates in 2021 were based on interest rates that were lower than they are today. This suggests that their model would estimate a lower level of available fiscal space if replicated in late 2022. However, the estimates in this paper provide a range of scenarios with the prediction that fiscal space would be exhausted between the late 2040s and 2070.
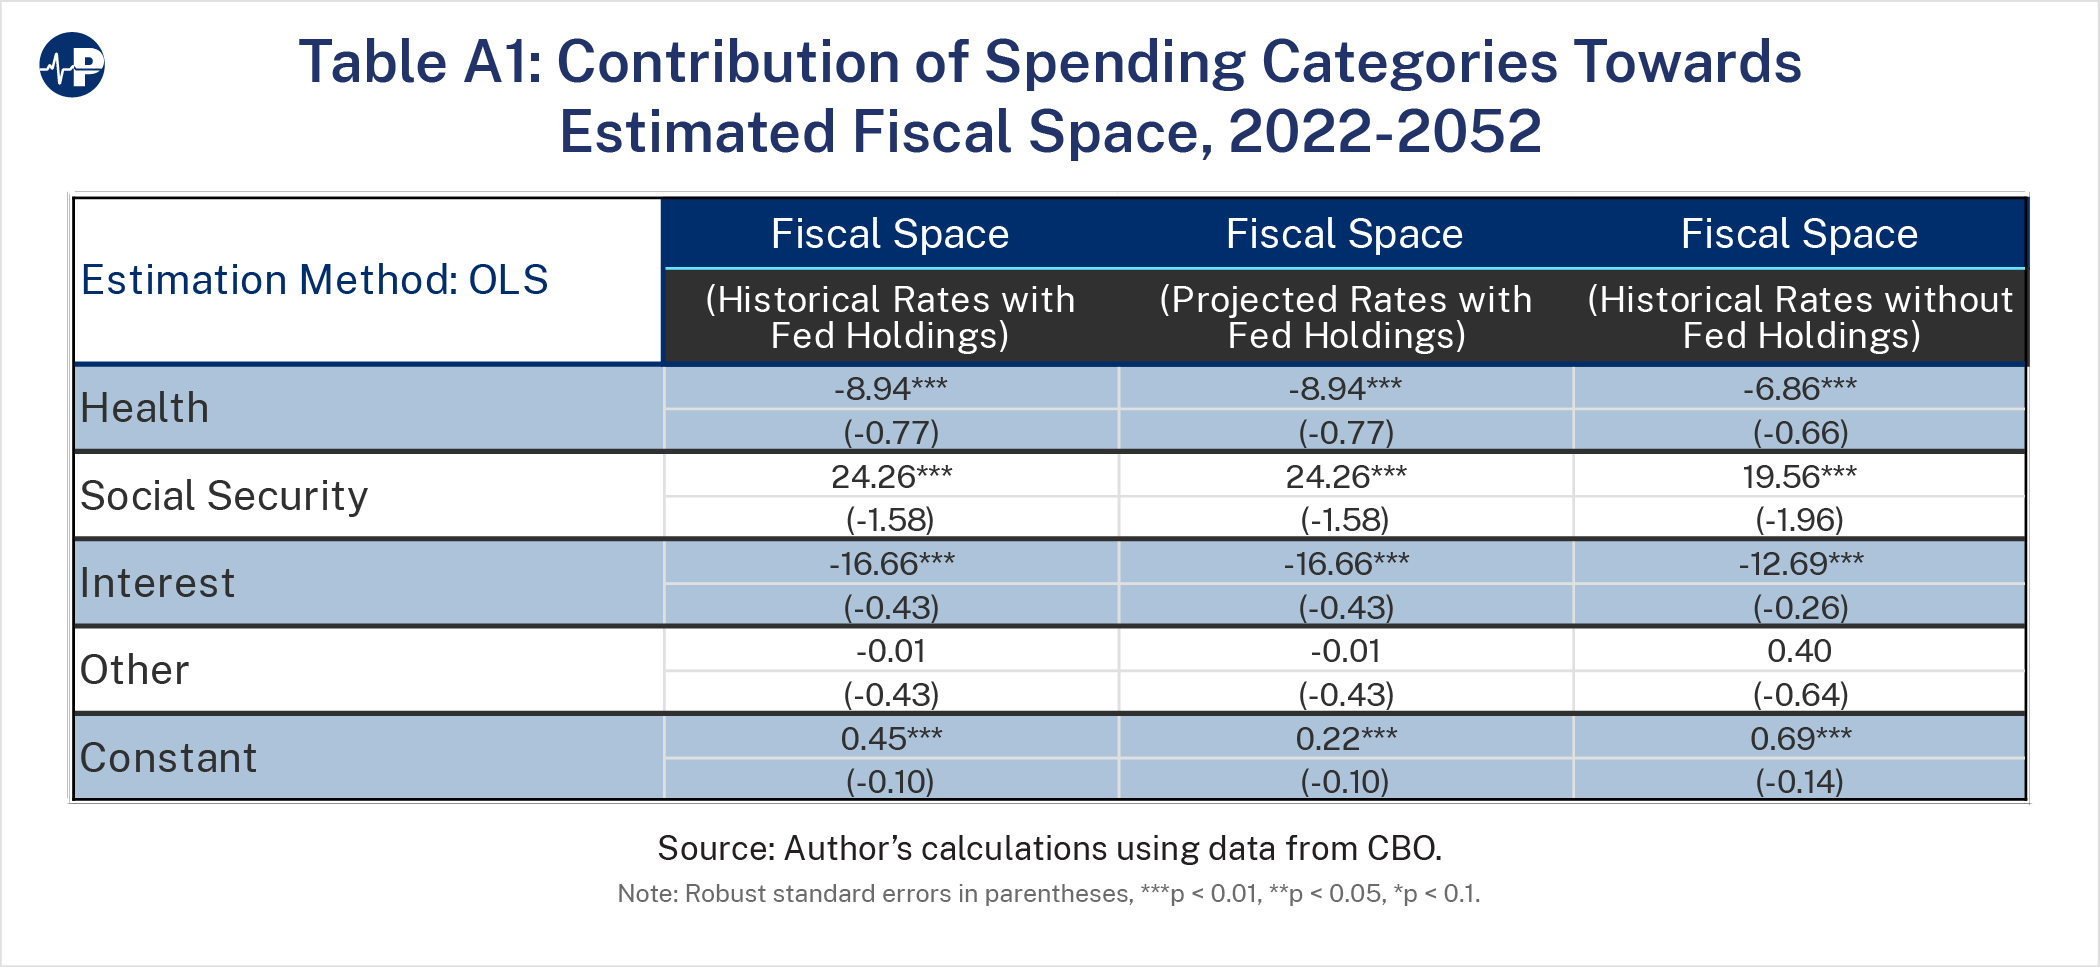
Next, I estimate the extent to which different categories of spending contribute to the fiscal space over the next 30 years. For this analysis, and all remaining analyses, I use estimates of fiscal space assuming historical interest rates and without adjustments for Federal Reserve debt holdings. As demonstrated by Figure 2, this is a conservative assumption based on known parameters. Again, I use spending projections assumed in CBO’s long-term budget outlook. For this estimate, I use a linear estimating equation where fiscal space is a function of net federal spending on federal health programs, Social Security, net interest, and all other federal programs. The full results of this estimating equation are in Table A1 in the appendix. CBO expects that over the next 30 years, federal health spending will increase from 6 to 9 percent of GDP.19 Holding all other factors equal, the results of this estimation imply that this increase in health spending over this period will be associated with a reduction in fiscal space by about 26 percent of GDP. CBO also projects that net interest payments will increase from about 2 percent to 7 percent of GDP by 2052. All else equal, this increase would be associated with a reduction in fiscal space by about 84 percent of GDP. These two factors alone—health spending and interest payments—can explain almost the entire reduction in fiscal space over the next 30 years.20
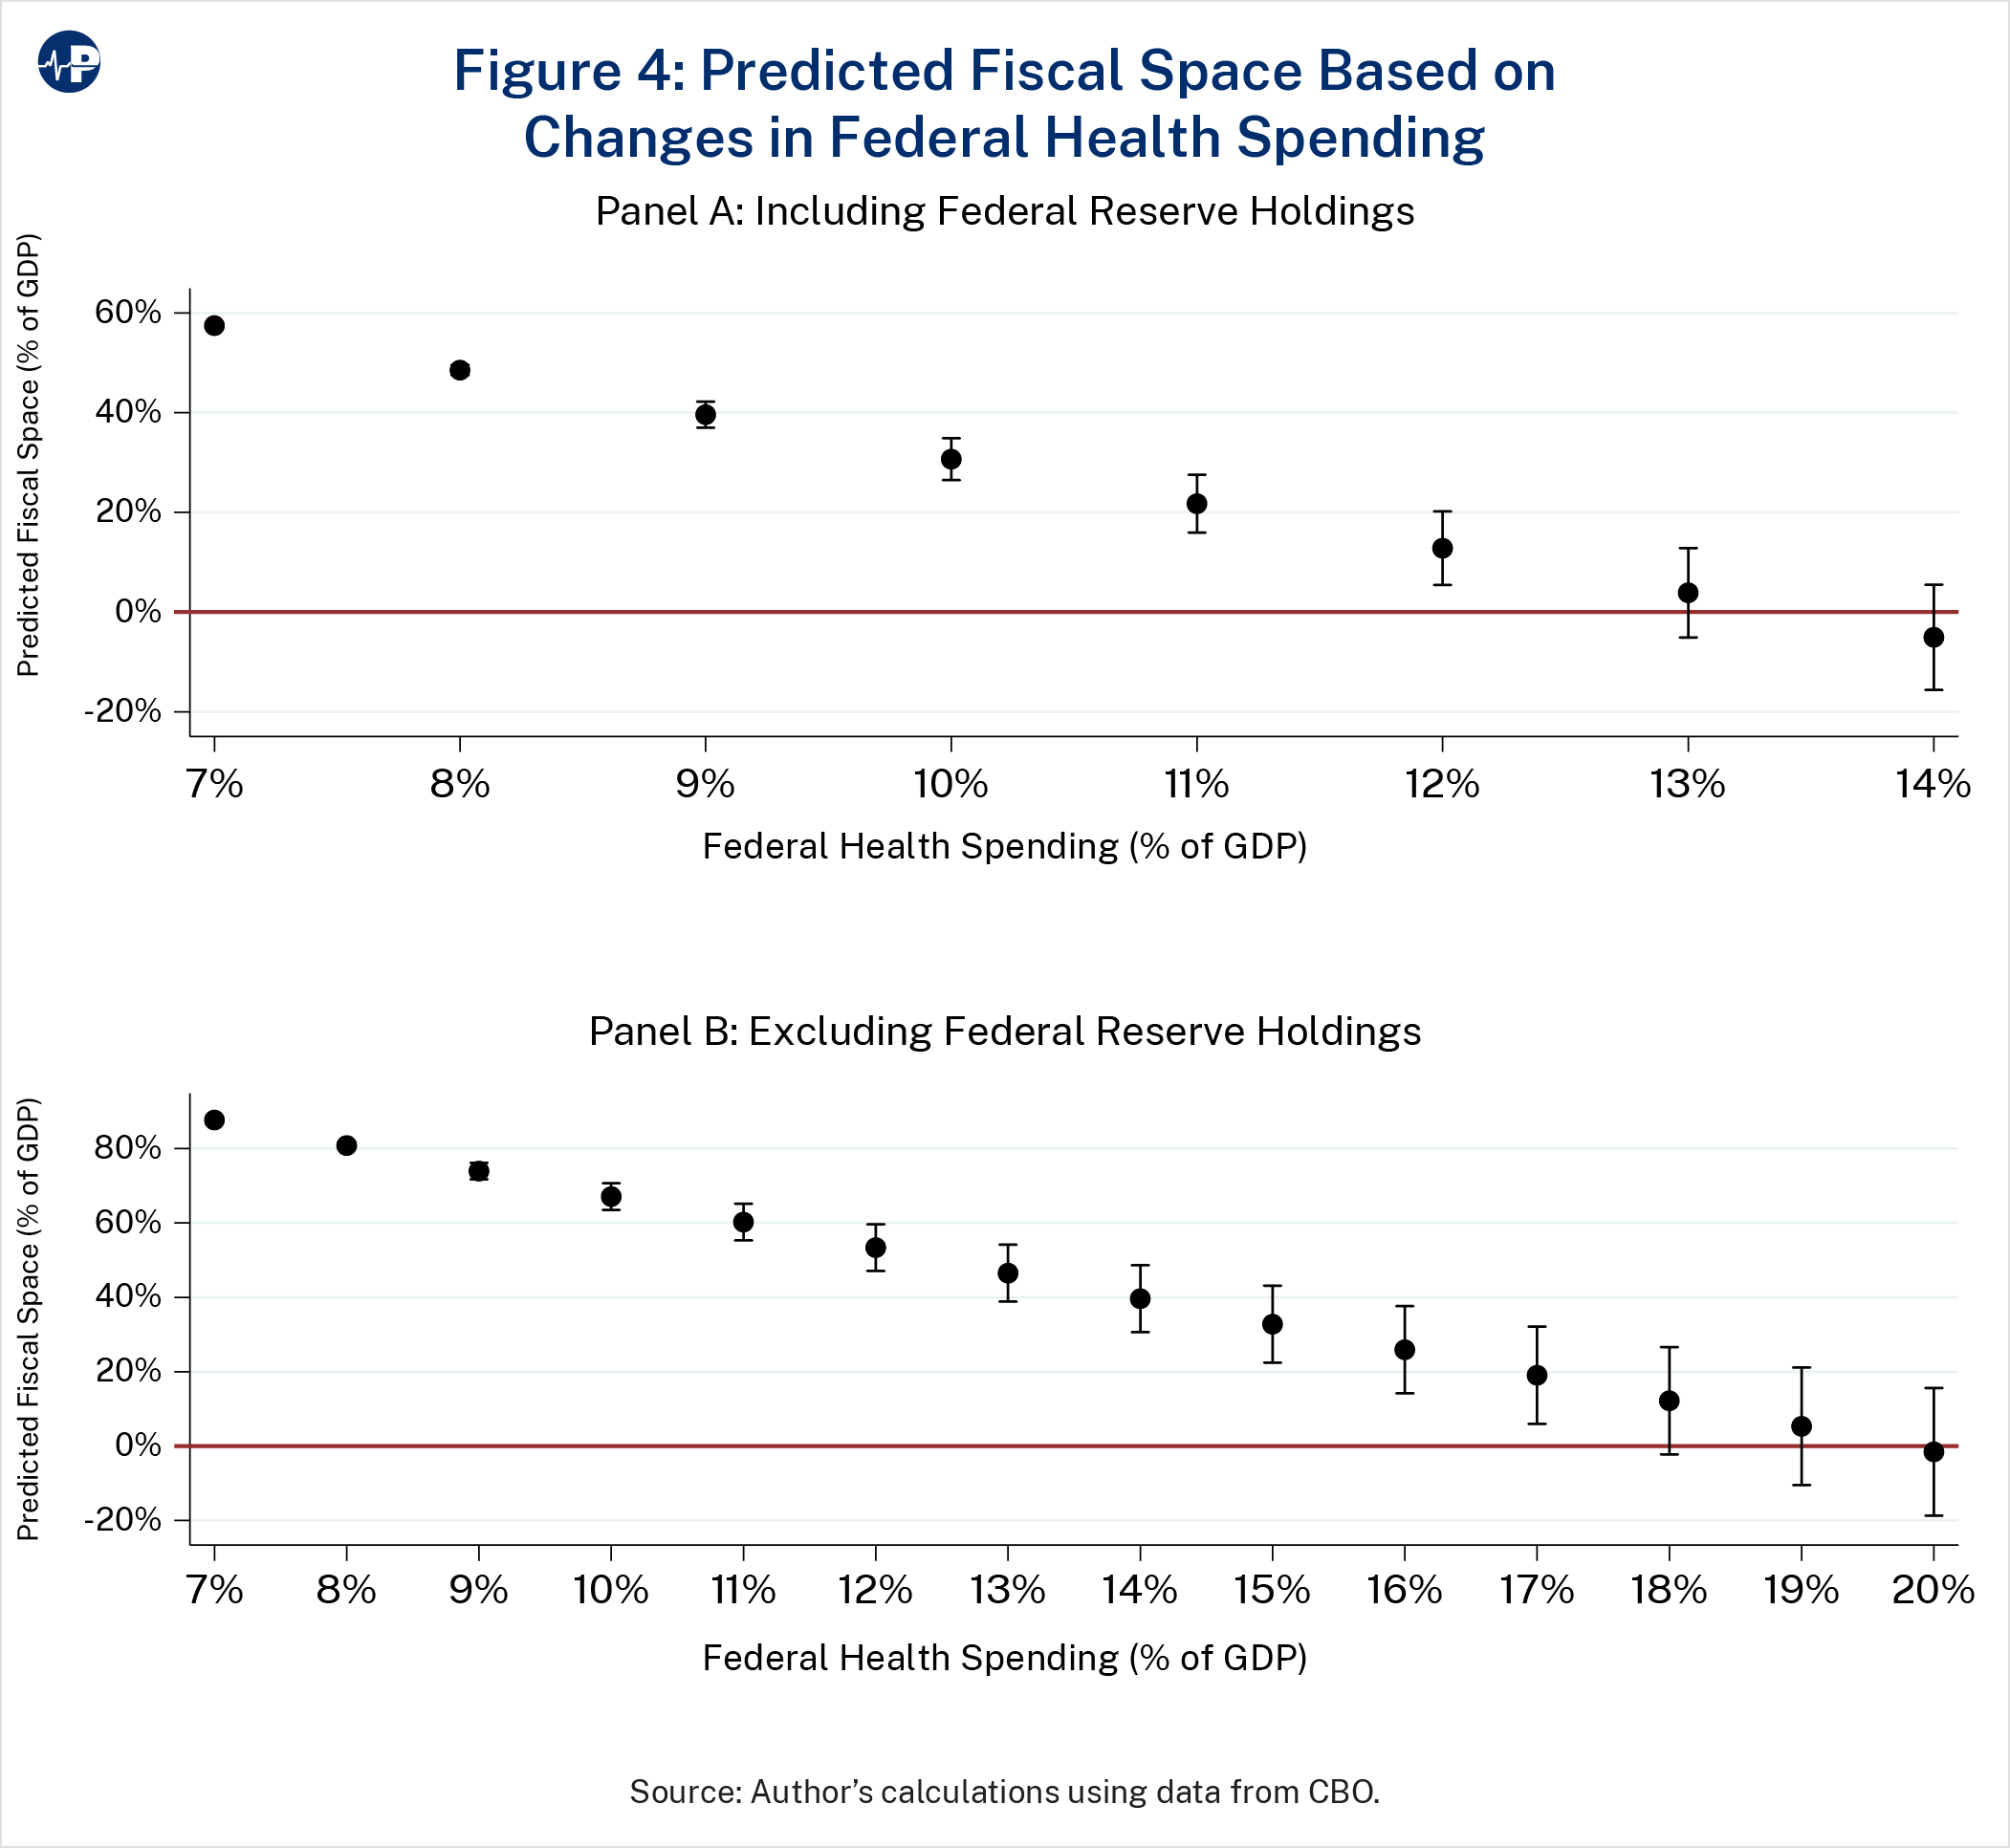
Figure 4 shows fiscal space at different levels of spending on federal health programs as a percent of GDP holding other spending constant, providing a predictive margin for the loss of fiscal space as federal health spending rises. Specifically, fiscal space is expected to decrease at a rate of between 7 to 9 percent of GDP for every 1 percentage point of GDP the government spends on federal health programs beyond the current percentage of GDP devoted to federal health spending.21 This is partly driven by increasing interest costs associated with additional health care spending as well as the projected consistent increase in real federal health spending over the next 30 years. Today, federal health spending is at 6 percent of the economy. Panel A shows predicted fiscal space if Federal Reserve debt holdings are included within the fiscal space calculation. Panel B shows predicted fiscal space if Federal Reserve debt holdings are excluded. Holding other spending constant, predicted fiscal space will be exhausted as federal spending on health programs reaches between 14 and 20 percent of the economy (i.e., double or a little more than double what it was in 2022). In summary, the more the government spends on federal health programs, the faster the country runs out of fiscal space.
Per capita spending on federal health programs has historically increased faster than per capita economic growth. CBO assumes that this increase cannot continue forever because doing so permanently would be unsustainable. They instead assume that beginning in 11 years (or just outside the 10-year budget window), excess cost growth will regress to growth in the economy.22 CBO has included this optimistic assumption in every annual update to its long-term budget outlook, meaning that CBO’s long-term outlook is conservative.
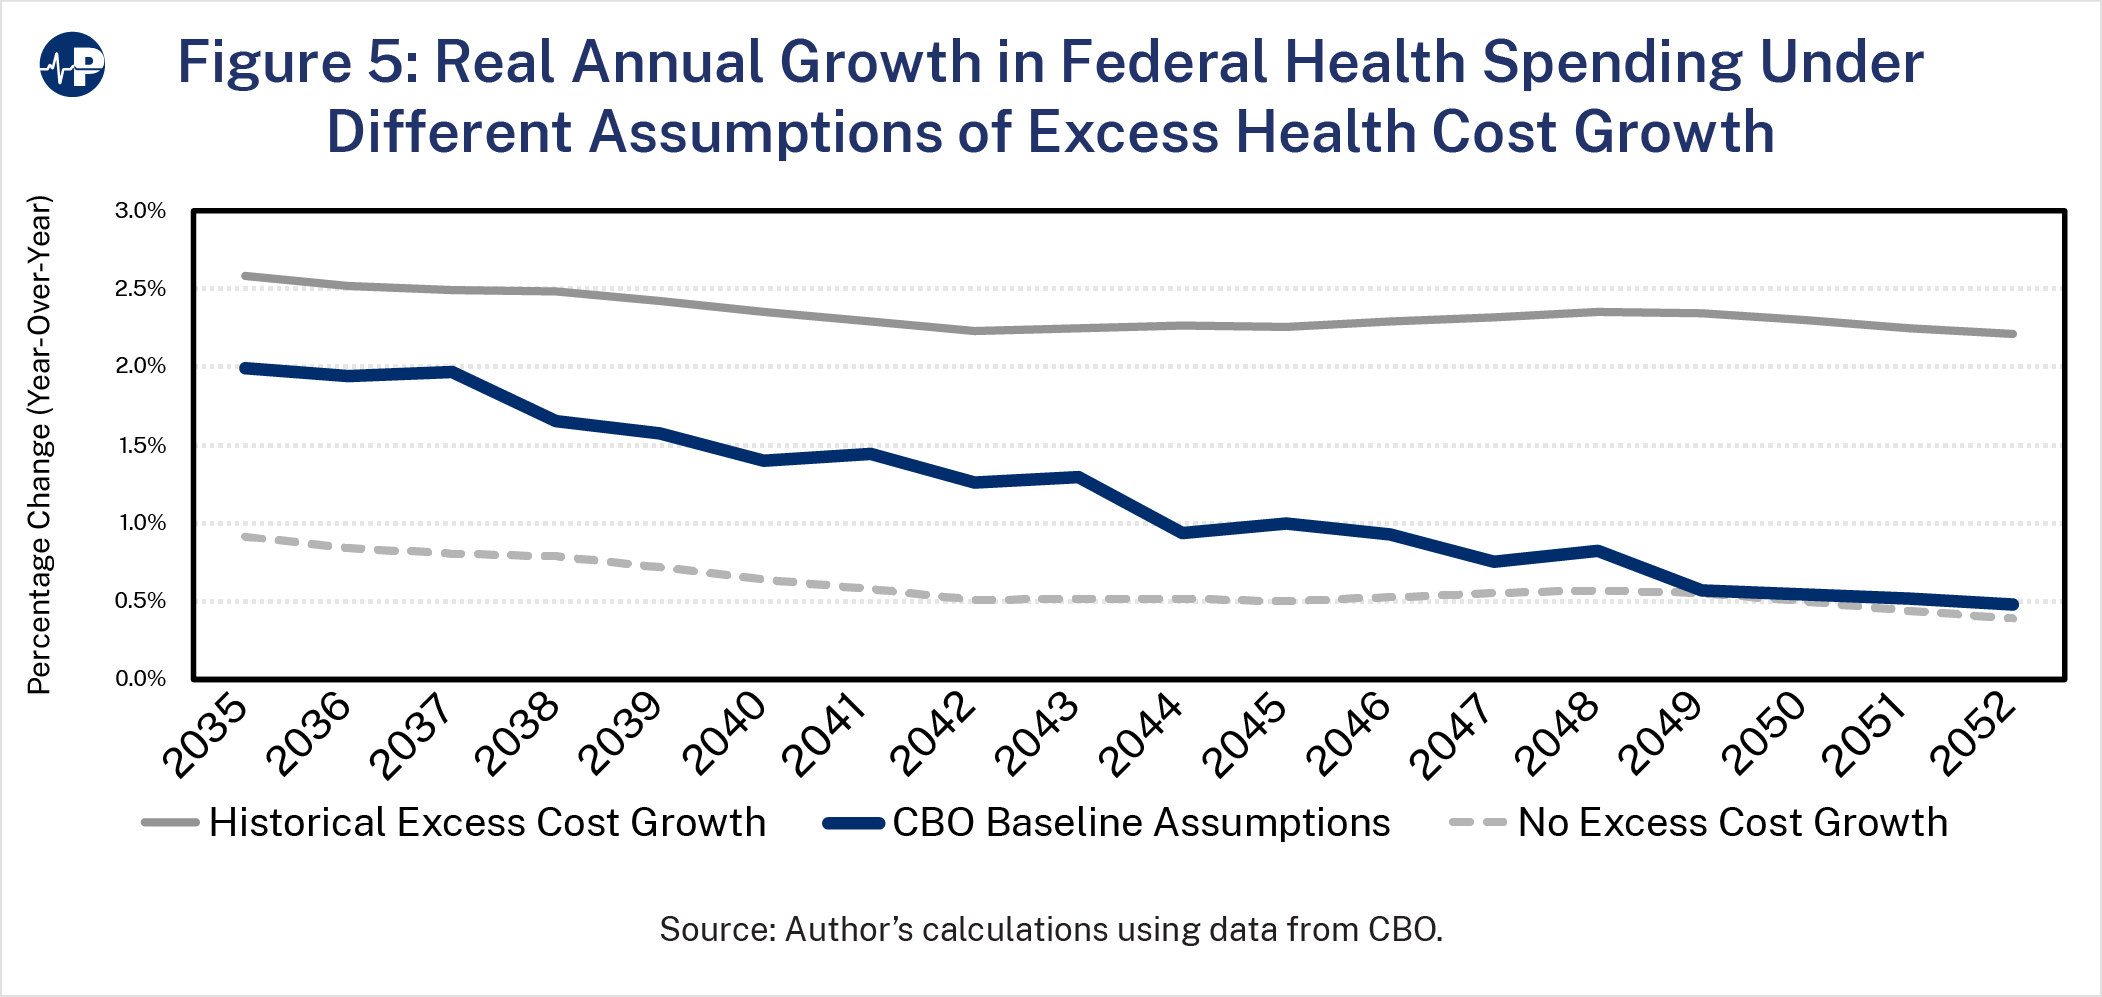
This raises the important question of how sensitive my estimates of remaining fiscal space are to the assumptions about federal health spending growth. In other words, how might higher (or lower) levels of excess cost growth affect the erosion of fiscal space? Figure 5 shows real annual growth in federal health spending for assumptions of both historical excess cost growth and no excess cost growth relative to CBO’s baseline.23 Through 2050, the average annual increase would be about 1.7 percentage points higher excess health cost growth relative to CBO’s baseline. Over the next 30 years, the accumulated difference in total health spending under this higher excess cost growth scenario would be about 0.8 percent of GDP over the entire period relative to CBO’s baseline.
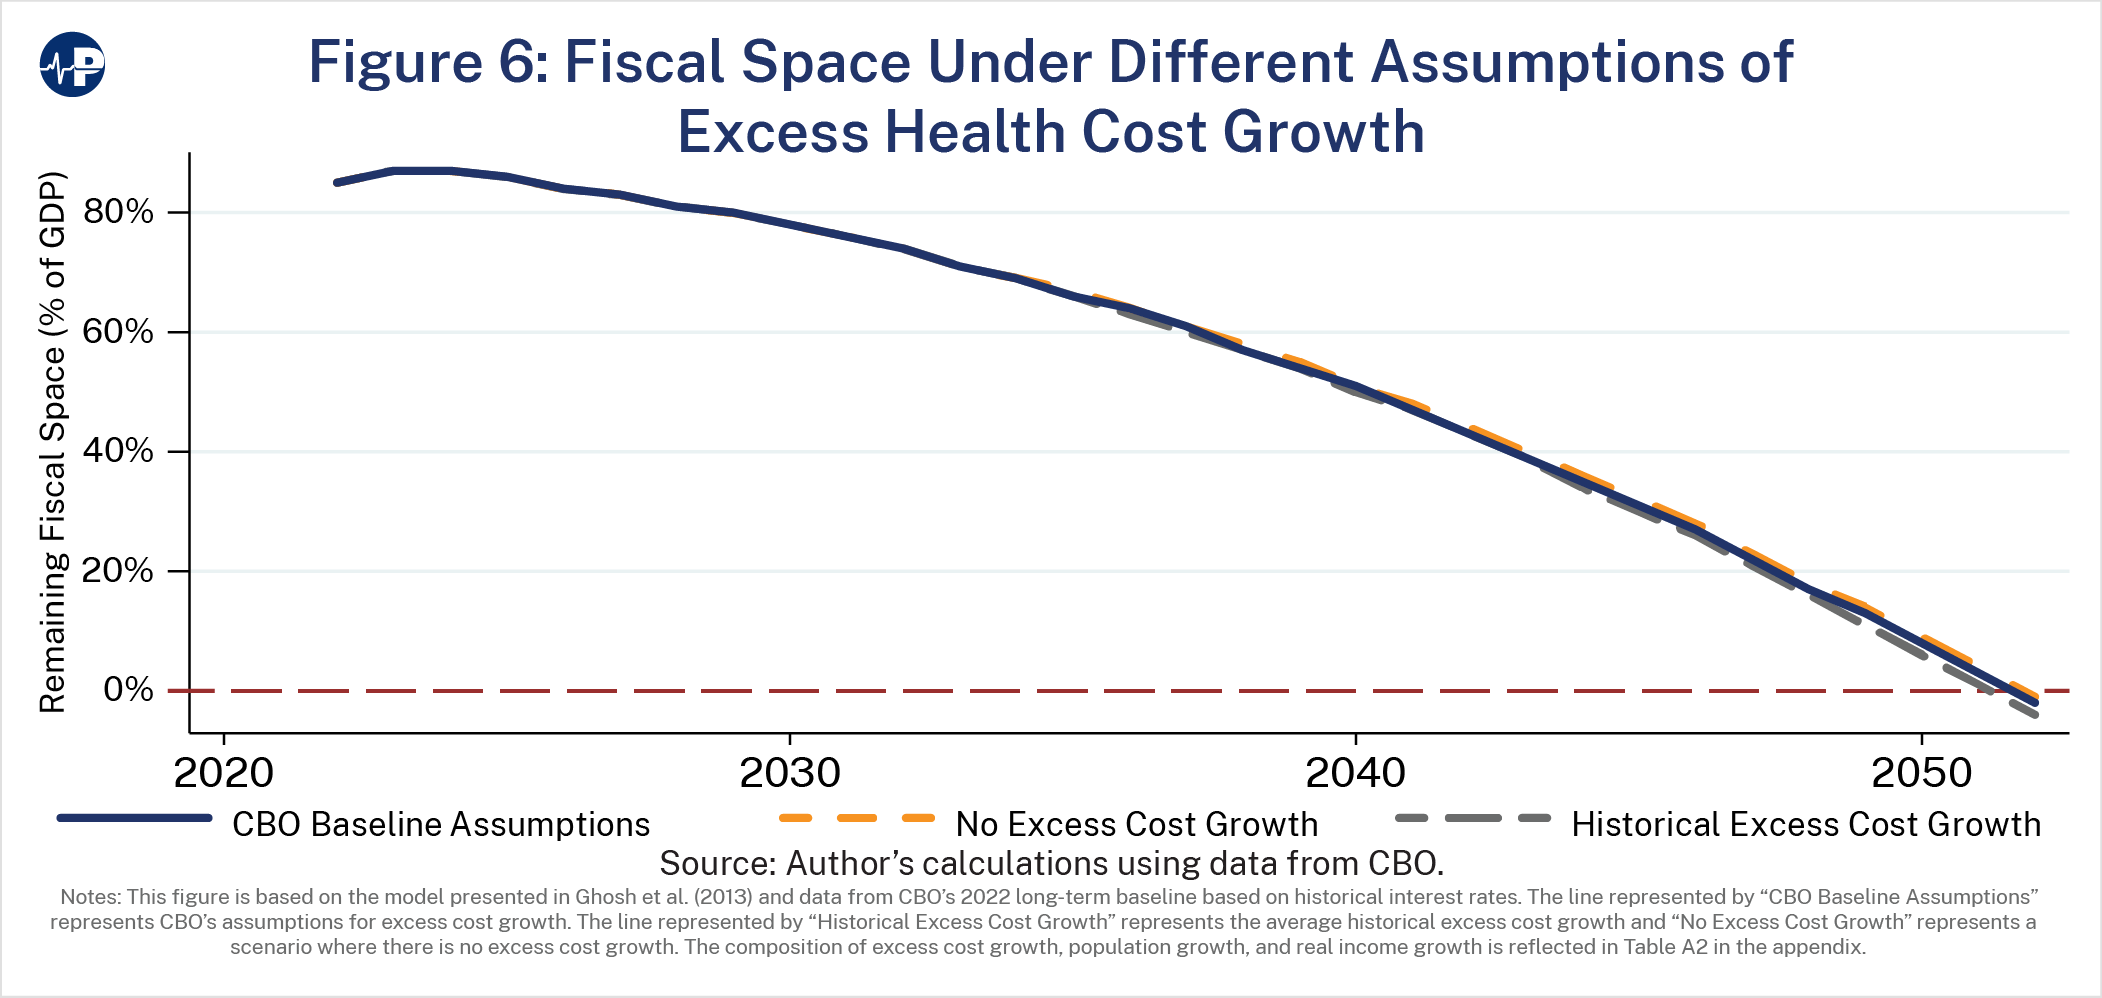
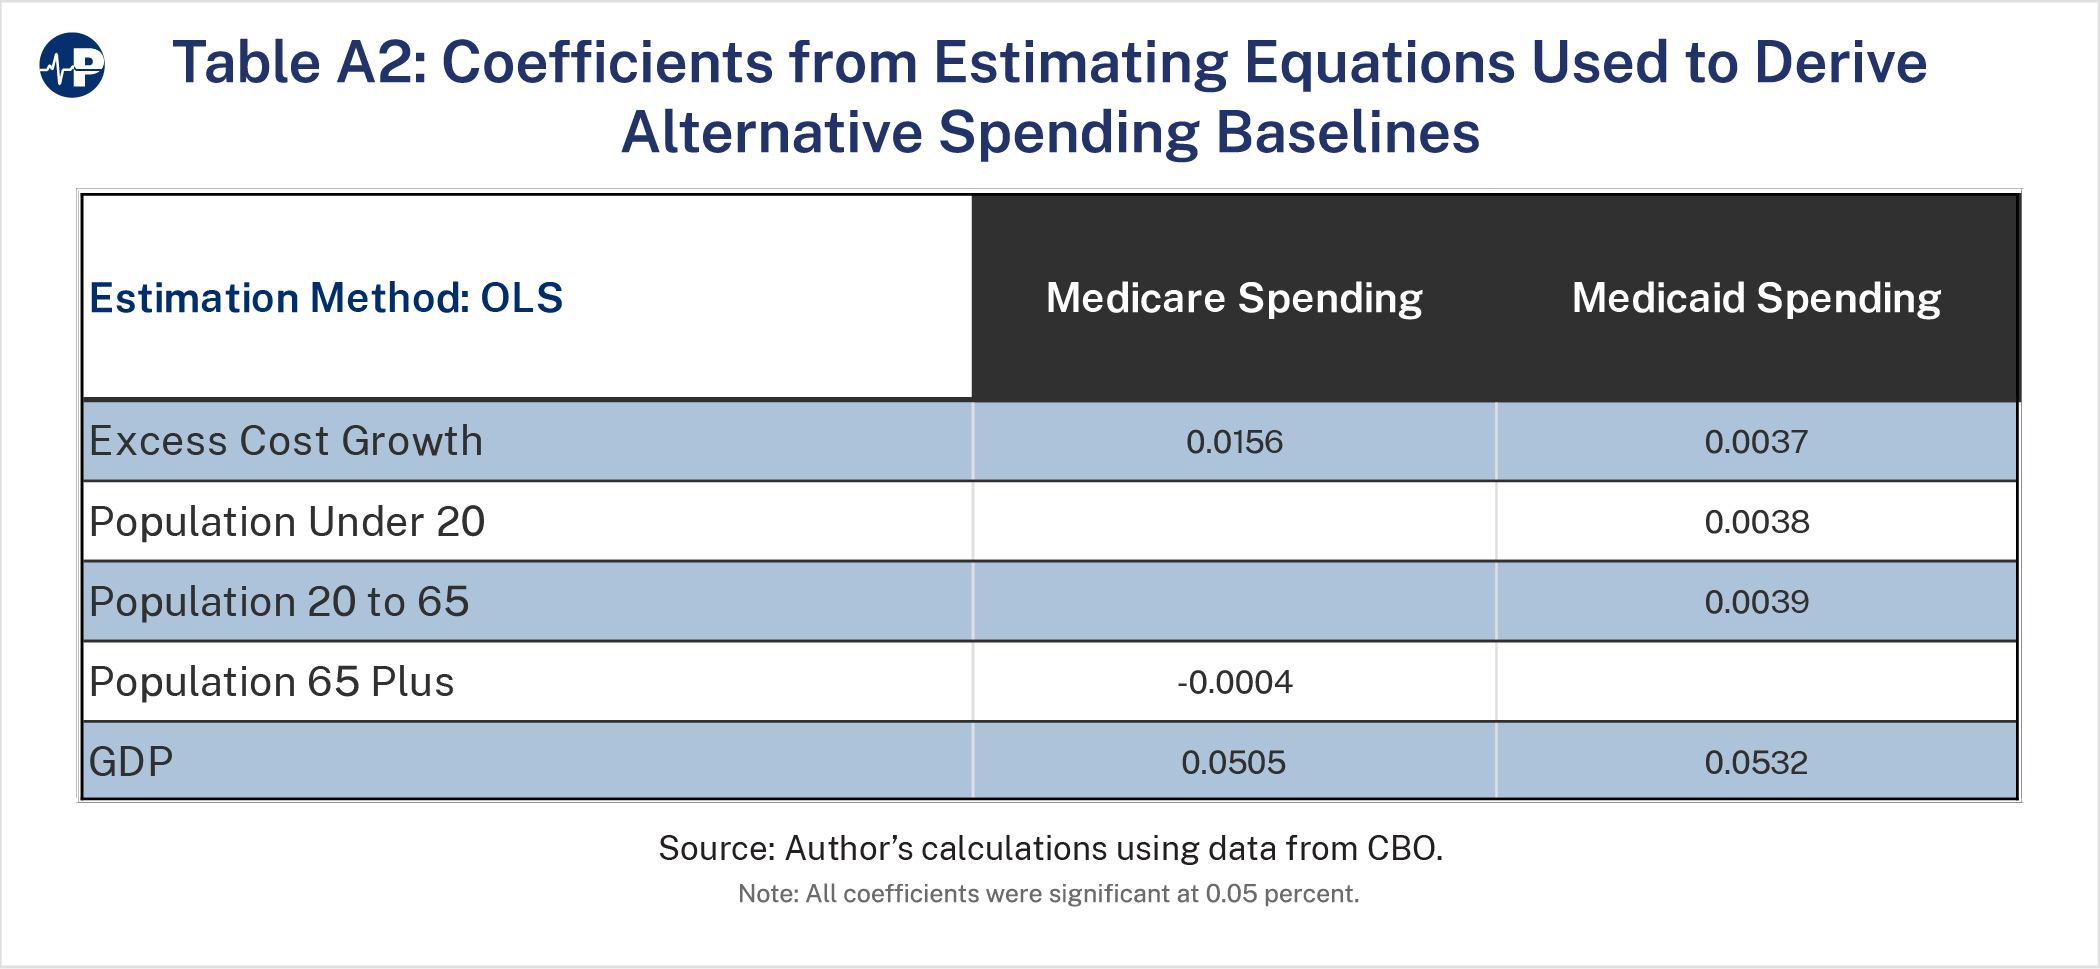
Figure 6 shows remaining fiscal space assuming historical levels of excess cost growth and no excess cost growth relative to CBO’s baseline assumptions. This shows that there is very little change in the fiscal space under these three scenarios. There are four factors explaining this finding. First, I find that the most significant factor in explaining the growth in federal health spending is real growth in the economy (see Table A2 in the appendix).24 Second, federal health spending is expected to continue increasing faster than economic growth in the near term even if excess health care cost growth converges to economic growth over the very long run (i.e., the next 75 years). Third, CBO assumes the convergence of excess cost growth with GDP at a rate of about 2 to 4 percent per year depending on the program. This reduction is not fast enough to keep pace with the erosion of fiscal space. Fourth, the 0.8 percent of GDP difference is less than the projected amount of remaining fiscal space after 2045. In other words, the difference in excess cost growth assumptions will shift the exhaustion date for fiscal space, but they are not meaningful enough to significantly adjust the trajectory. The only way to shift course is to make meaningful reductions in federal health spending relative to trend within the next decade
Thus far, this paper has demonstrated that the U.S. federal government will exhaust the fiscal space necessary to adequately accommodate fiscal risks, such as economic contractions and other events that are associated with a significant increase in debt. I have also shown that the estimated exhaustion of fiscal space is primarily driven by increased spending on mandatory health programs and interest projected under the CBO baseline. In essence, the current trajectory of the federal budget is unsustainable, and this unsustainability is primarily driven by federal spending on mandatory health programs and on the interest that must be paid since federal health spending substantially contributes to annual budget deficits.
In this section, I estimate the level of reductions in spending on federal health programs that would be needed for both the federal budget and health programs to be sustainable over the next two decades. In other words, I try to answer the question of how to avoid a situation in which there is no remaining fiscal space. To achieve this, I develop two scenarios. The first assumes that total spending on federal health programs would not grow faster than economic growth beginning in 2025. The second assumes that spending would be reduced by larger amounts earlier in the budget window of 30 years but then allowed to grow at rates faster than economic growth, so that there would be remaining fiscal space for the next 30 years. The second scenario would require additional adjustments outside the 30-year period because fiscal space would eventually be exhausted.
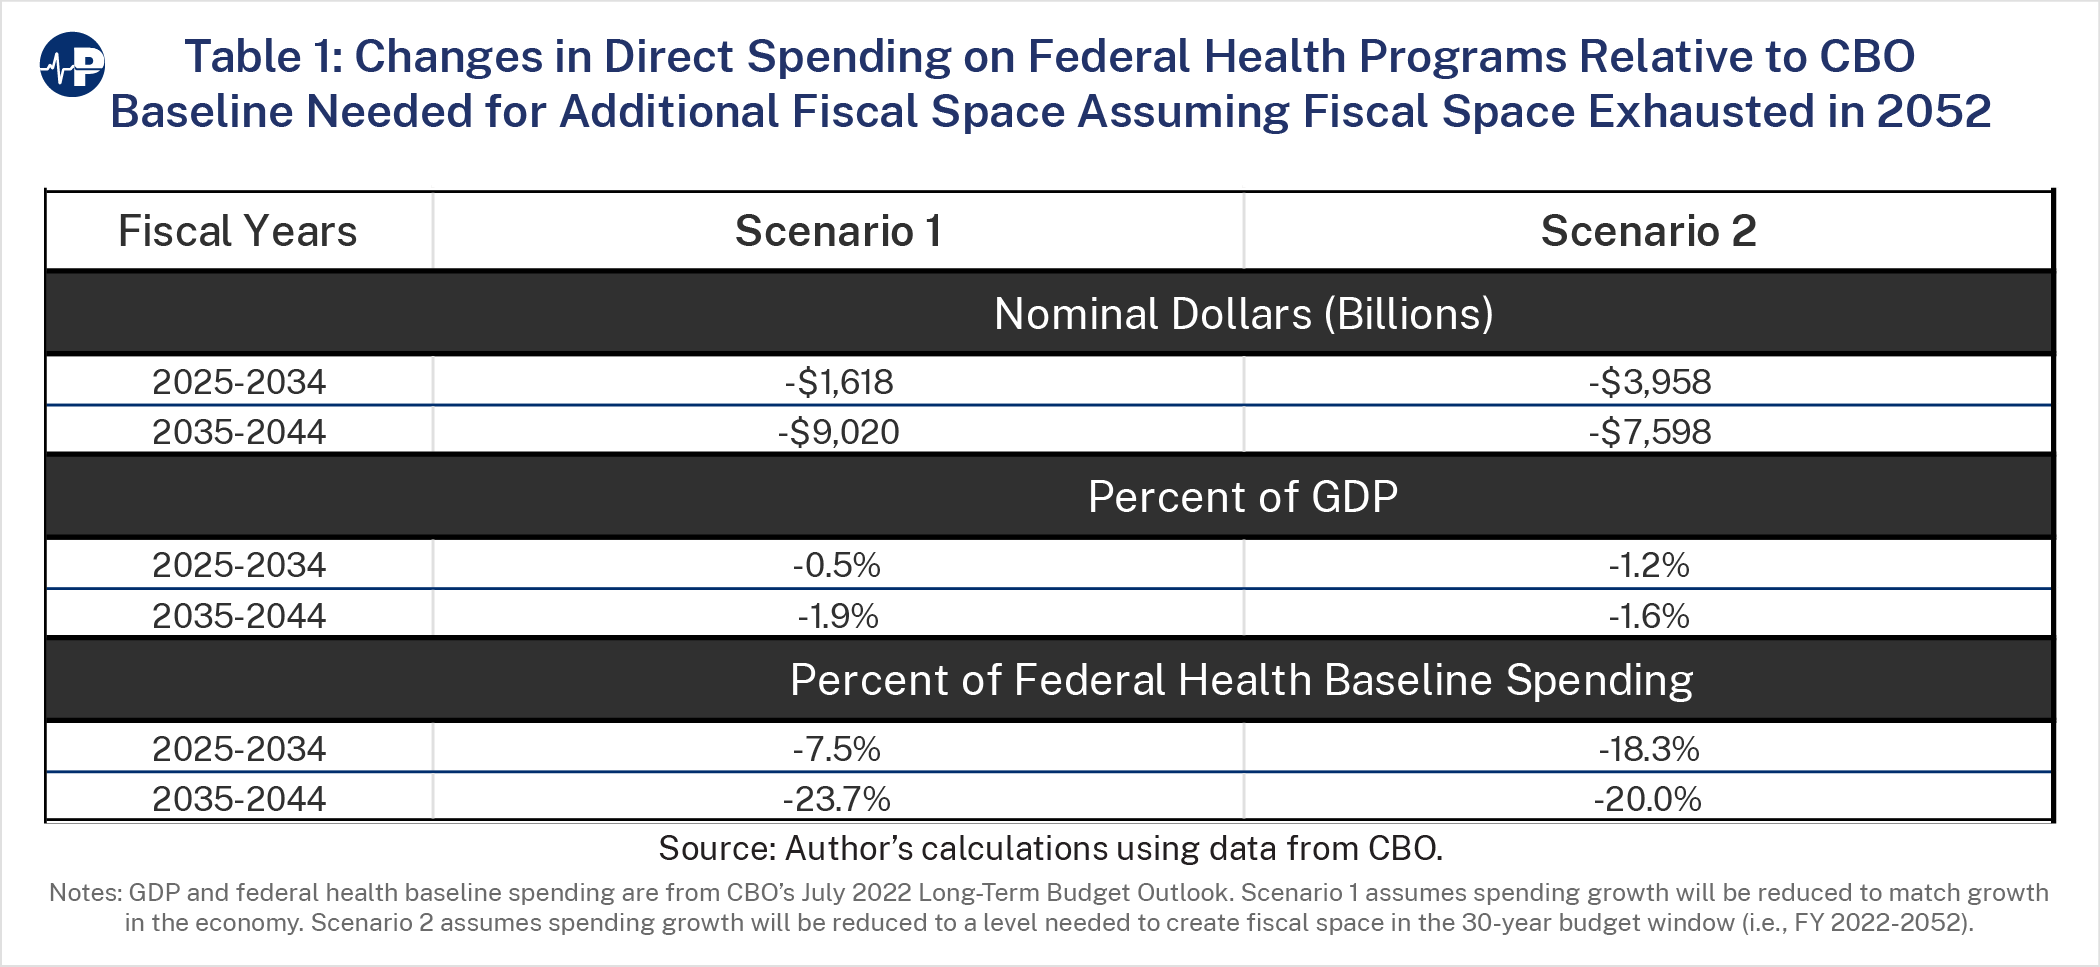
Table 1 shows the spending reductions relative to baseline needed to achieve both sustainable scenarios. The first scenario, in which growth in spending never exceeds economic growth, would require a spending reduction in nominal dollars relative to the baseline of about $1.6 trillion over the 10-year period from 2025 to 2034. This is equivalent to reducing federal health spending as a percent of GDP by 0.5 percent over the next 10 years or as a percent of total federal health spending by 7.5 percent over the period. The second scenario would require a larger reduction in the first 10-year period of nearly $4 trillion in nominal spending, or 1.2 percent of GDP, relative to baseline spending but then a smaller reduction in the second 10-year period.
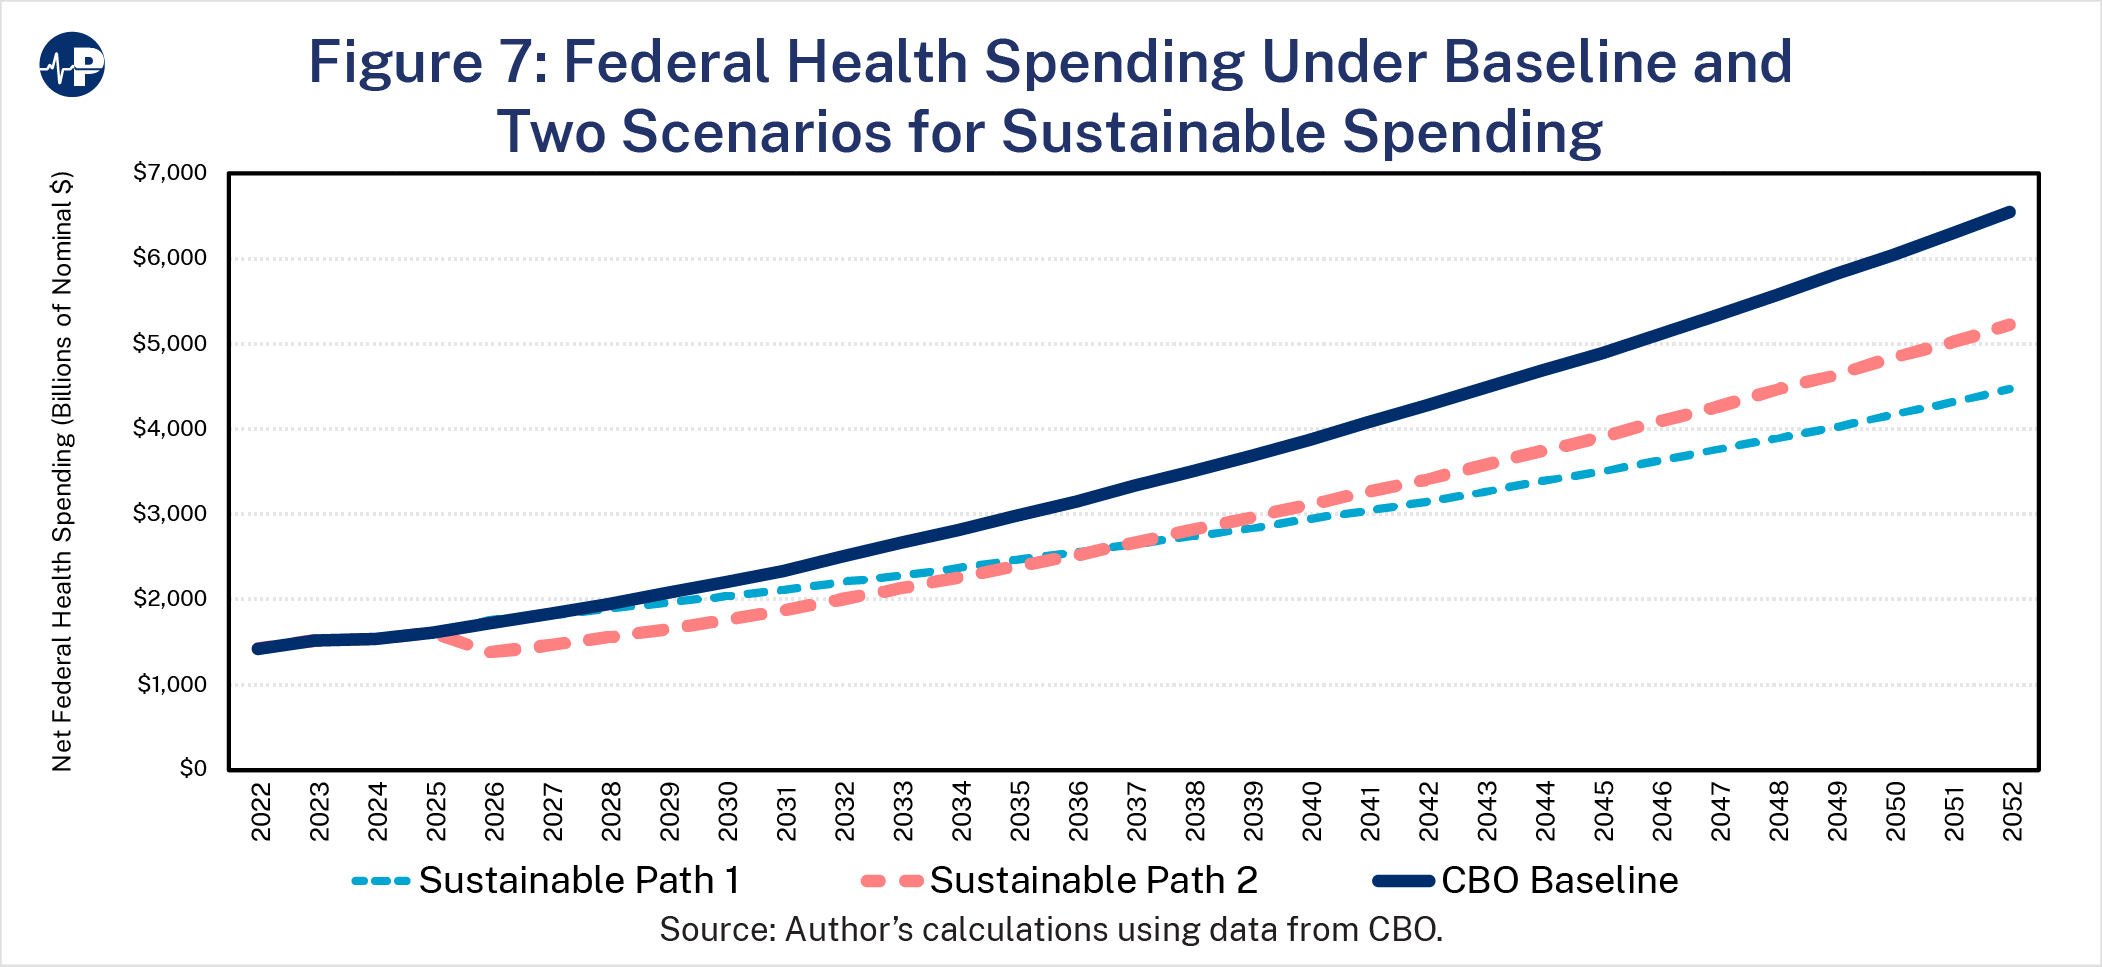
Figure 7 shows the growth paths of both sustainable scenarios relative to CBO’s baseline. Only the “Sustainable Path 1,” in which growth in spending never exceeds economic growth, would allow for annual spending growth to increase each year in nominal dollars. “Sustainable Path 2” would require a 15 percent reduction in nominal spending over the first 10 years. However, as shown in both Table 1 and Figure 7, the reduction in spending after the first 10 years would be more significant for the first sustainable path.
This paper examines the extent to which fiscal space—or the capacity of the federal government to take on additional debt without compromising market access or debt sustainability—will be exhausted in the next 30 years. Federal spending on health programs and interest payments on debt are the most significant causes of the erosion of fiscal space. In fact, spending on these two categories explains almost all the estimated erosion in fiscal space over the next 30 years. Furthermore, increased spending on health program absent structural reforms will contribute to rising interest costs which are a function of total spending and debate.
My estimates suggest that there is time for policymakers to improve the nation’s fiscal space and avoid a dismal economic future. But that time is running out. To avoid significant nominal spending reductions and other adverse consequences, federal policymakers must consider reforms to federal health programs immediately. There is enough fiscal space in the next two decades to allow for reduced growth in spending, relative to baseline, while providing time for the market to adjust to a new level of government spending. Specifically, under CBO’s baseline assumptions, the remaining fiscal space is equivalent to about 60 percent of GDP over the next 10 years and 45 percent over the next 20 years. However, without policymakers’ timely interventions to reduce federal deficits and health program spending, fiscal space will experience significant erosion within the third decade that will require costly adjustments to
avoid a fiscal or currency crisis.
To avoid potentially severe cuts in services or the economic fallout from such a crisis, policymakers should begin to structurally reform federal health programs within the next ten years. Future work would both examine historical attempts to limit the growth in health spending and explore specific options to ensure that federal health programs are fiscally sustainable.